
Agricultural Mapping Services Market Size by Product, Application, Region – Segment-Level Market Assessment, Growth Opportunity Analysis, Competitive Mapping & Forecast to 2027
Overview
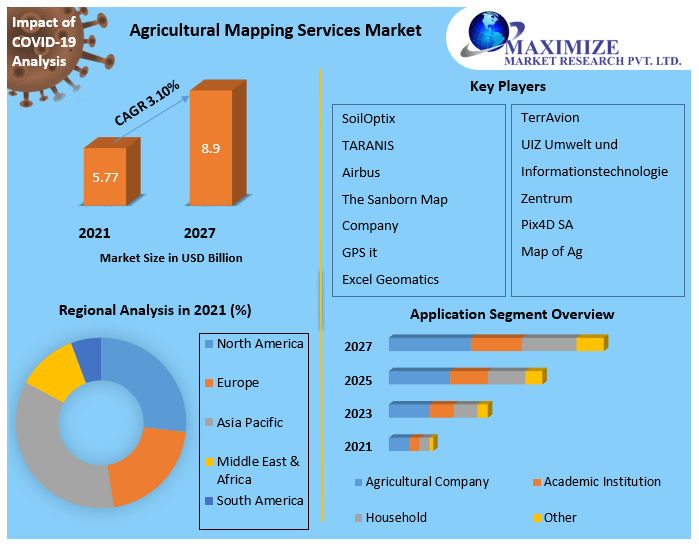
Agricultural Mapping Services Market was valued at US$ 5.77 Bn. in 2021. The Global Agricultural Mapping Services Market size is estimated to grow at a CAGR of 3.10 % over the forecast period.
Agricultural Mapping Services Market Overview:
The report explores the Agricultural Mapping Services market's segments (Type, Interferometer Type, Application, End-User, and Region). Data has been provided by market participants, and regions (North America, Asia Pacific, Europe, Middle East & Africa, and South America). This market report provides a thorough analysis of the rapid advances that are currently taking place across all industry sectors. Facts and figures, illustrations, and presentations are used to provide key data analysis for the historical period from 2017 to 2020. The report investigates the Agricultural Mapping Services market's drivers, limitations, prospects, and barriers. This MMR report includes investor recommendations based on a thorough examination of the Agricultural Mapping Services market's contemporary competitive scenario
To know about the Research Methodology :- Request Free Sample Report
2021 is considered as a base year to forecast the market from 2022 to 2027. 2021’s market size is estimated on real numbers and outputs of the key players and major players across the globe. The past five years' trends are considered while forecasting the market through 2027. 2020 is a year of exception and analysis, especially with the impact of lockdown by region.
Agricultural Mapping Services Market Dynamics:
Agricultural mapping services are used to get the data related to crop mapping, yield estimation, irrigation amendment analysis, erosion identification, disintegration and remediation, creating different harvest models, itemized vegetation cover and checking, and land degradation assessment, increasing mapping services sales globally.
These services include investigation and demonstrative instruments to break down agricultural land and domesticated animal applications, expanding the deals of global agricultural mapping services. Other reviewing and mapping services incorporate organization agricultural mapping and topographic surveying.
Mapping services utilization has expanded of late because of the involvement of medium and high-resolution satellite sensors that give precise information about the harvests and soil. It establishes the yield and soil list maps through Normalized Difference Vegetation Index (NDVI). These advantages push the sales of global agricultural mapping services.
Drivers: Farmers and agricultural organizations are focusing more on increasing food efficiency because of the quickly developing population and significant growth in pay development across the globe. Agricultural mapping services give information connected with suitable land for the optimal growth of harvests, irrigation management, etc., which assist farmers with picking specific supplements and land to create more yield, increasing mapping services sales globally.
Besides, agricultural mapping service providers are helping farmers and producers by counseling and giving an exact land examination report to oversee soil and vegetation. These factors are estimated to boost the demand for agricultural mapping services. The rising involvement of governments to improve farming techniques is driving the growth of the agricultural mapping services market.
Restraints: Agricultural mapping services include cutting-edge innovations, for example, GPS and GIS, which makes it costly, and hence, farmers of rural regions can't manage the cost of these services. This is hampering the demand for agricultural mapping services/Mapping services.
Opportunities: Agricultural organizations, as well as governments, are dissecting and separating the farmable land as per the land creation limit by utilizing agricultural mapping services. Moreover, a few government research firms are attempting to work on the nature of soil harm/supplement lacking cultivating land by dissecting it with the assistance of agricultural mapping services, increasing mapping services sales globally.
Moreover, financial organizations have started using agricultural mapping services to assess farm dissolvability and commodities stock exchange by breaking down the general nature of cultivating land. These factors are boosting the demand for agricultural mapping services.
Agricultural Mapping Services Market Trends:
In March 2021, Syngenta declared that it would redevelop its North American Crop Protection central command in Greensboro, North Carolina.
In July 2020, DeHaat sent off the establishment model to extend its business in Eastern India. In this model, the organization restricts with little undertakings in rustic regions to get horticultural contributions from organizations, for example, Bayer Crop Sciences and offer it to ranchers, in addition to secure rancher's produce from inside a scope of 3-6 kilometers.
In November 2019, AGCO Corporation extended its Edgewood, Md get-together and dissemination office for Fendt high strength farm vehicles and Massey Ferguson smaller and utility farm haulers and hardware.
Pix4D Company is using drone mapping with suitable photogrammetry software for agricultural mapping services, increasing the sales of agricultural mapping services.
TARANIS introduced its agricultural mapping services in countries in the Asia Pacific such as India and China. Moreover, governments in the Asia Pacific region are encouraging local players by funding campaigns and pushing the overall sales of agricultural mapping services in the region.
Agricultural Mapping Services Market Segment Analysis:
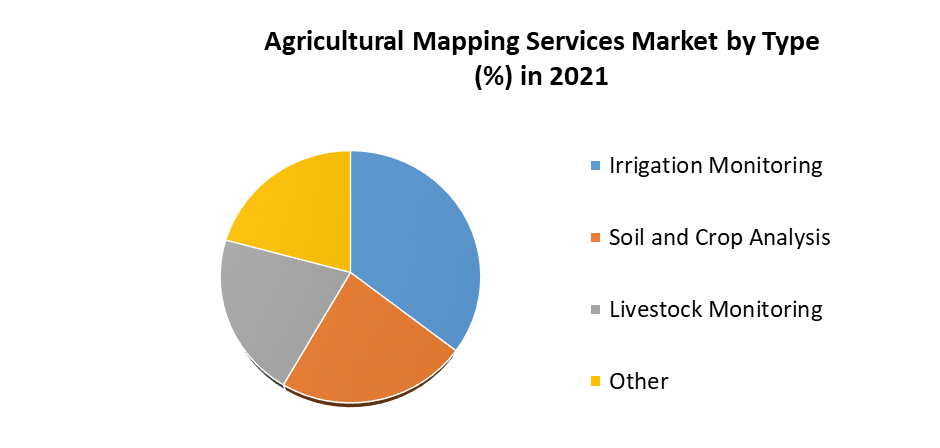 Based on Type, the Agricultural Mapping Services Market is segmented into Irrigation, Monitoring, Soil and Crop Analysis, Livestock Monitoring and Other
Irrigation monitoring will dominate the market over the forecast period. As water supplies become scarce as a result of climatic change, there is an urgent need to irrigate more productively to streamline water use. In this specific situation, farmers' utilization of a decision-support system is unavoidable. To be sure, the constant oversight of microclimatic conditions are the best way to realize the water needs of a culture
Based on Application, the Agricultural Mapping Services Market is segmented into Agricultural Company, Academic Institution, Household, Other
The agricultural company segment holds the largest share in 2021. Accuracy soil inspecting, information assortment, and information examination empower a confined variety of synthetic applications and establish thickness to suit explicit regions of the field.
The exact field route limits excess applications and skipped regions and empowers the greatest ground inclusion in the briefest conceivable time.
Capacity to deal with low permeability field conditions, for example, downpour, residue, mist, and dimness increments efficiency.
Agricultural Mapping Services Market Regional Insights:
The North American region held the largest market share accounting for 28% in 2021. Stringent principles and guidelines for involving pesticides according to the Federal Insecticide, Fungicide, and Rodenticide Act (FIFRA) in North America help the adoption of agricultural mapping services for the exact examination of farmlands. These elements add to the increase in sales of agricultural mapping services, including company agricultural mapping.
The Europe region is expected to witness significant growth at a CAGR of XX% through the forecast period. “Improvement of the Agricultural Structure and Coastal Protection” in Europe for improving agricultural farmland has established a significant market of agricultural mapping services in various countries across Europe.
The objective of the report is to present a comprehensive analysis of the global Agricultural Mapping Services Market to the stakeholders in the industry. The past and current status of the industry with the forecasted market size and trends are presented in the report with the analysis of complicated data in simple language. The report covers all the aspects of the industry with a dedicated study of key players that include market leaders, followers, and new entrants.
PORTER, PESTEL analysis with the potential impact of micro-economic factors of the market have been presented in the report. External as well as internal factors that are supposed to affect the business positively or negatively have been analyzed, which will give a clear futuristic view of the industry to the decision-makers.
The reports also help in understanding the Agricultural Mapping Services Market dynamic, and structure by analyzing the market segments and projecting the Agricultural Mapping Services Market size. Clear representation of competitive analysis of key players by Design, price, financial position, product portfolio, growth strategies, and regional presence in the Agricultural Mapping Services Market make the report investor’s guide.
Agricultural Mapping Services Market Scope: Inquiry Before Buying
| Agricultural Mapping Services Market | |||
|---|---|---|---|
| Report Coverage | Details | ||
| Base Year: | 2021 | Forecast Period: | 2022-2027 |
| Historical Data: | 2017 to 2021 | Market Size in 2021: | US$ 5.77 Bn |
| Forecast Period 2022 to 2027 CAGR: | 3.10% | Market Size in 2027: | US$ 8.9 Bn. |
| Segments Covered: | by Product | • Irrigation • Monitoring Soil and Crop Analysis • Livestock Monitoring • Other |
|
| by Application | • Agricultural Company • Academic Institution • Household • Other |
||
Agricultural Mapping Services Market by Region
• North America
• Europe
• Asia Pacific
• Middle East and Africa
• South America
Agricultural Mapping Services Market Key Players:
• Soil Optix
• TARANIS
• Airbus
• The Sanborn Map Company
• GPS it
• Excel Geomatics
• TerrAvion
• UIZ Umwelt und Informationstechnologie Zentrum
• Pix4D SA
• Map of Ag
Frequently Asked Questions about Agricultural Mapping Services Market
1] What segments are covered in the Agricultural Mapping Services Market report?
Ans. The segments covered in the Agricultural Mapping Services Market report are based on Type and Application.
2] Which region is expected to hold the highest share in the Agricultural Mapping Services Market?
Ans. The North American region is expected to hold the highest share in the Agricultural Mapping Services Market
3] What is the market size of the Agricultural Mapping Services Market by 2027?
Ans. The market size of the Agricultural Mapping Services Market by 2027 is expected to reach US$ 8.9 Bn.
4] What is the forecast period for the Agricultural Mapping Services Market?
Ans. The forecast period for the Agricultural Mapping Services Market is 2022-2027.
5] What was the market size of the Agricultural Mapping Services Market in 2021?
Ans. The market size of the Agricultural Mapping Services Market in 2021 was valued at US$ 5.77 Bn