Rare Earth Elements Market - Industry Structure Evaluation, Demand Drivers Analysis, Regional Growth Analysis and Identification, Competitive Positioning Review & Global Market Size Forecast to 2032

12.3%
CAGR (2026-2032)
9.46 USD Bn.
Market Size
300
Report Pages
131
Market Tables

Overview

Rare Earth Element Market was valued at USD 9.46 Bn. in 2025 and the total Global Rare Earth Element Market revenue is Expected to grow at a CAGR of 12.3% from 2026 to 2032 reaching nearly USD 21.3 Bn. by 2032.

Rare earth elements are a set of seventeen elements discovered in the earth's crust that have similar chemical and physical properties. Common rare earth elements include cerium, neodymium, erbium, holmium, lanthanum, praseodymium, yttrium, and dysprosium. High electrical conductivity, improved magnetism, and weight reduction are only a few of the advantages provided by these components. As a result, rare earth elements are used in a wide range of industries, including automobiles, transportation, power generation, construction, medical, and military applications.

Rare Earth Elements MarketTo know about the Research Methodology :- Request Free Sample Report

Rare Earth Element Market Dynamics:

Rare-earth permanent magnets are expected to be the fastest-growing market over the forecast period. The most common rare-earth elements used in permanent magnets are neodymium, praseodymium, dysprosium, terbium, and yttrium. These metals have special properties including remanence and high coercivity, which prevent permanent magnets from losing their magnetism over time. The automobile sector uses these magnets extensively, and their demand is impacted by them. Both conventional and hybrid autos employ rare-earth permanent magnets.

In catalytic systems, rare-earth metals are widely used. Their primary function in a catalyst system is to absorb, store, and release oxygen while also regulating the environment in which they work. Rare-earth metals such as lanthanum and cerium are extensively used in catalyst systems. They are generally used as catalysts in automotive and other vehicle catalytic converters, as well as in oil refinery fluid cracking catalysts (FCCs). Apart from increased worldwide unit sales, auto-catalyst demand is being boosted by more rigorous laws controlling vehicle emissions across the world. The demand for rare-earth metals in autocatalysts is expected to grow during the forecast period.

After China lowered its export quotas by 40% in 2015, claiming environmental concerns, prices for rare-earth metals surged. Due to growing demand and concerns about future availability, the price of dysprosium oxide, which is used in magnets, lasers, and nuclear reactors, climbed from USD 700 to USD 740 per kilogram.

These price oscillations, which are amplified by rising energy prices, are destabilizing rare-earth element supply networks. This makes it difficult for manufacturers to develop high-quality products while still generating a profit. Producers must determine whether to tolerate greater expenses or boost product pricing as raw material prices vary. The applications for which rare-earth metals are utilized affect the demand for them.

Rare-earth metals were comparatively affordable until new applications were discovered. The cost of rare-earth metals has risen dramatically, causing a gap in the supply and demand chain for the metals. Metals were not as essential in past years as they have been in the last five. Many of them were discarded as a result of demand and supply inconsistencies. Rare-earth metals are widely employed in a variety of critical applications, including green technology and the military.

Recycling is a method of reducing the criticality of metals while also offering a secondary source of supply for critical metals. Rare-earth metals currently have a recycling rate of less than 5%, indicating that major recycling operations are possible. Recycling not only provides a backup supply but also helps the environment by lowering the need for mining. It will also cut down on the amount of garbage and toxins that end up in drinking water.

Rare Earth Element Market Segmentation Analysis:

By Metal, Cerium was the most popular element in 2025, accounting for xx% of total volume. The rising popularity of hybrid vehicles is expected to boost rare earth demand during the forecast period. From 2026 to 2032, praseodymium volume is expected to grow at a CAGR of 6.4 percent. It is used as an alloying agent with magnesium in aviation engines to make high-strength metals. As the number of passengers from all over the world increases, so does the need for flights. GE Aviation, a part of General Electric, promised USD 12.3 billion in February 2017 to increase its aircraft engine production capacity. This is expected to raise praseodymium demand during the forecast period.

By Application, the magnet segment dominated the market in 2025 and is expected to hold largest share during forecast period. Computer hard drives, linear actuators, servo motors, speakers, and sensors are all examples of where they're used. Rising demand for magnets in automobiles, turbines, and consumer electronics is expected to boost rare earth element utilization throughout the forecast period. Revenue for the application of ceramic is expected to expand at a CAGR of 7.0 percent from 2026 to 2032. Yttrium, lanthanum, cerium, neodymium, and praseodymium are frequently used in the ceramics industry in applications such as tiles, electronics, and engineering. According to numbers supplied by the Ceramic World Web, the output of ceramic tiles increased by 2.2 percent from 2016 to 2017.

Rare Earth Element Market by End Use

Rare Earth Element Market Regional Insight

North America is expected to grow at an 8.2 percent CAGR in terms of revenue from 2025 to 2032. For example, Tesla, a major American electric vehicle manufacturer, announced in 2018 that its Model 3 Long Range vehicles will employ neodymium. This action is expected to increase neodymium demand during the forecast period. Consumer electronics and nuclear energy are likely to drive rare earth demand throughout the forecast period. Rare earth demand in Europe is expected to rise as a result of increased usage in magnets, metallurgy, catalysts, glass, and ceramics. According to the Organization for International Cooperation on Autos (OICA), Europe overtook the United States as the world's second-largest manufacturer of automobiles in 2018, accounting for 22.3 percent of worldwide output. As a result, the region's need for rare earth elements is likely to grow.

The Asia Pacific was the leading producer and consumer of rare earth in 2023, with a market volume share of xx percent. The consumer electronics and vehicle sectors are key in the Asia Pacific rare earth elements market. This is owing to the rising usage of rare earth in magnets for electric car batteries, as well as the polishing of television glass to smoothen the surface and reduce the weight of the product. Skyworth, TCL, Xiaomi, BPL, and Thomson have all begun to expand their capacity to manufacture television components in India.

Rare Earth Element Market Report Objectives:

Landscape analysis of the Rare Earth Element Market

competitive benchmarking

Past and current status of the industry with the forecasted market size and trends

Evaluation of potential key players that include market leaders, followers, and new entrants

Technology trends

Potential impact of micro-economic factors of the market

External and Internal factors affecting market have been analysed

The report also helps in understanding the Rare Earth Element Market dynamics, structure by analysing the market segments and project the Rare Earth Element Market size. Clear representation of competitive analysis of key players by product, price, financial position, product portfolio, growth strategies, and regional presence in the Rare Earth Element Market make the report investor’s guide.

Recent Industry Developments

Exact Date Company Development Impact
15 June 2026 MP Materials Corp Scheduled to commission its heavy rare earth separation facility in Mountain Pass, California, marking a major technical milestone. The successful ramp-up is expected to reduce U.S. dependence on foreign processing for critical heavy elements like dysprosium and terbium.
12 February 2026 U.S. Department of Energy Formally initiated Project Vault, a US$ 12 billion strategic plan to create a national stockpile of rare earth elements and other vital minerals. This initiative provides a demand safety net for domestic producers and secures the supply chain for defense and high-tech industries.
10 December 2025 MRG Metals Limited Reported high-grade laboratory results from auger drill holes at the Adriano Rare Earth Project in Mozambique. These results confirm the viability of new mining frontiers in Africa, potentially diversifying the global source of rare earth oxides.
22 July 2025 Apple Inc. / MP Materials Signed a US$ 500 million supply contract for rare earth magnets to be used in consumer electronic devices. This agreement highlights the growing trend of direct sourcing by tech giants to ensure long-term availability of magnet materials.
14 March 2025 Chemours Company / Energy Fuels Inc. Entered a strategic partnership to leverage the White Mesa Mill for enhanced domestic processing of rare earth carbonates. The collaboration optimizes underutilized industrial capacity in the U.S. to accelerate the production of separated rare earth oxides.
15 January 2025 Ministry of Mines, India Commissioned the first phase of the National Rare Earth Processing Mission, focusing on monazite processing facilities. This move positions India as a growing secondary hub for rare earth refining, challenging the existing regional concentration in East Asia.

Rare Earth Element Market Scope: Inquire before buying

Rare Earth Elements Market
Report Coverage Details
Base Year: 2025 Forecast Period: 2026-2032
Historical Data: 2020 to 2025 Market Size in 2025: 9.46 USD Billion
Forecast Period 2026-2032 CAGR: 12.3% Market Size in 2032: 21.3 USD Billion
Segments Covered: by Element Light Rare Earth Elements (LREEs)
Heavy Rare Earth Elements (HREEs)
by Metal Lanthanum
Cerium
Neodymium
Praseodymium
Samarium
Europium
Dysprosium
Terbium
Yttrium
Others
by Application Magnets
Catalysts
Metallurgy & Alloys
Polishing Powders
Glass & Ceramics
Phosphors
Others
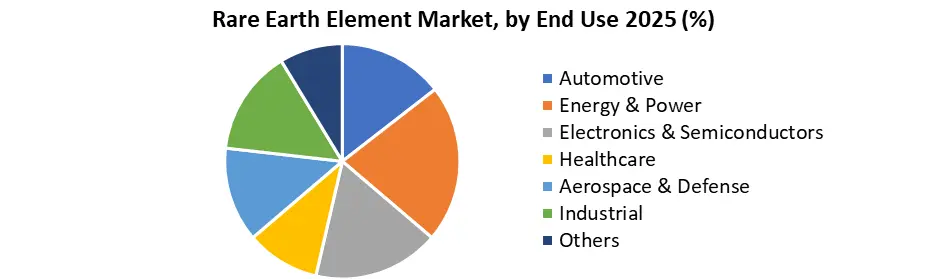
by End-Use Automotive
Energy & Power
Electronics & Semiconductors
Healthcare
Aerospace & Defense
Industrial
Others

Rare Earth Element Market, by Region

North America (United States, Canada and Mexico)
Europe (UK, France, Germany, Italy, Spain, Sweden, Austria, Turkey, Russia and Rest of Europe)
Asia Pacific (China, India, Japan, South Korea, Australia, ASEAN and Rest of APAC)
Middle East and Africa (South Africa, GCC, Egypt, Nigeria and Rest of ME&A)
South America (Brazil, Argentina, Columbia and Rest of South America)

Key Players / Competitors Profiles Covered in Brief in Global Rare Earth Elements Market Report in Strategic Perspective:

  1. Ucore Rare Metals Inc.
  2. Arafura Rare Earths Limited
  3. Alkane Resources ltd
  4. Lynas Rare Earths Limited
  5. Avalon Advanced Materials Inc.
  6. Canada Rare Earth Corporation
  7. Iluka Resources Limited
  8. Baotou Jinmeng Rare Earth Co.
  9. China Northern Rare Earth (Group) High-Tech Co., Ltd.
  10. China Minmetals Rare Earth Co. Ltd.
  11. MP Materials Corp
  12. Shenghe Resources Holding Co., Ltd.
  13. Rainbow Rare Earths
  14. Energy Fuels Inc.
  15. Northern Minerals Limited
  16. Solvay SA
  17. Resonac Holdings Corporation
  18. Neo Performance Materials
  19. Shin-Etsu Chemical Co. Ltd.
  20. IREL (India) Limited
  21. Treibacher Industrie AG
  22. Greenland Resources Inc.
  23. Medallion Resources Ltd.
  24. Rare Element Resources Ltd.
  25. Peak Rare Earths

Table of Contents

1. Rare Earth Elements Market Introduction
1.1. Study Assumption and Market Definition
1.2. Scope of the Study
1.3. Executive Summary
2. Global Rare Earth Elements Market: Competitive Landscape
2.1. MMR Competition Matrix
2.2. Competitive Landscape
2.3. Key Players Benchmarking
2.3.1. Company Name
2.3.2. Business Segment
2.3.3. End-user Segment
2.3.4. Revenue (2025)
2.3.5. Company Locations
2.4. Leading Rare Earth Elements Market Companies, by market capitalization
2.5. Market Structure
2.5.1. Market Leaders
2.5.2. Market Followers
2.5.3. Emerging Players
2.6. Mergers and Acquisitions Details
3. Rare Earth Elements Market: Dynamics
3.1. Rare Earth Elements Market Trends by Region
3.1.1. North America Rare Earth Elements Market Trends
3.1.2. Europe Rare Earth Elements Market Trends
3.1.3. Asia Pacific Rare Earth Elements Market Trends
3.1.4. Middle East and Africa Rare Earth Elements Market Trends
3.1.5. South America Rare Earth Elements Market Trends
3.2. Rare Earth Elements Market Dynamics by Region
3.2.1. North America
3.2.1.1. North America Rare Earth Elements Market Drivers
3.2.1.2. North America Rare Earth Elements Market Restraints
3.2.1.3. North America Rare Earth Elements Market Opportunities
3.2.1.4. North America Rare Earth Elements Market Challenges
3.2.2. Europe
3.2.2.1. Europe Rare Earth Elements Market Drivers
3.2.2.2. Europe Rare Earth Elements Market Restraints
3.2.2.3. Europe Rare Earth Elements Market Opportunities
3.2.2.4. Europe Rare Earth Elements Market Challenges
3.2.3. Asia Pacific
3.2.3.1. Asia Pacific Rare Earth Elements Market Drivers
3.2.3.2. Asia Pacific Rare Earth Elements Market Restraints
3.2.3.3. Asia Pacific Rare Earth Elements Market Opportunities
3.2.3.4. Asia Pacific Rare Earth Elements Market Challenges
3.2.4. Middle East and Africa
3.2.4.1. Middle East and Africa Rare Earth Elements Market Drivers
3.2.4.2. Middle East and Africa Rare Earth Elements Market Restraints
3.2.4.3. Middle East and Africa Rare Earth Elements Market Opportunities
3.2.4.4. Middle East and Africa Rare Earth Elements Market Challenges
3.2.5. South America
3.2.5.1. South America Rare Earth Elements Market Drivers
3.2.5.2. South America Rare Earth Elements Market Restraints
3.2.5.3. South America Rare Earth Elements Market Opportunities
3.2.5.4. South America Rare Earth Elements Market Challenges
3.3. PORTER's Five Forces Analysis
3.4. PESTLE Analysis
3.5. Technology Roadmap
3.6. Regulatory Landscape by Region
3.6.1. North America
3.6.2. Europe
3.6.3. Asia Pacific
3.6.4. Middle East and Africa
3.6.5. South America
3.7. Key Opinion Leader Analysis For Rare Earth Elements Industry
3.8. Analysis of Government Schemes and Initiatives For Rare Earth Elements Industry
3.9. Rare Earth Elements Market Trade Analysis
3.10. The Global Pandemic Impact on Rare Earth Elements Market
4. Rare Earth Elements Market: Global Market Size and Forecast by Segmentation (in USD Billion) 2025-2032
4.1. Rare Earth Elements Market Size and Forecast, by Element (2025-2032)
4.1.1. Light Rare Earth Elements (LREEs)
4.1.2. Heavy Rare Earth Elements (HREEs)
4.2. Rare Earth Elements Market Size and Forecast, by Metal (2025-2032)
4.2.1. Lanthanum
4.2.2. Cerium
4.2.3. Neodymium
4.2.4. Praseodymium
4.2.5. Samarium
4.2.6. Europium
4.2.7. Dysprosium
4.2.8. Terbium
4.2.9. Yttrium
4.2.10. Others
4.3. Rare Earth Elements Market Size and Forecast, by Application (2025-2032)
4.3.1. Magnets
4.3.2. Catalysts
4.3.3. Metallurgy & Alloys
4.3.4. Polishing Powders
4.3.5. Glass & Ceramics
4.3.6. Phosphors
4.3.7. Others
4.4. Rare Earth Elements Market Size and Forecast, by End-Use (2025-2032)
4.4.1. Automotive
4.4.2. Energy & Power
4.4.3. Electronics & Semiconductors
4.4.4. Healthcare
4.4.5. Aerospace & Defense
4.4.6. Industrial
4.4.7. Others
4.5. Rare Earth Elements Market Size and Forecast, by Region (2025-2032)
4.5.1. North America
4.5.2. Europe
4.5.3. Asia Pacific
4.5.4. Middle East and Africa
4.5.5. South America
5. North America Rare Earth Elements Market Size and Forecast by Segmentation (in USD Billion) 2025-2032
5.1. North America Rare Earth Elements Market Size and Forecast, by Element (2025-2032)
5.1.1. Light Rare Earth Elements (LREEs)
5.1.2. Heavy Rare Earth Elements (HREEs)
5.2. North America Rare Earth Elements Market Size and Forecast, by Metal (2025-2032)
5.2.1. Lanthanum
5.2.2. Cerium
5.2.3. Neodymium
5.2.4. Praseodymium
5.2.5. Samarium
5.2.6. Europium
5.2.7. Dysprosium
5.2.8. Terbium
5.2.9. Yttrium
5.2.10. Others
5.3. North America Rare Earth Elements Market Size and Forecast, by Application (2025-2032)
5.3.1. Magnets
5.3.2. Catalysts
5.3.3. Metallurgy & Alloys
5.3.4. Polishing Powders
5.3.5. Glass & Ceramics
5.3.6. Phosphors
5.3.7. Others
5.4. North America Rare Earth Elements Market Size and Forecast, by End-Use (2025-2032)
5.4.1. Automotive
5.4.2. Energy & Power
5.4.3. Electronics & Semiconductors
5.4.4. Healthcare
5.4.5. Aerospace & Defense
5.4.6. Industrial
5.4.7. Others
5.5. North America Rare Earth Elements Market Size and Forecast, by Country (2025-2032)
5.5.1. United States
5.5.1.1. United States Rare Earth Elements Market Size and Forecast, by Element (2025-2032)
5.5.1.1.1. Light Rare Earth Elements (LREEs)
5.5.1.1.2. Heavy Rare Earth Elements (HREEs)
5.5.1.2. United States Rare Earth Elements Market Size and Forecast, by Metal (2025-2032)
5.5.1.2.1. Lanthanum
5.5.1.2.2. Cerium
5.5.1.2.3. Neodymium
5.5.1.2.4. Praseodymium
5.5.1.2.5. Samarium
5.5.1.2.6. Europium
5.5.1.2.7. Dysprosium
5.5.1.2.8. Terbium
5.5.1.2.9. Yttrium
5.5.1.2.10. Others
5.5.1.3. United States Rare Earth Elements Market Size and Forecast, by Application (2025-2032)
5.5.1.3.1. Magnets
5.5.1.3.2. Catalysts
5.5.1.3.3. Metallurgy & Alloys
5.5.1.3.4. Polishing Powders
5.5.1.3.5. Glass & Ceramics
5.5.1.3.6. Phosphors
5.5.1.3.7. Others
5.5.1.4. United States Rare Earth Elements Market Size and Forecast, by End-Use (2025-2032)
5.5.1.4.1. Automotive
5.5.1.4.2. Energy & Power
5.5.1.4.3. Electronics & Semiconductors
5.5.1.4.4. Healthcare
5.5.1.4.5. Aerospace & Defense
5.5.1.4.6. Industrial
5.5.1.4.7. Others
5.5.2. Canada
5.5.2.1. Canada Rare Earth Elements Market Size and Forecast, by Element (2025-2032)
5.5.2.1.1. Light Rare Earth Elements (LREEs)
5.5.2.1.2. Heavy Rare Earth Elements (HREEs)
5.5.2.2. Canada Rare Earth Elements Market Size and Forecast, by Metal (2025-2032)
5.5.2.2.1. Lanthanum
5.5.2.2.2. Cerium
5.5.2.2.3. Neodymium
5.5.2.2.4. Praseodymium
5.5.2.2.5. Samarium
5.5.2.2.6. Europium
5.5.2.2.7. Dysprosium
5.5.2.2.8. Terbium
5.5.2.2.9. Yttrium
5.5.2.2.10. Others
5.5.2.3. Canada Rare Earth Elements Market Size and Forecast, by Application (2025-2032)
5.5.2.3.1. Magnets
5.5.2.3.2. Catalysts
5.5.2.3.3. Metallurgy & Alloys
5.5.2.3.4. Polishing Powders
5.5.2.3.5. Glass & Ceramics
5.5.2.3.6. Phosphors
5.5.2.3.7. Others
5.5.2.4. Canada Rare Earth Elements Market Size and Forecast, by End-Use (2025-2032)
5.5.2.4.1. Automotive
5.5.2.4.2. Energy & Power
5.5.2.4.3. Electronics & Semiconductors
5.5.2.4.4. Healthcare
5.5.2.4.5. Aerospace & Defense
5.5.2.4.6. Industrial
5.5.2.4.7. Others
5.5.3. Mexico
5.5.3.1. Mexico Rare Earth Elements Market Size and Forecast, by Element (2025-2032)
5.5.3.1.1. Light Rare Earth Elements (LREEs)
5.5.3.1.2. Heavy Rare Earth Elements (HREEs)
5.5.3.2. Mexico Rare Earth Elements Market Size and Forecast, by Metal (2025-2032)
5.5.3.2.1. Lanthanum
5.5.3.2.2. Cerium
5.5.3.2.3. Neodymium
5.5.3.2.4. Praseodymium
5.5.3.2.5. Samarium
5.5.3.2.6. Europium
5.5.3.2.7. Dysprosium
5.5.3.2.8. Terbium
5.5.3.2.9. Yttrium
5.5.3.2.10. Others
5.5.3.3. Mexico Rare Earth Elements Market Size and Forecast, by Application (2025-2032)
5.5.3.3.1. Magnets
5.5.3.3.2. Catalysts
5.5.3.3.3. Metallurgy & Alloys
5.5.3.3.4. Polishing Powders
5.5.3.3.5. Glass & Ceramics
5.5.3.3.6. Phosphors
5.5.3.3.7. Others
5.5.3.4. Mexico Rare Earth Elements Market Size and Forecast, by End-Use (2025-2032)
5.5.3.4.1. Automotive
5.5.3.4.2. Energy & Power
5.5.3.4.3. Electronics & Semiconductors
5.5.3.4.4. Healthcare
5.5.3.4.5. Aerospace & Defense
5.5.3.4.6. Industrial
5.5.3.4.7. Others
6. Europe Rare Earth Elements Market Size and Forecast by Segmentation (in USD Billion) 2025-2032
6.1. Europe Rare Earth Elements Market Size and Forecast, by Element (2025-2032)
6.2. Europe Rare Earth Elements Market Size and Forecast, by Metal (2025-2032)
6.3. Europe Rare Earth Elements Market Size and Forecast, by Application (2025-2032)
6.4. Europe Rare Earth Elements Market Size and Forecast, by End-Use (2025-2032)
6.5. Europe Rare Earth Elements Market Size and Forecast, by Country (2025-2032)
6.5.1. United Kingdom
6.5.1.1. United Kingdom Rare Earth Elements Market Size and Forecast, by Element (2025-2032)
6.5.1.2. United Kingdom Rare Earth Elements Market Size and Forecast, by Metal (2025-2032)
6.5.1.3. United Kingdom Rare Earth Elements Market Size and Forecast, by Application (2025-2032)
6.5.1.4. United Kingdom Rare Earth Elements Market Size and Forecast, by End-Use (2025-2032)
6.5.2. France
6.5.2.1. France Rare Earth Elements Market Size and Forecast, by Element (2025-2032)
6.5.2.2. France Rare Earth Elements Market Size and Forecast, by Metal (2025-2032)
6.5.2.3. France Rare Earth Elements Market Size and Forecast, by Application (2025-2032)
6.5.2.4. France Rare Earth Elements Market Size and Forecast, by End-Use (2025-2032)
6.5.3. Germany
6.5.3.1. Germany Rare Earth Elements Market Size and Forecast, by Element (2025-2032)
6.5.3.2. Germany Rare Earth Elements Market Size and Forecast, by Metal (2025-2032)
6.5.3.3. Germany Rare Earth Elements Market Size and Forecast, by Application (2025-2032)
6.5.3.4. Germany Rare Earth Elements Market Size and Forecast, by End-Use (2025-2032)
6.5.4. Italy
6.5.4.1. Italy Rare Earth Elements Market Size and Forecast, by Element (2025-2032)
6.5.4.2. Italy Rare Earth Elements Market Size and Forecast, by Metal (2025-2032)
6.5.4.3. Italy Rare Earth Elements Market Size and Forecast, by Application (2025-2032)
6.5.4.4. Italy Rare Earth Elements Market Size and Forecast, by End-Use (2025-2032)
6.5.5. Spain
6.5.5.1. Spain Rare Earth Elements Market Size and Forecast, by Element (2025-2032)
6.5.5.2. Spain Rare Earth Elements Market Size and Forecast, by Metal (2025-2032)
6.5.5.3. Spain Rare Earth Elements Market Size and Forecast, by Application (2025-2032)
6.5.5.4. Spain Rare Earth Elements Market Size and Forecast, by End-Use (2025-2032)
6.5.6. Sweden
6.5.6.1. Sweden Rare Earth Elements Market Size and Forecast, by Element (2025-2032)
6.5.6.2. Sweden Rare Earth Elements Market Size and Forecast, by Metal (2025-2032)
6.5.6.3. Sweden Rare Earth Elements Market Size and Forecast, by Application (2025-2032)
6.5.6.4. Sweden Rare Earth Elements Market Size and Forecast, by End-Use (2025-2032)
6.5.7. Austria
6.5.7.1. Austria Rare Earth Elements Market Size and Forecast, by Element (2025-2032)
6.5.7.2. Austria Rare Earth Elements Market Size and Forecast, by Metal (2025-2032)
6.5.7.3. Austria Rare Earth Elements Market Size and Forecast, by Application (2025-2032)
6.5.7.4. Austria Rare Earth Elements Market Size and Forecast, by End-Use (2025-2032)
6.5.8. Rest of Europe
6.5.8.1. Rest of Europe Rare Earth Elements Market Size and Forecast, by Element (2025-2032)
6.5.8.2. Rest of Europe Rare Earth Elements Market Size and Forecast, by Metal (2025-2032)
6.5.8.3. Rest of Europe Rare Earth Elements Market Size and Forecast, by Application (2025-2032)
6.5.8.4. Rest of Europe Rare Earth Elements Market Size and Forecast, by End-Use (2025-2032)
7. Asia Pacific Rare Earth Elements Market Size and Forecast by Segmentation (in USD Billion) 2025-2032
7.1. Asia Pacific Rare Earth Elements Market Size and Forecast, by Element (2025-2032)
7.2. Asia Pacific Rare Earth Elements Market Size and Forecast, by Metal (2025-2032)
7.3. Asia Pacific Rare Earth Elements Market Size and Forecast, by Application (2025-2032)
7.4. Asia Pacific Rare Earth Elements Market Size and Forecast, by End-Use (2025-2032)
7.5. Asia Pacific Rare Earth Elements Market Size and Forecast, by Country (2025-2032)
7.5.1. China
7.5.1.1. China Rare Earth Elements Market Size and Forecast, by Element (2025-2032)
7.5.1.2. China Rare Earth Elements Market Size and Forecast, by Metal (2025-2032)
7.5.1.3. China Rare Earth Elements Market Size and Forecast, by Application (2025-2032)
7.5.1.4. China Rare Earth Elements Market Size and Forecast, by End-Use (2025-2032)
7.5.2. S Korea
7.5.2.1. S Korea Rare Earth Elements Market Size and Forecast, by Element (2025-2032)
7.5.2.2. S Korea Rare Earth Elements Market Size and Forecast, by Metal (2025-2032)
7.5.2.3. S Korea Rare Earth Elements Market Size and Forecast, by Application (2025-2032)
7.5.2.4. S Korea Rare Earth Elements Market Size and Forecast, by End-Use (2025-2032)
7.5.3. Japan
7.5.3.1. Japan Rare Earth Elements Market Size and Forecast, by Element (2025-2032)
7.5.3.2. Japan Rare Earth Elements Market Size and Forecast, by Metal (2025-2032)
7.5.3.3. Japan Rare Earth Elements Market Size and Forecast, by Application (2025-2032)
7.5.3.4. Japan Rare Earth Elements Market Size and Forecast, by End-Use (2025-2032)
7.5.4. India
7.5.4.1. India Rare Earth Elements Market Size and Forecast, by Element (2025-2032)
7.5.4.2. India Rare Earth Elements Market Size and Forecast, by Metal (2025-2032)
7.5.4.3. India Rare Earth Elements Market Size and Forecast, by Application (2025-2032)
7.5.4.4. India Rare Earth Elements Market Size and Forecast, by End-Use (2025-2032)
7.5.5. Australia
7.5.5.1. Australia Rare Earth Elements Market Size and Forecast, by Element (2025-2032)
7.5.5.2. Australia Rare Earth Elements Market Size and Forecast, by Metal (2025-2032)
7.5.5.3. Australia Rare Earth Elements Market Size and Forecast, by Application (2025-2032)
7.5.5.4. Australia Rare Earth Elements Market Size and Forecast, by End-Use (2025-2032)
7.5.6. Indonesia
7.5.6.1. Indonesia Rare Earth Elements Market Size and Forecast, by Element (2025-2032)
7.5.6.2. Indonesia Rare Earth Elements Market Size and Forecast, by Metal (2025-2032)
7.5.6.3. Indonesia Rare Earth Elements Market Size and Forecast, by Application (2025-2032)
7.5.6.4. Indonesia Rare Earth Elements Market Size and Forecast, by End-Use (2025-2032)
7.5.7. Malaysia
7.5.7.1. Malaysia Rare Earth Elements Market Size and Forecast, by Element (2025-2032)
7.5.7.2. Malaysia Rare Earth Elements Market Size and Forecast, by Metal (2025-2032)
7.5.7.3. Malaysia Rare Earth Elements Market Size and Forecast, by Application (2025-2032)
7.5.7.4. Malaysia Rare Earth Elements Market Size and Forecast, by End-Use (2025-2032)
7.5.8. Vietnam
7.5.8.1. Vietnam Rare Earth Elements Market Size and Forecast, by Element (2025-2032)
7.5.8.2. Vietnam Rare Earth Elements Market Size and Forecast, by Metal (2025-2032)
7.5.8.3. Vietnam Rare Earth Elements Market Size and Forecast, by Application (2025-2032)
7.5.8.4. Vietnam Rare Earth Elements Market Size and Forecast, by End-Use (2025-2032)
7.5.9. Taiwan
7.5.9.1. Taiwan Rare Earth Elements Market Size and Forecast, by Element (2025-2032)
7.5.9.2. Taiwan Rare Earth Elements Market Size and Forecast, by Metal (2025-2032)
7.5.9.3. Taiwan Rare Earth Elements Market Size and Forecast, by Application (2025-2032)
7.5.9.4. Taiwan Rare Earth Elements Market Size and Forecast, by End-Use (2025-2032)
7.5.10. Rest of Asia Pacific
7.5.10.1. Rest of Asia Pacific Rare Earth Elements Market Size and Forecast, by Element (2025-2032)
7.5.10.2. Rest of Asia Pacific Rare Earth Elements Market Size and Forecast, by Metal (2025-2032)
7.5.10.3. Rest of Asia Pacific Rare Earth Elements Market Size and Forecast, by Application (2025-2032)
7.5.10.4. Rest of Asia Pacific Rare Earth Elements Market Size and Forecast, by End-Use (2025-2032)
8. Middle East and Africa Rare Earth Elements Market Size and Forecast by Segmentation (in USD Billion) 2025-2032
8.1. Middle East and Africa Rare Earth Elements Market Size and Forecast, by Element (2025-2032)
8.2. Middle East and Africa Rare Earth Elements Market Size and Forecast, by Metal (2025-2032)
8.3. Middle East and Africa Rare Earth Elements Market Size and Forecast, by Application (2025-2032)
8.4. Middle East and Africa Rare Earth Elements Market Size and Forecast, by End-Use (2025-2032)
8.5. Middle East and Africa Rare Earth Elements Market Size and Forecast, by Country (2025-2032)
8.5.1. South Africa
8.5.1.1. South Africa Rare Earth Elements Market Size and Forecast, by Element (2025-2032)
8.5.1.2. South Africa Rare Earth Elements Market Size and Forecast, by Metal (2025-2032)
8.5.1.3. South Africa Rare Earth Elements Market Size and Forecast, by Application (2025-2032)
8.5.1.4. South Africa Rare Earth Elements Market Size and Forecast, by End-Use (2025-2032)
8.5.2. GCC
8.5.2.1. GCC Rare Earth Elements Market Size and Forecast, by Element (2025-2032)
8.5.2.2. GCC Rare Earth Elements Market Size and Forecast, by Metal (2025-2032)
8.5.2.3. GCC Rare Earth Elements Market Size and Forecast, by Application (2025-2032)
8.5.2.4. GCC Rare Earth Elements Market Size and Forecast, by End-Use (2025-2032)
8.5.3. Nigeria
8.5.3.1. Nigeria Rare Earth Elements Market Size and Forecast, by Element (2025-2032)
8.5.3.2. Nigeria Rare Earth Elements Market Size and Forecast, by Metal (2025-2032)
8.5.3.3. Nigeria Rare Earth Elements Market Size and Forecast, by Application (2025-2032)
8.5.3.4. Nigeria Rare Earth Elements Market Size and Forecast, by End-Use (2025-2032)
8.5.4. Rest of ME&A
8.5.4.1. Rest of ME&A Rare Earth Elements Market Size and Forecast, by Element (2025-2032)
8.5.4.2. Rest of ME&A Rare Earth Elements Market Size and Forecast, by Metal (2025-2032)
8.5.4.3. Rest of ME&A Rare Earth Elements Market Size and Forecast, by Application (2025-2032)
8.5.4.4. Rest of ME&A Rare Earth Elements Market Size and Forecast, by End-Use (2025-2032)
9. South America Rare Earth Elements Market Size and Forecast by Segmentation (in USD Billion) 2025-2032
9.1. South America Rare Earth Elements Market Size and Forecast, by Element (2025-2032)
9.2. South America Rare Earth Elements Market Size and Forecast, by Metal (2025-2032)
9.3. South America Rare Earth Elements Market Size and Forecast, by Application (2025-2032)
9.4. South America Rare Earth Elements Market Size and Forecast, by End-Use (2025-2032)
9.5. South America Rare Earth Elements Market Size and Forecast, by Country (2025-2032)
9.5.1. Brazil
9.5.1.1. Brazil Rare Earth Elements Market Size and Forecast, by Element (2025-2032)
9.5.1.2. Brazil Rare Earth Elements Market Size and Forecast, by Metal (2025-2032)
9.5.1.3. Brazil Rare Earth Elements Market Size and Forecast, by Application (2025-2032)
9.5.1.4. Brazil Rare Earth Elements Market Size and Forecast, by End-Use (2025-2032)
9.5.2. Argentina
9.5.2.1. Argentina Rare Earth Elements Market Size and Forecast, by Element (2025-2032)
9.5.2.2. Argentina Rare Earth Elements Market Size and Forecast, by Metal (2025-2032)
9.5.2.3. Argentina Rare Earth Elements Market Size and Forecast, by Application (2025-2032)
9.5.2.4. Argentina Rare Earth Elements Market Size and Forecast, by End-Use (2025-2032)
9.5.3. Rest Of South America
9.5.3.1. Rest Of South America Rare Earth Elements Market Size and Forecast, by Element (2025-2032)
9.5.3.2. Rest Of South America Rare Earth Elements Market Size and Forecast, by Metal (2025-2032)
9.5.3.3. Rest Of South America Rare Earth Elements Market Size and Forecast, by Application (2025-2032)
9.5.3.4. Rest Of South America Rare Earth Elements Market Size and Forecast, by End-Use (2025-2032)
10. Company Profile: Key Players
10.1. Ucore Rare Metals Inc.
10.1.1. Company Overview
10.1.2. Business Portfolio
10.1.3. Financial Overview
10.1.4. SWOT Analysis
10.1.5. Strategic Analysis
10.1.6. Scale of Operation (small, medium, and large)
10.1.7. Details on Partnership
10.1.8. Regulatory Accreditations and Certifications Received by Them
10.1.9. Awards Received by the Firm
10.1.10. Recent Developments
10.2. Arafura Rare Earths Limited
10.3. Alkane Resources ltd
10.4. Lynas Rare Earths Limited
10.5. Avalon Advanced Materials Inc.
10.6. Canada Rare Earth Corporation
10.7. Iluka Resources Limited
10.8. Baotou Jinmeng Rare Earth Co.
10.9. China Northern Rare Earth (Group) High-Tech Co. Ltd.
10.10. China Minmetals Rare Earth Co. Ltd.
10.11. MP Materials Corp
10.12. Shenghe Resources Holding Co. Ltd.
10.13. Rainbow Rare Earths
10.14. Energy Fuels Inc.
10.15. Northern Minerals Limited
10.16. Solvay SA
10.17. Resonac Holdings Corporation
10.18. Neo Performance Materials
10.19. Shin-Etsu Chemical Co. Ltd.
10.20. IREL (India) Limited
10.21. Treibacher Industrie AG
10.22. Greenland Resources Inc.
10.23. Medallion Resources Ltd.
10.24. Rare Element Resources Ltd.
10.25. Peak Rare Earths
11. Key Findings
12. Industry Recommendations
13. Rare Earth Elements Market: Research Methodology
14. Terms and Glossary

Custom Market Research Services

We Will Customise The Research For You, In Case The Report Listed Above Does Not Meet With Your Requirements