Indium Tin Oxide (ITO) Market: Global Industry Analysis and Forecast (2024-2030)

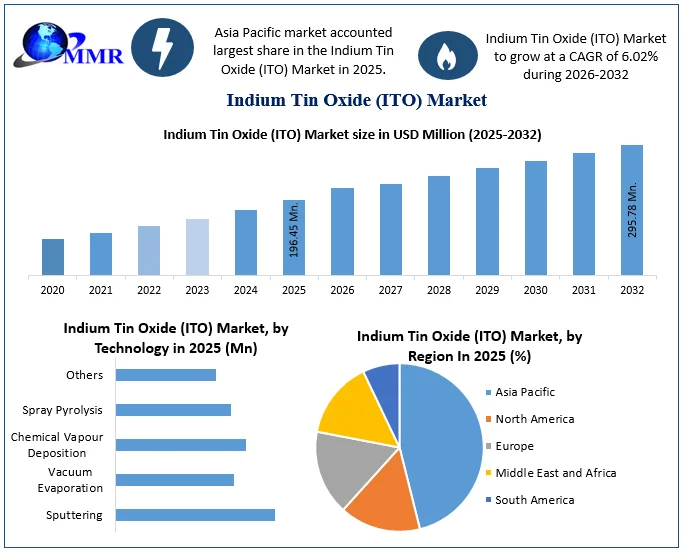
Indium Tin Oxide (ITO) Market is expected to reach US$ 174.78 Mn. at a CAGR of 6.02 during the forecast period 2030.

Indium Tin Oxide (ITO) Market Introduction and Market scenario:

Indium Tin Oxide (ITO) is a semiconductor that is a group of indium, tin, and oxygen. It is made up through the electron beam evaporation or sputter deposition techniques and is used in the form of a thin protective coating over mechanical equipment. Because of its physical properties, such as colorfastness, electromagnetic induction shielding, UV resistance, and high transparency, ITO finds application in the manufacturing of sensors, touch panels, flat panels, electroluminescent & liquid-crystal displays (ELD/LCD), photovoltaic cells, and heat reflective coatings. In the electronics industry, the increasing use of smart devices across the globe is the significant factor driving the growth of the market. Thanks to it are broadly used in the production of screens and touch panels in televisions, tablets, smartphones, cameras, and computer monitors. The increasing inclination for smart automobiles equipped with innovative driver assistance systems (ADAS) is also boosting the growth of the market . On the other hand, the growing R&D in emerging substitutes for indium tin oxide (ITO) is the key restraints for the market.Indium Tin Oxide (ITO) MarketTo know about the Research Methodology :- Request Free Sample Report

Segment Analysis:

The global Indium Tin Oxide (ITO) market is segmented into technology and application. Based on technology, the market is further classified into Sputtering, Vacuum Evaporation, Chemical Vapour Deposition, Spray Pyrolysis, and Others. Among these, the sputtering segment occupied almost 72% of the global market share in 2023. This growth is mainly attributed to sputtering is the most adaptable technique used for the deposition of ITO thin film on a substrate. In recent times, magnetron sputtering has gained enormous popularity as the film produced by the sputtering method has advanced film quality, homogeneity, greater adhesive strength, and better-controlled composition.

Regional Insights:

The Indium Tin Oxide (ITO) market is segmented into North America, Asia Pacific, Europe, South America, and Middle East & Africa. Among these, Asia-Pacific held the largest revenue share of 58% in the ITO market in 2023. This growth majorly comes from China, which is the primary producer of indium and accounts for over 62% of the overall global indium supplies. The growing demand for consumer electronics with touch panels and attractive displays is expected to boost the consumption of indium in the Asia-Pacific during the forecast period (2024-2030). The report focuses on the Indium Tin Oxide (ITO) market value at the top regions and countries of the world, which shows a regional development, including market size, share, revenue, and much more across the globe. The report has covered, capacity, production value, cost/profit, and supply/demand by statistical analysis. A brief analysis of drivers, restraints, opportunities, and challenges in the market is also covered with examples by region. To make the most of the opportunities, market vendors should focus more on the growth prospects in the fast-growing segments, while maintaining their positions in the slow-growing segments. It also has covered the analysis of key player’s growth strategies, micro and macro analysis of markets, key developments, and key trends in the market.

Indium Tin Oxide (ITO) Market Scope: Inquire before buying

Indium Tin Oxide (ITO) Market
Report Coverage Details
Base Year: 2023 Forecast Period: 2024-2030
Historical Data: 2018 to 2023 Market Size in 2023: US $ 116.09 Mn.
Forecast Period 2024 to 2030 CAGR: 6.02% Market Size in 2030: US $ 174.78 Mn.
Segments Covered: by Technology Sputtering Vacuum Evaporation Chemical Vapour Deposition Spray Pyrolysis Others
by Application Electrochromic Displays and LCDs Touch Panels Photovoltaics Transparent Electrodes Others

by Region

North America (United States, Canada and Mexico) Europe (UK, France, Germany, Italy, Spain, Sweden, Austria and Rest of Europe) Asia Pacific (China, South Korea, Japan, India, Australia, Indonesia, Malaysia, Vietnam, Taiwan, Bangladesh, Pakistan and Rest of APAC) Middle East and Africa (South Africa, GCC, Egypt, Nigeria and Rest of ME&A) South America (Brazil, Argentina Rest of South America)

Indium Tin Oxide (ITO) Market, Key Players are:

1. 3M Company 2. American Elements 3. Densitron Technologies 4. EFUN Technology 5. Umicore 6. Indium Corporation 7. Keeling & Walker Ltd 8. Kurt J. Lesker Company 9. Mitsui Mining & Smelting Co., Ltd. 10.Nitto Denko Corporation 11.Samsung Corning Precision Material 12.Sollensys 13.Tosoh Corporation 14.Touch International Inc. 15.Others Frequently Asked Questions: 1. Which region has the largest share in Global Indium Tin Oxide (ITO) Market? Ans: Asia Pacific region held the highest share in 2023. 2. What is the growth rate of Global Indium Tin Oxide (ITO) Market? Ans: The global market is growing at a CAGR of 6.02% during forecasting period 2024-2030. 3. What is scope of the Global Indium Tin Oxide (ITO) Market report? Ans: Global market report helps with the PESTEL, PORTER, COVID-19 Impact analysis, Recommendations for Investors & Leaders, and market estimation of the forecast period. 4. Who are the key players in Global Indium Tin Oxide (ITO) Market? Ans: The important key players in the global market are – 3M Company, American Elements, Densitron Technologies, EFUN Technology, Umicore, Indium Corporation, Keeling & Walker Ltd, Kurt J. Lesker Company, Mitsui Mining & Smelting Co., Ltd., Nitto Denko Corporation, Samsung Corning Precision Material, Sollensys, Tosoh Corporation, Touch International Inc., and Others 5. What is the study period of this Market? Ans: The Global Indium Tin Oxide (ITO) Market is studied from 2023 to 2030.
1. Indium Tin Oxide (ITO): Research Methodology 2. Indium Tin Oxide (ITO) Introduction 2.1. Study Assumption and Market Definition 2.2. Scope of the Study 2.3. Executive Summary 3. Indium Tin Oxide (ITO): Dynamics 3.1. Key Market Trends 3.2. Indium Tin Oxide (ITO) Dynamics by Region 3.2.1. Indium Tin Oxide (ITO) Market Drivers 3.2.2. Indium Tin Oxide (ITO) Market Restraints 3.2.3. Indium Tin Oxide (ITO) Market Opportunities 3.2.4. Indium Tin Oxide (ITO) Market Challenges 3.3. PORTER’s Five Forces Analysis 3.4. PESTLE Analysis 3.5. Regulatory Landscape by Region 3.5.1. Global 3.5.2. North America 3.5.3. Europe 3.5.4. Asia Pacific 3.5.5. Middle East and Africa 3.5.6. South America 3.6. Analysis of Government Schemes and Initiatives for Indium Tin Oxide (ITO) 3.7. New Frontiers Shaped by Covid-19 4. Indium Tin Oxide (ITO): Global Market Size and Forecast by Segmentation by Demand and Supply Side (by Value in USD Million) (2023-2030) 4.1. Indium Tin Oxide (ITO) Size and Forecast, by Technology (2023-2030) 4.1.1. Sputtering 4.1.2. Vacuum Evaporation 4.1.3. Chemical Vapour Deposition 4.1.4. Spray Pyrolysis 4.1.5. Others 4.2. Indium Tin Oxide (ITO) Size and Forecast, by Application (2023-2030) 4.2.1. Electrochromic Displays and LCDs 4.2.2. Touch Panels 4.2.3. Photovoltaics 4.2.4. Transparent Electrodes 4.2.5. Others 4.3. Indium Tin Oxide (ITO) Size and Forecast, by Region (2023-2030) 4.3.1. North America 4.3.2. Europe 4.3.3. Asia Pacific 4.3.4. Middle East and Africa 4.3.5. South America 5. North America Indium Tin Oxide (ITO) Size and Forecast by Segmentation by Demand and Supply Side (by Value in USD Million) (2023-2030) 5.1. North America Indium Tin Oxide (ITO) Size and Forecast, by Technology (2023-2030) 5.1.1. Sputtering 5.1.2. Vacuum Evaporation 5.1.3. Chemical Vapour Deposition 5.1.4. Spray Pyrolysis 5.1.5. Others 5.2. North America Indium Tin Oxide (ITO) Size and Forecast, by Application (2023-2030) 5.2.1. Electrochromic Displays and LCDs 5.2.2. Touch Panels 5.2.3. Photovoltaics 5.2.4. Transparent Electrodes 5.2.5. Others 5.3. Indium Tin Oxide (ITO) Size and Forecast, by Country (2023-2030) 5.3.1. United States 5.3.1.1. United States Indium Tin Oxide (ITO) Size and Forecast, by Technology (2023-2030) 5.3.1.1.1. Sputtering 5.3.1.1.2. Vacuum Evaporation 5.3.1.1.3. Chemical Vapour Deposition 5.3.1.1.4. Spray Pyrolysis 5.3.1.1.5. Others 5.3.1.2. United States Indium Tin Oxide (ITO) Size and Forecast, by Application (2023-2030) 5.3.1.2.1. Electrochromic Displays and LCDs 5.3.1.2.2. Touch Panels 5.3.1.2.3. Photovoltaics 5.3.1.2.4. Transparent Electrodes 5.3.1.2.5. Others Canada 5.3.1.3. Canada Indium Tin Oxide (ITO) Size and Forecast, by Technology (2023-2030) 5.3.1.3.1. Sputtering 5.3.1.3.2. Vacuum Evaporation 5.3.1.3.3. Chemical Vapour Deposition 5.3.1.3.4. Spray Pyrolysis 5.3.1.3.5. Others 5.3.1.4. Canada Indium Tin Oxide (ITO) Size and Forecast, by Application (2023-2030) 5.3.1.4.1. Comm Electrochromic Displays and LCDs 5.3.1.4.2. Touch Panels 5.3.1.4.3. Photovoltaics 5.3.1.4.4. Transparent Electrodes 5.3.1.4.5. Others 5.3.2. Mexico 5.3.2.1. Mexico Indium Tin Oxide (ITO) Size and Forecast, by Technology (2023-2030) 5.3.2.1.1. Sputtering 5.3.2.1.2. Vacuum Evaporation 5.3.2.1.3. Chemical Vapour Deposition 5.3.2.1.4. Spray Pyrolysis 5.3.2.1.5. Others 5.3.2.2. Mexico Indium Tin Oxide (ITO) Size and Forecast, by Application (2023-2030) 5.3.2.2.1. Electrochromic Displays and LCDs 5.3.2.2.2. Touch Panels 5.3.2.2.3. Photovoltaics 5.3.2.2.4. Transparent Electrodes 5.3.2.2.5. Others 6. Europe Indium Tin Oxide (ITO) Size and Forecast by Segmentation by Demand and Supply Side (by Value in USD Million) (2023-2030) 6.1. Europe Indium Tin Oxide (ITO) Size and Forecast, by Technology (2023-2030) 6.2. Europe Indium Tin Oxide (ITO) Size and Forecast, by Application (2023-2030) 6.3. Europe Indium Tin Oxide (ITO) Size and Forecast, by Country (2023-2030) 6.3.1. United Kingdom 6.3.1.1. United Kingdom Indium Tin Oxide (ITO) Size and Forecast, by Technology (2023-2030) 6.3.1.2. United Kingdom Indium Tin Oxide (ITO) Size and Forecast, by Application (2023-2030) 6.3.2. France 6.3.2.1. France Indium Tin Oxide (ITO) Size and Forecast, by Technology (2023-2030) 6.3.2.2. France Indium Tin Oxide (ITO) Size and Forecast, by Application (2023-2030) 6.3.3. Germany 6.3.3.1. Germany Indium Tin Oxide (ITO) Size and Forecast, by Technology (2023-2030) 6.3.3.2. Germany Indium Tin Oxide (ITO) Size and Forecast, by Application (2023-2030) 6.3.4. Italy 6.3.4.1. Italy Indium Tin Oxide (ITO) Size and Forecast, by Technology (2023-2030) 6.3.4.2. Italy Indium Tin Oxide (ITO) Size and Forecast, by Application (2023-2030) 6.3.5. Spain 6.3.5.1. Spain Indium Tin Oxide (ITO) Size and Forecast, by Technology (2023-2030) 6.3.5.2. Spain Indium Tin Oxide (ITO) Size and Forecast, by Application (2023-2030) 6.3.6. Sweden 6.3.6.1. Sweden Indium Tin Oxide (ITO) Size and Forecast, by Technology (2023-2030) 6.3.6.2. Sweden Indium Tin Oxide (ITO) Size and Forecast, by Application (2023-2030) 6.3.7. Austria 6.3.7.1. Austria Indium Tin Oxide (ITO) Size and Forecast, by Technology (2023-2030) 6.3.7.2. Austria Indium Tin Oxide (ITO) Size and Forecast, by Application (2023-2030) 6.3.8. Rest of Europe 6.3.8.1. Rest of Europe Indium Tin Oxide (ITO) Size and Forecast, by Technology (2023-2030) 6.3.8.2. Rest of Europe Indium Tin Oxide (ITO) Size and Forecast, by Application (2023-2030) 7. Asia Pacific Indium Tin Oxide (ITO) Size and Forecast by Segmentation by Demand and Supply Side (by Value in USD Million) (2023-2030) 7.1. Asia Pacific Indium Tin Oxide (ITO) Size and Forecast, by Technology (2023-2030) 7.2. Asia Pacific Indium Tin Oxide (ITO) Size and Forecast, by Application (2023-2030) 7.3. Asia Pacific Indium Tin Oxide (ITO) Size and Forecast, by Country (2023-2030) 7.3.1. China 7.3.1.1. China Indium Tin Oxide (ITO) Size and Forecast, by Technology (2023-2030) 7.3.1.2. China Indium Tin Oxide (ITO) Size and Forecast, by Application (2023-2030) 7.3.1.3. China Indium Tin Oxide (ITO) Size and Forecast, by Technology (2023-2030) 7.3.1.4. China Indium Tin Oxide (ITO) Size and Forecast, by Application (2023-2030) 7.3.2. Japan 7.3.2.1. Japan Indium Tin Oxide (ITO) Size and Forecast, by Technology (2023-2030) 7.3.2.2. Japan Indium Tin Oxide (ITO) Size and Forecast, by Application (2023-2030) 7.3.3. India 7.3.3.1. India Indium Tin Oxide (ITO) Size and Forecast, by Technology (2023-2030) 7.3.3.2. India Indium Tin Oxide (ITO) Size and Forecast, by Application (2023-2030) 7.3.4. Australia 7.3.4.1. Australia Indium Tin Oxide (ITO) Size and Forecast, by Technology (2023-2030) 7.3.4.2. Australia Indium Tin Oxide (ITO) Size and Forecast, by Application (2023-2030) 7.3.5. Indonesia 7.3.5.1. Indonesia Indium Tin Oxide (ITO) Size and Forecast, by Technology (2023-2030) 7.3.5.2. Indonesia Indium Tin Oxide (ITO) Size and Forecast, by Application (2023-2030) 7.3.6. Malaysia 7.3.6.1. Malaysia Indium Tin Oxide (ITO) Size and Forecast, by Technology (2023-2030) 7.3.6.2. Malaysia Indium Tin Oxide (ITO) Size and Forecast, by Application (2023-2030) 7.3.7. Vietnam 7.3.7.1. Vietnam Indium Tin Oxide (ITO) Size and Forecast, by Technology (2023-2030) 7.3.7.2. Vietnam Indium Tin Oxide (ITO) Size and Forecast, by Application (2023-2030) 7.3.8. Taiwan 7.3.8.1. Taiwan Indium Tin Oxide (ITO) Size and Forecast, by Technology (2023-2030) 7.3.8.2. Taiwan Indium Tin Oxide (ITO) Size and Forecast, by Application (2023-2030) 7.3.9. Rest of Asia Pacific 7.3.9.1. Rest of Asia Pacific Indium Tin Oxide (ITO) Size and Forecast, by Technology (2023-2030) 7.3.9.2. Rest of Asia Pacific Indium Tin Oxide (ITO) Size and Forecast, by Application (2023-2030) 8. Middle East and Africa Indium Tin Oxide (ITO) Size and Forecast by Segmentation by Demand and Supply Side (by Value in USD Million) (2023-2030 8.1. Middle East and Africa Indium Tin Oxide (ITO) Size and Forecast, by Technology (2023-2030) 8.2. Middle East and Africa Indium Tin Oxide (ITO) Size and Forecast, by Application (2023-2030) 8.3. Middle East and Africa Indium Tin Oxide (ITO) Size and Forecast, by Country (2023-2030) 8.3.1. South Africa 8.3.1.1. South Africa Indium Tin Oxide (ITO) Size and Forecast, by Technology (2023-2030) 8.3.1.2. South Africa Indium Tin Oxide (ITO) Size and Forecast, by Application (2023-2030) 8.3.2. GCC 8.3.2.1. GCC Indium Tin Oxide (ITO) Size and Forecast, by Technology (2023-2030) 8.3.2.2. GCC Indium Tin Oxide (ITO) Size and Forecast, by Application (2023-2030) 8.3.3. Nigeria 8.3.3.1. Nigeria Indium Tin Oxide (ITO) Size and Forecast, by Technology (2023-2030) 8.3.3.2. Nigeria Indium Tin Oxide (ITO) Size and Forecast, by Application (2023-2030) 8.3.4. Rest of ME&A 8.3.4.1. Rest of ME&A Indium Tin Oxide (ITO) Size and Forecast, by Technology (2023-2030) 8.3.4.2. Rest of ME&A Indium Tin Oxide (ITO) Size and Forecast, by Application (2023-2030) 9. South America Indium Tin Oxide (ITO) Size and Forecast by Segmentation by Demand and Supply Side (by Value in USD Million) (2023-2030 9.1. South America Indium Tin Oxide (ITO) Size and Forecast, by Technology (2023-2030) 9.2. South America Indium Tin Oxide (ITO) Size and Forecast, by Application (2023-2030) 9.3. South America Indium Tin Oxide (ITO) Size and Forecast, by Country (2023-2030) 9.3.1. Brazil 9.3.1.1. Brazil Indium Tin Oxide (ITO) Size and Forecast, by Technology (2023-2030) 9.3.1.2. Brazil Indium Tin Oxide (ITO) Size and Forecast, by Application (2023-2030) 9.3.2. Argentina 9.3.2.1. Argentina Indium Tin Oxide (ITO) Size and Forecast, by Technology (2023-2030) 9.3.2.2. Argentina Indium Tin Oxide (ITO) Size and Forecast, by Application (2023-2030) 9.3.3. Rest Of South America 9.3.3.1. Rest Of South America Indium Tin Oxide (ITO) Size and Forecast, by Technology (2023-2030) 9.3.3.2. Rest Of South America Indium Tin Oxide (ITO) Size and Forecast, by Application (2023-2030) 10. Global Indium Tin Oxide (ITO): Competitive Landscape 10.1. MMR Competition Matrix 10.2. Competitive Landscape 10.3. Key Players Benchmarking 10.3.1. Company Name 10.3.2. End-User 10.3.3. Revenue (2022) 10.3.4. Company Locations 10.4. Market Concentration Analysis 10.4.1. Major Players and Market Presence 10.5. Leading Indium Tin Oxide (ITO) Companies, by market capitalization 10.6. Market Structure 10.6.1. Market Leaders 10.6.2. Market Followers 10.6.3. Emerging Players 10.7. Mergers and Acquisitions Details 11. Company Profile: Key Players 11.1. 3M Company 11.1.1. Company Overview 11.1.2. Business Portfolio 11.1.3. Key Players and Market Share 11.1.4. Competitive Strategies SWOT Analysis 11.1.5. Market Strategies of Industry Leaders 11.1.5.1. Product and Service Offerings 11.1.5.2. Market Expansion Strategies 11.1.5.3. Mergers and Acquisitions 11.1.5.4. Collaborations and Partnerships 11.1.6. Sustainability Initiatives Recent Developments 11.2. American Elements 11.3. Densitron Technologies 11.4. EFUN Technology Limited (Shenzhen EFUM Co. Ltd.) 11.5. Indium Corporation 11.6. Umicore NV 11.7. Keeling & Walker Ltd. 11.8. Kurt J. Lesker Company 11.9. Mitsui Mining & Smelting Co., Ltd. 11.10. Nitto Denko Corporation 11.11. Samsung Corning Precision (SCP) Material Co. Ltd. (Corning Incorporated) 11.12. Sollensys 11.13. Tosoh Corporation 11.14. Touch International Inc. 12. Key Findings 13. Industry Recommendations 14. Terms and Glossary
  • INQUIRE BEFORE BUYING