
U.S. Biochar Market Size – Industry Structure Evaluation, Demand Drivers Analysis, Regional Growth Analysis and Identification, Competitive Positioning Review & Global Market Size Forecast to 2027
Overview
Thanks to the development in the Production process and Application segments, the U.S. Biochar market is expected to grow by $269.97 Million by 2027. The report analyzes market dynamics by region and end-user industries.
U.S. Biochar Market Overview:
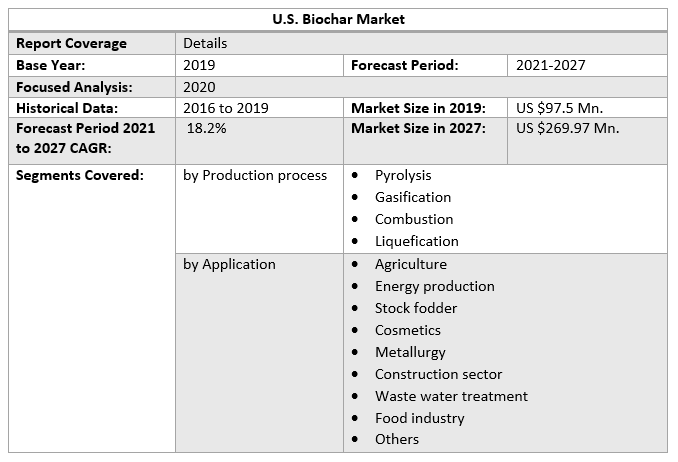
The U.S. Biochar market was valued at US $97.5 Mn. in 2019, and it is expected to grow at US $269.97 Mn. by 2027 with a CAGR of 18.2% during the forecast period.
Biochar is a commercially available substance made by pyrolyzing plant-based biomass.
Biochar's markets and applications, as well as its production technologies and capabilities, and sales, are constantly developing.
Woody debris, dung litters, and other organic wastes are used as biochar feedstocks. The US Forest Service is interested in biochar as a large-scale user of unsold materials from fire recovery, habitat restoration, and wildfire prevention activities since woody biomass are traditionally the largest volume feedstock source.
COVID–19 Influence on U.S. Biochar Market:
COVID-19 had a significant impact on the U.S. economy as well as public health. It caused chaos in the economy, and not a single country was protected. Businesses all over the U.S. have been driven to adjust their ways as a result of the virus. The report gives more details about the influence of each region, allowing users to plan their actions and take substantial steps toward recovery after an epidemic.
U.S. Biochar Market Dynamics:
The growing demand for soil remediation and organic food is currently driving and expected to drive the growth of the biochar market over the forecast period. The climate of the United States is diverse, varying from cold in the north to tropical and subtropical zones in the central and south. As a result, the region's agricultural production has become more diverse. Biochar is mostly used in agriculture as a soil enhancement product.
Higher fertilizer use in the agricultural sector has resulted in increased soil acidity levels in the United States, leading to a growing focus on improved yields. Thus, Carbon-based compounds like compost and biochar are becoming more popular for neutralizing these soils by enhancing the nutrition absorption capacity of plants, the water-holding capacity of the soil, nitrogen retention, and the beneficial populations in the soil respectively.
The rising demand for biochar from wastewater treatment plants is a key factor expected to drive the growth of the biochar market over the forecast period. The material has a high surface area and, thanks to its reactivity, can be applied in water filters to remove pathogens and organic compounds such as lipids and phenols.
Biochar is creating new market opportunities to increase value from hazardous fuels and residues. For example, organizations like Cal Fire in California are spending a lot of money on mobile carbonization systems.
The main challenge for the biochar market has been that large-scale biochar users require consistent quality, reliable delivery, and a reasonable price, but many small-scale producers produce biochar of variable quality, and delivery is also a challenge since biochar is light and cannot be held for long periods. As a result, the growth of the biochar market in the United States is being hindered.
Market Segment Analysis:
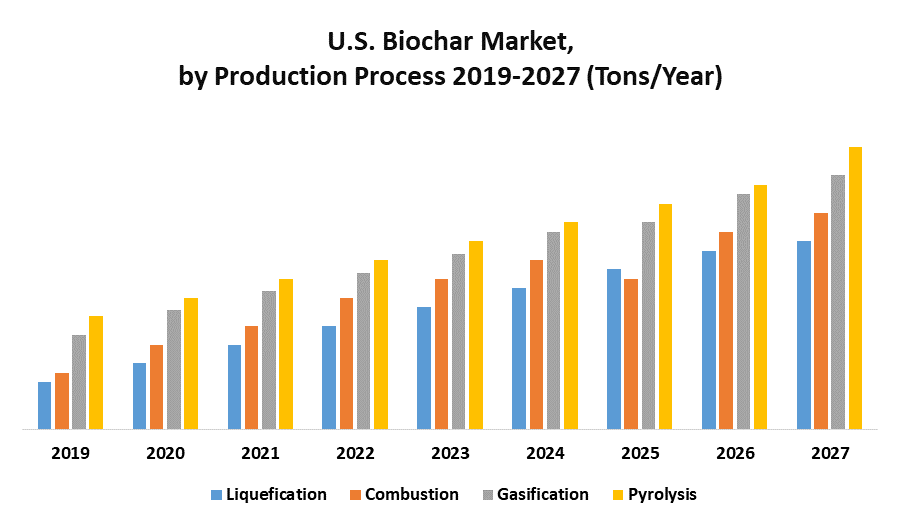
On the basis of Production Process, the U.S. Biochar market is segmented into four types as follows, Pyrolysis, Gasification, Combustion, and Liquefication.
In 2019, pyrolysis was the largest sector, accounting for 73.5% of the overall market share in terms of volume. Pyrolysis dominates biochar production due to its high-quality product and enormous production volume. Depending on their needs, manufacturers use both fast and slow pyrolysis operations.
Fast pyrolysis pyrolyzes finely ground biomass in a couple of seconds, but slow pyrolysis bakes big particles for longer, resulting in better carbon sequestration. For example, Three Dimensional Timberlands (3DT) has developed vacuum pyrolysis technology that can produce 3 metric kilotons of feedstock per hour.
In 2019, gasification was the second-largest category, accounting for nearly 20% of the overall market share in terms of volume.
To know about the Research Methodology :- Request Free Sample Report
2019 is considered as a base year to forecast the market from 2021 to 2027. 2020’s market size is estimated on real numbers and outputs of the key players across the globe. The past five years trends are considered while forecasting the market through 2027. 2020 is a year of exception and analyzed especially with the impact of lockdown by region.
On the basis of Application, the U.S. Biochar market is segmented into nine types as follows, Agriculture, Energy production, Stock fodder, Cosmetics, Metallurgy, Construction sector, Wastewater treatment, Food Industry, and Others.
In 2019, Agriculture was the most popular application sector, accounting for 82.4% of total market volume. Driven by the rising demand for improved soil fertility and water holding capacity, the agriculture sector is expected to grow significantly with a CAGR of xx% over the forecast period.
U.S. Biochar Market Regional Insights:
In 2019, California led biochar demand in the United States, with a revenue share of 19.2 percent. Biochar consumption in California, Oregon, and Washington is expected to grow from the presence of a significant number of suppliers on the west coast. Wheat cultivation is also expected to have a significant impact on product consumption across all states.
Agriculture is a key part of the economy in California. In 2018, the state earned US $50000 million in agriculture revenue. It grows about 400 different types of economic crops, including almonds, avocados, marijuana, rice, grapes, and strawberries. Led to growing production and raising awareness among farmers, this state is expected to have the highest biochar use.
In terms of biochar use, Texas was the second-largest state in 2019. The need for biochar in the state is driven by a large number of farms and agricultural land. Around 2018, Texas farmers earned US $25000 million in revenue. The state has the most farms and ranches in the country, with 2,48,816 spread across 127 million acres.
Kansas is an important agricultural state, ranking sixth in agricultural production in the United States. Wheat, calves and cattle, soybeans, corn, and pigs are the top five products. Wheat farming is a major biochar consumer in the state. Based on tax adjustments, the state's economy is expected to rebound, resulting in a surplus budget, which is expected to benefit the agricultural sector. Stock fodder and wastewater industries are two other important sectors driving demand for biochar.
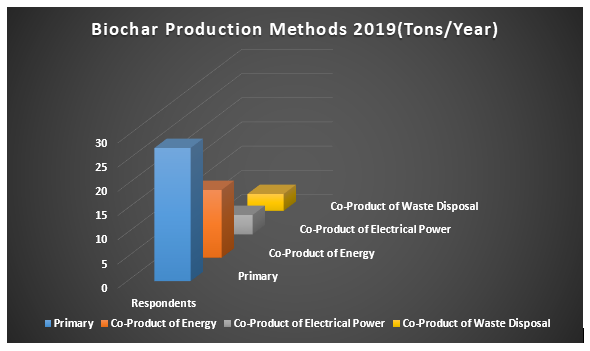
Biochar Production Methods in the United States:
57% of respondents were primarily biochar producers, with 29% as a by-product of energy production and 8% as a by-product of electricity generation.
The objective of the report is to present a comprehensive analysis of the U.S. Biochar market to the stakeholders in the industry. The past and current status of the industry with the forecasted market size and trends are presented in the report with the analysis of complicated data in simple language. The report covers all the aspects of the industry with a dedicated study of key players that include market leaders, followers, and new entrants.
PORTER, PESTEL analysis with the potential impact of micro-economic factors of the market have been presented in the report. External as well as internal factors that are supposed to affect the business positively or negatively have been analyzed, which will give a clear futuristic view of the industry to the decision-makers.
The report also helps in understanding the U.S. Biochar market dynamics, structure by analyzing the market segments and project the U.S. Biochar market size. Clear representation of competitive analysis of key players by product, price, financial position, product portfolio, growth strategies, and regional presence in the U.S. Biochar market make the report investor’s guide.
U.S. Biochar Market Scope: Inquire before buying
U.S. Biochar Market, by Region
• North America
• South America
U.S. Biochar Market Key Players
• AgEnergy
• AirTerra
• BC Biocarbon
• BioPreta
• Brimac Char
• Carbo Culture
• Ecochar
• Newlife Green
• GoBiochar
• Kellogg Garden Products
• Lewis Bamboo
• Mirimichi Green
• National Carbon Technologies
• New England Biochar
• Organilock
• Pacific Biochar
• Real Montana Charcoal
• Soil Reef LLC
• TerraChar
• Vermont Biochar
• Wakefield Biochar
• Others
Frequently Asked Questions:
1. What is the forecast period considered for the U.S. Biochar market report?
Ans. The forecast period for the U.S. Biochar market is 2021-2027.
2. Which key factors are hindering the growth of the U.S. Biochar market?
Ans. Biochar of variable quality and delivery are the key factors hindering the growth of the U.S. Biochar market.
3. What is the compound annual growth rate (CAGR) of the U.S. Biochar market for the next 6 years?
Ans. The U.S. Biochar market is expected to grow at a CAGR of 18.2% during the forecast period (2021-2027).
4. What are the key factors driving the growth of the U.S. Biochar market?
Ans. The growing demand for biochar for soil remediation, organic food, and wastewater treatment respectively are the key factors driving the growth of the U.S. Biochar market.
5. Which are the regional major key players covered for the U.S. Biochar market report?
Ans. AgEnergy, AirTerra, BC Biocarbon, BioPreta, Brimac Char, Carbo Culture, Ecochar, Newlife Green, GoBiochar, Kellogg Garden Products, Lewis Bamboo, Mirimichi Green, National Carbon Technologies, New England Biochar, Organilock, Pacific Biochar, Real Montana Charcoal, Soil Reef LLC, TerraChar, Vermont Biochar, Wakefield Biochar, and Others.