
Rare-Earth Metals Market Size – Industry Structure Evaluation, Demand Drivers Analysis, Regional Growth Analysis and Identification, Competitive Positioning Review & Global Market Size Forecast to 2032
Overview
The Rare-Earth Metals Market size was valued at USD 7.51 Billion in 2025 and the total Rare-Earth Metals revenue is expected to grow at a CAGR of 12.4% from 2025 to 2032, reaching nearly USD 17.04 Billion by 2032.
Rare-Earth Metals Market Overview:
The Rare-Earth Metals Market was valued at US$ 7.51 Billion in 2025. The need for these materials in the fabrication of magnets and catalysts for the automobile industry is driving the market. Cerium is commonly utilised as a catalyst in automobile catalytic converters, whereas neodymium and praseodymium are used in the creation of electric vehicle batteries. According to the International Energy Agency, the global stock of electric automobiles surpassed 5 million in 2019, up 63 % from 2018. The usage of permanent Magnets in the manufacture of batteries are expected to grow in response to the rising demand for electric vehicles to reduce CO2 emissions. Rare earth permanent magnets based on neodymium and praseodymium are commonly utilised in the production of batteries.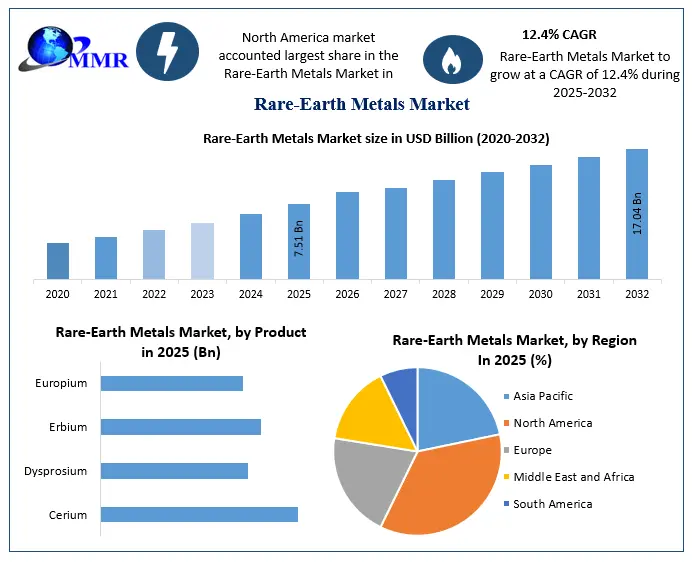 To know about the Research Methodology :- Request Free Sample Report
COVID-19 impact on Rare-Earth Metals Market:
Several countries' factories were forced to close during the early stages of the epidemic as governments imposed severe lockdowns to prevent the virus from spreading. Rare-earth metals manufacturers were allowed to continue manufacturing operations when the lockdown was ended and limitations were loosened, but only in limited capacity and subject to a number of laws and regulations.
Rare-Earth Metals Market Dynamics:
Rising demand of end-user industry: The main rare earth elements used in permanent magnet applications are neodymium, praseodymium, dysprosium, terbium, and yttrium. These metals have special characteristics, such as remanence and high coercivity, which can prevent permanent magnets from losing their magnetism even if they are used for a long time. These magnets are mainly used in the automotive market, and their demand depends on this market. Rare earth permanent magnets can be used in traditional cars and hybrid vehicles.
In the long run, the application of rare earth magnets in wind turbines is expected to become another major growth market. The latest direct-drive wind turbines use rare earth magnets to remove the gearbox from the turbine, greatly reducing weight and maintenance issues. Due to its excellent performance to size ratio and strong magnetic strength, rare-earth magnets are widely employed in important consumer and industrial electronic applications, such as Smartphone’s, acoustic speakers, and hard disc drives. In the next five to ten years, the use of rare-earth metals in permanent magnets is expected to grow by 12% to 14%.
New Recycling and reuse of rare-earth metals: Until new uses are discovered, rare earth metals are relatively cheap. The substantial spike in metal prices has created a gap in the supply and demand chain for rare earth metals. Metals were not as essential in the prior five years. Therefore, due to the inconsistency of demand and supply, many of them are wasted. At present, the situation of rare earth metals is different. Many key industries, including green technology and national defense, use large amounts of rare earth metals. Recycling is a method to reduce the criticality of metals and provide a secondary supply of critical metals. The existing rare earth metal recovery rate is less than 5%, which provides an important opportunity for important recovery work. Recycling will not only provide a secondary source of supply, but it will also have a positive impact on the environment by reducing mining.
Costs of rare-earth metals fluctuate: As the price of raw materials fluctuates, manufacturers either bear additional costs or increase product prices. The demand for rare earth metals depends on the demand for their applications. In addition, the demand for applications depends on the end-user industry. Therefore, rare earth metals have a dual supply chain, which further increases the final price demand of manufacturers. When the price of raw materials suddenly rises, some manufacturers look for new suppliers to maintain their revenue targets. This usually means sourcing materials from low-cost economies. Switching to a different source of raw materials brings a high risk of disrupting the supply chain.
Rare-Earth Metals Market Segment Analysis:
On the basis of product, the Rare-Earth Metals Market is sub-segmented into Cerium, Dysprosium, Erbium, Europium, Gadolinium, Holmium, Lanthanum, Lutetium, Neodymium, Praseodymium, Promethium, Samarium, Scandium, Terbium, Thulium, Ytterbium, and Yttrium. The cerium segment held the largest market share of 42.8% in 2025. Cerium is used as a catalyst in catalytic converters in exhaust systems in the automotive sector to reduce emissions. It's also found in nickel-metal hydride (NiMH) batteries. Over the forecast period, the increased demand for hybrid vehicles is expected to have a beneficial impact on rare earth demand.
In neodymium iron boron (Neo) permanent magnets, dysprosium is primarily utilized as an alloying agent. Neo magnets are employed in a wide range of applications, including transportation, power generation, aerospace, medical, defense, and industrial. Over the forecast period, the dysprosium market is likely to be driven by rising demand for neo magnets.
On the basis of application, the Rare-Earth Metals Market is sub-segmented into Magnets, Catalysts, Metallurgy, Polishing, Glass, Phosphors, Ceramics, and Ceramics. The magnet segment held the largest share of xx% in 2025. They're employed in a variety of places, including computer hard drives, linear actuators, servo motors, speakers, and sensors. Over the forecast period, rising demand for magnets in autos, turbines, and consumer electronics is expected to enhance rare earth element usage.
The ceramic segment is expected to grow at CAGR of xx% during the forecast period. Cerium oxide is used as a glaze for ceramic tiles and as an opacifier. According to the Ceramic World Web, the output of ceramic tiles increased by 2.2% from 2025 to 2032. Increasing ceramics output as a result of increased building activity in emerging countries is expected to have a favorable impact on rare earth consumption in the future.
Rare-Earth Metals Market Regional Insights:
North America held the largest market share of xx % in 2025. The region's increasing automobile industry is driving up demand for rare earth elements. For example, Tesla, a leading American electric car company, revealed in 2025 that it's Model 3 Long Range automobiles would use neodymium. Over the forecast period, this move is expected to boost neodymium demand. Consumer electronics and nuclear power are expected to drive demand for rare earth over the forecast period. The United States is the world's largest nuclear energy producer, generating moreover 30% of worldwide electricity. According to the World Nuclear Association, the government is building two nuclear reactors. The region's market growth is likely to be aided by the growing need for nuclear reactors.
The Europe has second dominant region and it held xx% of the share in 2025. Due to their increasing applications in magnets, metallurgy, catalysts, glass, and ceramics, rare earth demand in Europe is likely to rise. In Europe, the automotive industry is the largest end-user of rare earth. According to the Organization for International Cooperation on Automobiles (OICA), Europe became the world's second-largest producer of automobiles in 2025, accounting for 22.3%.
Recent development:
1. Avalon Advanced Materials stated in February 2022 that it has reached an agreement to buy 2333382 Ontario INC., a private Ontario corporation with four industrial mineral mines and a processing factory near Matheson. The firms have determined that the presence of rare earth, scandium, and zirconium in the Ontario INC plants will be recovered through tailing operations.
2. Rio Tinto began producing scandium oxide in January 2022 after completing a commercial-scale demonstration plant in Sorel-Tracy, Quebec. The scandium oxide's initial capacity is 3 tonnes per year, or around 20% of current global production.
The objective of the report is to present a comprehensive analysis of the Rare-Earth Metals Market to the stakeholders in the industry. The past and current status of the industry with the forecasted market size and trends are presented in the report with the analysis of complicated data in simple language. The report covers all the aspects of the industry with a dedicated study of key players that include market leaders, followers, and new entrants.
PORTER, PESTEL analysis with the potential impact of micro-economic factors of the market has been presented in the report. External as well as internal factors that are supposed to affect the business positively or negatively have been analyzed, which will give a clear futuristic view of the industry to the decision-makers.
The report also helps in understanding the Rare-Earth Metals Market dynamics, structure by analyzing the market segments and projects the Rare-Earth Metals Market size. Clear representation of competitive analysis of key players by product, price, financial position, product portfolio, growth strategies, and regional presence in the Rare-Earth Metals Market make the report investor’s guide.
Rare-Earth Metals Industry Ecosystem
Rare-Earth Metals Market Scope: Inquire before buying
| Global Rare-Earth Metals Market | |||
|---|---|---|---|
| Report Coverage | Details | ||
| Base Year: | 2025 | Forecast Period: | 2026-2032 |
| Historical Data: | 2020 to 2025 | Market Size in 2025: | US $ 7.51 Bn. |
| Forecast Period 2026 to 2032 CAGR: | 12.4 % | Market Size in 2032: | US $ 17.04 Bn. |
| Segments Covered: | by Product | Cerium Dysprosium Erbium Europium Gadolinium Holmium Lanthanum Lutetium Others |
|
| by Application | Magnets Catalysts Metallurgy Polishing Glass Phosphors Ceramics Other |
||
Rare-Earth Metals Market, by Region
North America (United States, Canada and Mexico)
Europe (UK, France, Germany, Italy, Spain, Sweden, Austria and Rest of Europe)
Asia Pacific (China, South Korea, Japan, India, Australia, Indonesia, Malaysia, Vietnam, Taiwan, Bangladesh, Pakistan and Rest of APAC)
Middle East and Africa (South Africa, GCC, Egypt, Nigeria and Rest of ME&A)
South America (Brazil, Argentina Rest of South America)
Rare-Earth Metals Market Key Players are:
1. Lynas Corporation
2. Alkane Resources
3. Arafura Resources
4. China Minmetals Rare
5. Avalon Advanced Materials
6. Iluka Resource
7. Canada Rare Earth
8. Shin-Etsu Chemical Co. Ltd.
9. China Northern Rare Earth
10. Molycorp Inc
11. Rare Element Resources
12. Eutectix
13. Indian Rare Earths
14. Great Western Minerals
15. Frontier Rare Earths.
16. Greenland Minerals & Energy
17. Ucore Rare Metals Inc.
18. Medallion Resources Ltd
Frequently Asked Questions:
1. Which region has the largest share in Rare-Earth Metals Market?
Ans: North America region holds the highest share in 2025.
2. What is the growth rate of Rare-Earth Metals Market?
Ans: The Rare-Earth Metals Market is growing at a CAGR of 12.4% during forecasting period 2026-2032.
3. What segments are covered in Rare-Earth Metals Market?
Ans: Rare-Earth Metals Market is segmented into product, application and region.
4. Who are the key players in Rare-Earth Metals Market?
Ans: The important key players in the Rare-Earth Metals Market are - Lynas Corporation, Alkane Resources, Arafura Resources, China Minmetals Rare, Avalon Advanced Materials, Iluka Resource, Canada Rare Earth, Shin-Etsu Chemical Co. Ltd. China Northern Rare Earth, Molycorp Inc, Rare Element Resources, Eutectix.
5. What is the study period of this market?
Ans: The Rare-Earth Metals Market is studied from 2025 to 2032.