
Virus Filtration Market by Product & Services Segment, Filtration Technology, Application / End-Use Industry, and Region - Global Market Size Estimation, Industry-Wide Analysis, Competitive Landscape Assessment & Long-Term Forecast to 2032
Overview
Global Virus Filtration Market size was valued at USD 5.16 Bn in 2024 and Virus Filtration Market revenue is expected to reach USD 11.14 Bn by 2032, at a CAGR of 10.1% over the forecast period.
Virus Filtration Market Overview
Virus filtration is a specialized membrane-based separation process used to remove or reduce viral contaminants from biological products, particularly in the production of biopharmaceuticals such as vaccines, monoclonal antibodies, and recombinant proteins.
The growth is coupled with the rising prevalence of chronic diseases including cancer, diabetes, and autoimmune disorders. According to the International Agency for Research on Cancer, around 14.1 million new cancer cases were diagnosed worldwide in 2017 and this number is projected to reach 21.7 million by 2022. Thus, there is a growing demand for therapeutic biologics for the treatment of such chronic diseases, which consequently propel the demand for virus filtration products for R&D and manufacturing applications.
Compliance with drug development & production regulatory frameworks such as Current Good Manufacturing Practice (cGMP) regulations is another main driver expected to boost the Global Virus Filtration Market. Virus safety of these products is ensured by manufacturers through various quality control measures such as monitoring and quality check of raw materials, validation & implementation of efficient virus clearance technology, as well as validation of the final product for the absence of virus contamination. Thus, the demand for these products is very high for manufacturing and R&D practices.
In 2023, Thermo Fisher invested over $200 million in expanding biologics capabilities, including viral clearance services and filtration technologies at its CDMO sites. The company offers a comprehensive range of virus filtration membranes and validation services.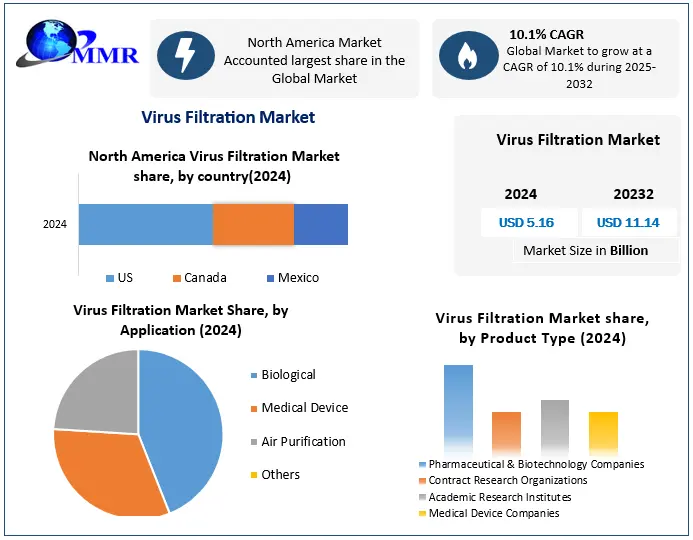 To know about the Research Methodology :- Request Free Sample Report
Virus Filtration Market Dynamics
Increasing Biopharmaceutical Production to boost Virus Filtration Market growth
The rapid increase in biopharmaceutical production is a significant driver of growth in the virus filtration market, influenced by a combination of economic factors, shifting Virus Filtration industry dynamics, and evolving consumer behavior trends. Biopharmaceuticals—such as monoclonal antibodies, vaccines, gene therapies, and recombinant proteins—are transforming modern medicine by offering targeted, effective treatments for a wide range of chronic and infectious diseases. Growing consumer preference for personalized and biologically derived therapies has pushed pharmaceutical companies to increase production, creating stronger demand and supply dynamics in the market. This demand is not only driven by patient needs but also by competitive forces among key players aiming to capture greater market share through advanced and safe biologic offerings.
Virus filtration plays a crucial role in the downstream processing of biopharmaceuticals. As market shifts toward more stringent quality and safety standards, virus filtration has become essential for ensuring that biologics remain free from potential viral contaminants introduced during upstream production. Regulatory agencies such as the U.S. FDA and the European Medicines Agency (EMA) mandate virus clearance, making virus filtration a critical part of compliance strategies. The presence of competitive forces in the virus filtration market—ranging from established players to innovative startups—has led to rapid innovation in filter technology, offering solutions that are scalable, disposable, and adaptable to various production environments.
As biologics become more structurally complex and sensitive, the need for advanced virus filtration technologies has intensified. Additionally, economic factors such as increased investment in healthcare infrastructure and global vaccine initiatives have made filtration technologies more accessible, especially in emerging markets. Virus Filtration companies are responding to consumer behavior trends that favor high-quality, safe, and quickly available therapeutics, especially in light of recent global health crises. In this context, the rising demand and supply for biopharmaceuticals reinforce the critical role of virus filtration technologies in meeting regulatory expectations, ensuring patient safety, and maintaining competitive advantage in a rapidly evolving Virus Filtration Market.
Expanding Research and Development Activities to fuel the Virus Filtration Market growth
Research and development activities across the pharmaceutical, biotechnology, and life sciences sectors have seen substantial growth in recent years. Several factors are contributing to this expansion. Biopharmaceuticals, including monoclonal antibodies, gene therapies, and cell-based therapies, are gaining prominence. As the demand for these products grows, so does the need for advanced virus filtration technologies to ensure their safety and efficacy. India has the second-largest number of U.S. FDA-approved manufacturing facilities outside the United States.
Additionally, in August 2024, the Indian government introduced the BioE3 Policy to strengthen biotechnology-based manufacturing in the country.
Risk of product loss or yield reduction to restraint Virus Filtration Market Growth
Virus filtration is a crucial step in ensuring the viral safety of biopharmaceuticals, but the physical separation mechanism—typically based on size exclusion— inadvertently retain or bind therapeutic proteins, enzymes, or other active molecules along with viral contaminants. This is especially problematic for biologics that are structurally delicate or present in low concentrations, such as monoclonal antibodies, gene therapy vectors, or recombinant proteins. Even minor losses during filtration significantly affect the overall product yield, compromising the cost-efficiency and viability of the production process.
This issue poses a major challenge to process optimization and scalability, particularly for large-scale commercial manufacturing. Virus Filtration manufacturers must carefully balance the need for effective virus removal with the imperative to maintain high product recovery rates. In some cases, additional process development or testing is required to validate and fine-tune filtration conditions, increasing time and operational costs. As a result, the risk of product loss not only affects batch-to-batch consistency and profitability but also acts as a barrier for smaller firms or those with limited resources, thereby restraining broader market growth and adoption of virus filtration technologies.
Virus Filtration Market Regional Insight
Robust Biopharmaceutical Industry to boost the North America Virus Filtration Market growth
North America dominated the market in 2024 and is expected to hold the largest Virus Filtration Market share over the forecast period. The United States, in particular, is home to some of the largest pharmaceutical and biotechnology companies globally, including Pfizer, Amgen, Johnson & Johnson, and Biogen, which continuously invest in the development and production of advanced biologics such as monoclonal antibodies, gene therapies, and vaccines. This surge in biologics manufacturing is fueling the demand for virus filtration systems as a critical step in ensuring the viral safety and purity of these therapeutics.
The region’s increasing prevalence of chronic diseases and infectious outbreaks has led to growing demand for effective and targeted biologics. The COVID-19 pandemic further accelerated investment in vaccine and therapeutic development, highlighting the importance of rapid, scalable, and reliable virus filtration technologies. North America’s strong regulatory environment, led by the U.S. Food and Drug Administration (FDA), mandates rigorous viral clearance validation for all biologics, reinforcing the critical role of virus filtration in product approval and commercialization. Additionally, technological advancements and the adoption of single-use filtration systems are boosting the Virus Filtration market. Manufacturers are increasingly adopting pre-validated, disposable virus filters that offer flexibility, reduced risk of cross-contamination, and compatibility with continuous manufacturing setups. The presence of well-established contract manufacturing organizations (CMOs) and the growing outsourcing of biologics production are also contributing to the rising demand for efficient virus filtration solutions.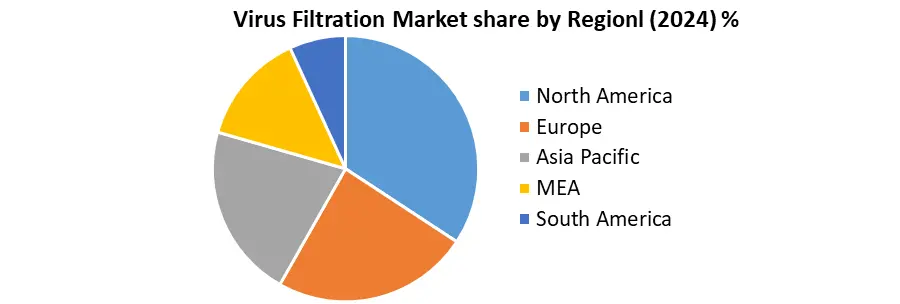
Virus Filtration Market Segment Analysis
Based on Product, the market is segmented into Kits and Reagents, Filtration Systems, Other Products, and Services. Kits and Reagents segment dominated the market in 2024 and is expected the largest Virus Filtration Market share over the forecast period. This segment includes virus filters, buffer solutions, validation kits, and reagents used during virus inactivation and filtration steps in downstream processing. These components are critical for maintaining product integrity while achieving high viral clearance, especially in the production of monoclonal antibodies, recombinant proteins, gene therapies, and vaccines. Regulatory compliance and validation requirements necessitate the use of validated and standardized reagents and kits to ensure consistent performance and documentation for virus clearance. Manufacturers rely heavily on trusted, high-performance kits to meet stringent FDA, EMA, and other regulatory body guidelines.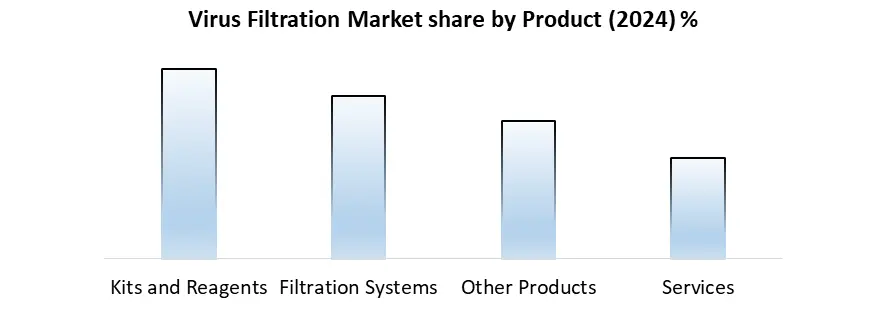
Virus Filtration Market Competitive Landscape
The virus filtration market is moderately consolidated, with several global players dominating due to their strong product portfolios, advanced technologies, and wide distribution networks. Key companies are focused on strategic partnerships, product innovations, acquisitions, and capacity expansion to maintain their competitive edge and meet growing demand driven by the rise in biologics manufacturing and regulatory stringency.
In October 2023, Merck announced a €300 million expansion of its filtration manufacturing capacity in Ireland, aimed at enhancing its membrane production for virus filtration and supporting global biopharmaceutical demand. The company’s Viresolve Pro filters are widely used for virus removal in biologic drug production, particularly monoclonal antibodies.
In 2023, Sartorius expanded its product line with Sartobind Rapid a technology, designed for high-throughput purification including viral safety assurance. Sartorius also completed acquisitions to enhance its bioprocessing capabilities, reinforcing its position in virus filtration.
Virus Filtration Market Scope: Inquire before buying
| Virus Filtration Market | |||
|---|---|---|---|
| Report Coverage | Details | ||
| Base Year: | 2024 | Forecast Period: | 2025-2032 |
| Historical Data: | 2019 to 2024 | Market Size in 2024: | USD 5.16 Bn. |
| Forecast Period 2025 to 2032 CAGR: | 10.1% | Market Size in 2032: | USD 11.14 Bn. |
| Segments Covered: | by Product | Kits and Reagents Filtration Systems Other Products Services |
|
| by Application | Biological Medical Device Air Purification Others |
||
| by End User | Pharmaceutical & Biotechnology Companies Contract Research Organizations Academic Research Institutes Medical Device Companies |
||
Virus Filtration Market by Region
North America (United States, Canada and Mexico)
Europe (UK, France, Germany, Italy, Spain, Sweden, Austria and Rest of Europe)
Asia Pacific (China, South Korea, Japan, India, Australia, Indonesia, Malaysia, Vietnam, Taiwan, Bangladesh, Pakistan and Rest of APAC)
Middle East and Africa (South Africa, GCC, Egypt, Nigeria and Rest of ME&A)
South America (Brazil, Argentina, Rest of South America)
Major Virus Filtration Market Key Players include:
North America
1. Merck & Co., Inc. (MilliporeSigma) – USA (Kenilworth, New Jersey)
2. Pall Corporation (Danaher Corporation) – USA (Port Washington, New York)
3. Thermo Fisher Scientific – USA (Waltham, Massachusetts)
4. 3M Company – USA (St. Paul, Minnesota)
5. Repligen Corporation – USA (Waltham, Massachusetts)
6. Charles River Laboratories – USA (Wilmington, Massachusetts)
7. Bio-Rad Laboratories – USA (Hercules, California)
8. GE Healthcare (now Cytiva) – USA (Chicago, Illinois – Cytiva global operations also in Marlborough, Massachusetts)
9. Agilent Technologies – USA (Santa Clara, California)
10. Meissner Filtration Products – USA (Camarillo, California)
Europe
11. Sartorius AG – Germany (Göttingen)
12. Lonza Group AG – Switzerland (Basel)
13. Asahi Kasei Medical Europe – Germany (Dormagen – European subsidiary of Japanese Asahi Kasei)
14. Novasep – France (Lyon)
15. Pall Europe Ltd. – UK (Portsmouth – European base of Pall Corp.)
16. Grifols S.A. – Spain (Barcelona)
17. BIA Separations (a Sartorius company) – Slovenia (Ajdovščina)
18. Merck KGaA (EMD Millipore outside EU) – Germany (Darmstadt)
19. BioProcess International Europe – Belgium
20. Purolite (an Ecolab company) – UK (Llantrisant, Wales)
Asia-Pacific
21. Asahi Kasei Medical Co., Ltd. – Japan (Tokyo)
22. Tosoh Corporation – Japan (Tokyo)
23. Wuxi AppTec – China (Shanghai)
24. JSR Life Sciences (incl. LEWA Bioworks) – Japan (Tokyo)
25. Samsung Biologics – South Korea (Incheon)
26. Hitachi Chemical Advanced Therapeutics Solutions (HCATS) – Japan (Tokyo)
27. Daiichi Sankyo Biotech Co., Ltd. – Japan (Tokyo)
28. Kaneka Corporation – Japan (Osaka)
29. Mycenax Biotech Inc. – Taiwan (Zhubei City)
30. Shandong Sciencare Biological Technology Co., Ltd. – China (Jinan)
Frequently asked Question and Answers:
1. What is virus filtration in biopharmaceutical production?
Ans: Virus filtration is a membrane-based process used to remove or reduce viral contaminants from biologics like vaccines, monoclonal antibodies, and recombinant proteins, ensuring product safety and regulatory compliance.
2. How do chronic diseases impact the virus filtration market?
Ans: Diseases like cancer and autoimmune disorders increase the need for biologics, which in turn drives demand for virus filtration to ensure their safety and purity.
3. Why is the kits and reagents segment dominant in the market?
Ans: It dominates due to frequent use, high demand in every production cycle, and critical importance in maintaining virus safety during downstream processing.
4. What is a major restraint in the virus filtration market?
Ans: Product yield loss during filtration, especially with sensitive biologics, reduce efficiency and scalability, posing challenges for manufacturers.
5. How is North America positioned in the virus filtration market?
Ans: North America leads the market due to its strong biopharmaceutical industry, high investment in R&D, and strict regulatory oversight.