
Virtual Kitchen Market size, by Component, Type, Application Outlook and Region – Global Market Size Estimation, Industry-Wide Analysis, Competitive Landscape Assessment & Long-Term Forecast to 2032
Overview
Global Virtual Kitchen Market size was valued at USD 43.40 Bn. in 2024, and the total Virtual Kitchen Market revenue is expected to grow by 11% from 2025 to 2032, reaching nearly USD 100.02 Bn.
Virtual Kitchen Market Overview:
Virtual kitchens, commonly referred to as cloud or ghost kitchens, are facilities for food production that only deliver. They do not contain any sit-down dining. Virtual kitchens are quickly becoming a preferred option for quick-service restaurants (QSRs), food aggregators, and newer brands because of low investment costs, scalability, and the growing importance of having the option to order food online. The virtual kitchen is providing a shift from a traditional restaurant model to a data-driven model with centralized operations. The report also covered several developments, including the inclusion of artificial intelligence and automation to streamline orders, workflows, and delivery times.
Evolution of multi-brand kitchen concepts whereby operators can operate more than one virtual brand out of a single kitchen location, thereby optimizing resource use. The Asia-Pacific region is emerging as the fastest-growing, with India and China growing the fastest as a result of rising digital adoption and urban population growth, while North America remains the regional leader in terms of market share with its more developed delivery infrastructure and first-mover advantage.
Virtual Kitchen Market Major players include Rebel Foods, Kitopi, Kitchen United, and Cloud Kitchen as the most prominent players using smart kitchen platforms and predictive/analytic capabilities, and possibly pursuing a franchising-type expansion plan to gain competitive advantages. More broadly, the report stresses sustainability for virtual kitchens through the increased use of biodegradable packaging and energy-efficient equipment, as virtual kitchens must adapt to global environmental and consumer demands.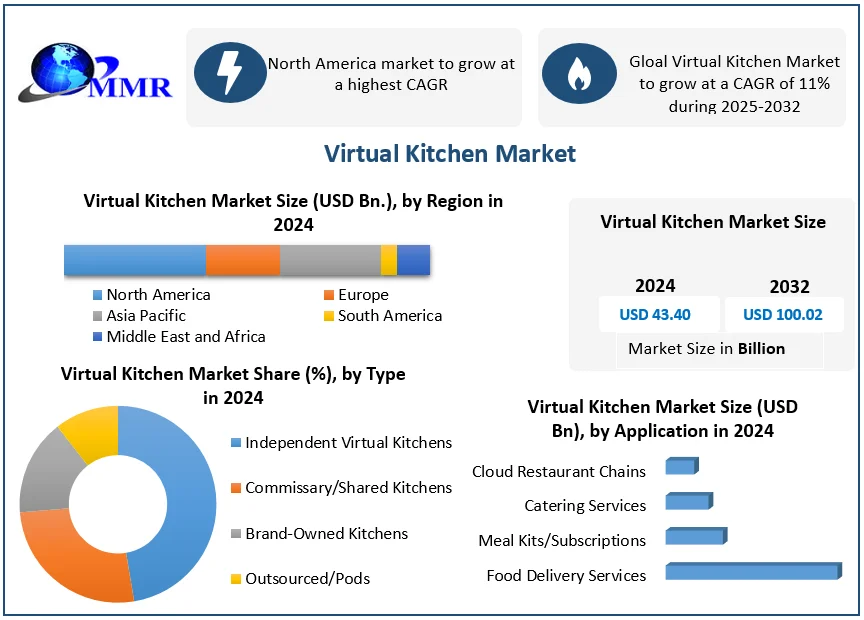 To know about the Research Methodology:- Request Free Sample Report
Global Virtual Kitchen Market Dynamics:
Growing Adoption of AI and Delivery Apps to Drive Virtual Kitchen Market Expansion in the Foodservice and Hospitality Sector
Increasing the use of food delivery apps due to changes in people's lifestyles is another major reason for the growing market outlook. The outlook for the virtual kitchen market means that the market is estimated to generate huge revenues through rapid technology upgrades and increased use of various distribution apps. Key trends in the virtual kitchen market include an increase in the use of artificial intelligence and an increase in transition to digitalization in the hospitality industry.
In addition, increasing acceptance of virtual kitchens to help identify voice commands and operate according to consumer needs and choices is driving the market growth. The increasing trend of online food orders is pushing up the size of the virtual kitchen market. Virtual kitchens are cheap and simple, helping to increase food delivery effectively and quickly.
In addition, as virtual reality and augmented reality evolve, they play a role in the development of the virtual kitchen market, which is fuelling the growth of the market.
High Investment at the initial stage and increasing maintenance costs to restrain the Virtual Kitchen Market
The rising costs of virtual kitchen systems and equipment are one of the potential restrictions on industry expansion in the forecast period. In addition, the introduction of low-cost alternatives may suffocate market expansion. Virtual kitchens cost between $2 and $4 thousand a month to operate, depending on the market, and are turn-key with a low risk of overhead costs. Depending on whether the operator supplies kitchen equipment or simply a white box kitchen space, these costs may vary according to time. Apart from this maintenance cost of the virtual kitchen is also high, which is another major factor hindering the growth of the market.
An incompetent food delivery supply chain and an increase in cybercrime theft to create the Virtual Kitchen Market Challenge
Shifting consumer preferences, unstable market prices, adhering to the food quality standards, and the threat of bigger players are some of the major reasons that pose a major challenge for the virtual kitchen market. However, Increased citizen participation in local government affairs and partnership with the community in service delivery, flexible response to service user complaints, providing value for money, and ensuring that service users pay their bills on time were found to be the most effective strategies for improving service and supply chain delivery.
Artificial intelligence's increasing usage by businesses to create a virtual kitchen market opportunity
Restaurants can benefit from artificial intelligence in the following ways: reduce the costs of Kiosks and chatbots, automate the process of processing orders and reservations, which generally frees up staff time. Customers should be empowered by AI frequently, which allows customers to influence the flow. They place orders and tailor them to meet their requirements with the help of these easily. These factors act as a major opportunity for the market.
Global Virtual Kitchen Market Segment Analysis
Based on Component, the Virtual Kitchen Market is segmented into Software, Services, Hardware, and Others. The software segment has dominated the Virtual Kitchen Market in 2024 and is expected to hold the largest market share over the forecast period, due to its importance in managing operations like order processing, running kitchen display systems, POS, and AI-based analytics. When weighed down by a vast collection of operations within the hospitality realm, combined with the current widespread use of food delivery applications, as well as the ability to collect, assess, and act on data, software platforms support virtual kitchen operation, efficiency, and scale. It is projected to have the greatest share of the market for 2024 and account for 40% or more of the total.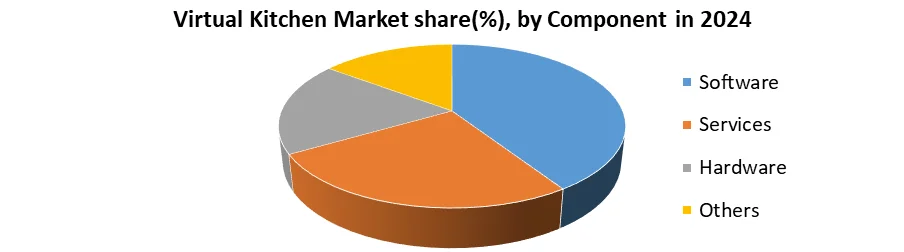
By Type, the Virtual Segment Market is segmented into independent virtual kitchens, commissary/shared kitchens, outsourced virtual kitchens, and brand-owned kitchens. The independent virtual kitchen has dominated the Virtual Kitchen Market in 2024 and is expected to hold the largest market share over the forecast period, due to its affordability, operational flexibility, and easy launch. Independent virtual kitchens help small and mid-sized brands get into the marketplace without a physical storefront and are therefore the most popular format globally.
Virtual Kitchen Market Regional Insights:
The North American region accounted for the largest market share of 40% in 2024. Considering the region's substantial presence of well-established market participants and user base, North America is growing at a constant pace for this market. Rapid technological advancements, solution enhancements, and associated technologies also contribute to the market's growth. The growing adoption of cloud-based technologies across various applications has a beneficial impact on regional market growth.
Furthermore, significant R&D efforts in the development of virtual kitchen solutions, as well as a large need for reliable data backup and recovery systems, are supporting regional market growth. The United States leads the regional market in terms of growing firms, which is followed by Canada.
However, the Asia Pacific region is expected to grow during the forecast period. The APAC area is a virtual market that is only getting started. India, China, and Japan are projected to be the most powerful countries in terms of expanding the market. Consumers' tastes and preferences for virtual kitchens are being taken into account by enterprises operating in the region, which are utilizing cutting-edge technology.
Virtual Kitchen Market Competitive Landscape
The Virtual Kitchen Market is competitive and driven by technology-led foodservice companies that are able to accelerate delivery performance, automate cooking and food preparation, and develop multi-brand strategies. Leading organizations like Rebel Foods (India) and Kitopi (UAE) are at the forefront of the market with new business models and unique implementations to cross geographical borders. Rebel Foods, which holds the status of the world’s largest cloud kitchen operator of the organization, has revenue of USD 170 million in 2024, up 19% year on year. The company currently operates 450 kitchens in India, the Middle East, and Southeast Asia, including scaling a hybrid EatSure food court model and expanding Wendy’s in India.
Kitopi is the largest cloud kitchen driver in the Middle East and has a revenue of USD 165.7 million in 2024 (up 32% year on year), driven by its managed kitchen-as-a-service model, plus enabling software for smart kitchens. The two organizations are also investing in more sophisticated kitchen operations, including artificial intelligence, international partnerships, and maximized shared infrastructure. All of this demonstrates that the competition is fierce, which is driving faster innovation within a global virtual kitchen ecosystem.
Virtual Kitchen Market Recent Development
• In March 2025, Rebel Foods (India) announced an investment of USD 12–18 million to accelerate Wendy's expansion in India with 500 locations by 2028, approximately 70% cloud kitchens and 30% dine-in facilities; Wendy's currently has 200 locations (185 cloud kitchens and 15 dine-in) in 75 cities, illustrating fast paced brand and geographic
• DoorDash Kitchens (USA) announced on 11 May 2025 its intention to acquire the well-known UK-based delivery platform, Deliveroo, for USD 3.6 billion. While this acquisition is largely about enhancing the delivery app offering, the acquisition augments DoorDash's Kitchens footprint in Europe and provides further investment to DoorDash's global kitchen ecosystem through information and infrastructure integration with Deliveroo.
• In 2025, Kitopi (UAE) received more investment (undisclosed amount) into its smart kitchen operations and expanding partnerships with international QSR brands across the Middle East, although specific details are downplayed, demonstrating confidence from investors and expansion into regional markets.
• Kitchen United (USA) was acquired by SBE Entertainment Group in March 2024, changing the dynamic of its ghost kitchen model by combining back-of-house automation with order management directly inside SBE's hospitality venues. The acquisition of Kitchen United also resulted in its assets being consolidated under SBE and repositioning towards mixed-use event and delivery operations.
• Ghost Kitchens Canada (which supports operators like Coho Collective) recently opened its eighth commissary facility in Canada. The new site in Vancouver’s East manufacturing district will serve more than 40 brands using shared kitchen and production services, a keen indicator of growing demand and diversification of the portfolio.
Virtual Kitchen Market Recent Trends
1. Rise of Multi-Brand Virtual Kitchens
Operators are running multiple food brands from a single kitchen to optimize space and staff.
For Example, Rebel Foods (India) manages over 45 brands (e.g., Faasos, Behrouz Biryani, Ovenstory) from centralized cloud kitchens, boosting ROI and catering to various customer tastes from one location.
2. Integration of AI and Predictive Analytics
AI is being used to forecast demand, personalize menus, and optimize delivery routes.
For Example, Kitopi (UAE) uses smart kitchen operating systems to manage orders in real-time and reduce delivery time based on predictive algorithms.
3. Aggregator-Owned Cloud Kitchens
Food delivery platforms are launching their kitchens to gain more control over the supply chain. For example, Deliveroo Editions (UK) and DoorDash Kitchens (USA) provide kitchens to partner restaurants to operate delivery-only services with platform integration.
Virtual Kitchen Market Scope: Inquire before buying
| Virtual Kitchen Market | |||
|---|---|---|---|
| Report Coverage | Details | ||
| Base Year: | 2024 | Forecast Period: | 2025-2032 |
| Historical Data: | 2019 to 2024 | Market Size in 2024: | USD 43.40 Bn. |
| Forecast Period 2025 to 2032 CAGR: | 11% | Market Size in 2032: | USD 100.02 Bn. |
| Segments Covered: | by Component | Software Services Hardware Others |
|
| by Type | Independent virtual kitchens, Commissary/shared kitchens. Outsourced/Pods virtual kitchens Brand-owned kitchens |
||
| by Application | Cloud Restaurant Chains Catering Services Meal kits/ Subscriptions Food Delivery Services |
||
Virtual Kitchen Market by Region
North America (United States, Canada and Mexico)
Europe (United Kingdom, France, Germany, Italy, Spain, Sweden, Russia, Rest of Europe)
Asia Pacific (China, Japan, South Korea, India, Australia, Malaysia, Thailand, Vietnam, Indonesia, Philippines, Rest of APAC)
Middle East and Africa (South Africa, GCC, Nigeria, Egypt, Turkey, Rest of MEA)
South America (Brazil, Argentina, Colombia, Chile, Peru, Rest of South America)
Virtual Kitchen Market Key Players are:
North America
1. Homer TLC, Inc. (USA)
2. Clicky Media (USA)
3. The National Kitchen & Bath Association (USA)
4. Aetna, Inc. (USA)
5. The Saturn Corporation (USA)
6. DoorDash (USA)
7. Kitchen United (USA)
8. Zuul Kitchens, Inc. (USA)
9. Starbucks Coffee Company (USA)
10. Ghost Kitchen Orlando (USA)
Europe
1. Cawdor Stone Gallery (UK)
Asia Pacific
1. Micro-Star International (MSI) (Taiwan)
2. Dahmakan (Malaysia)
3. Rebel Foods (India)
Middle East
1. Kitopi (UAE)
Frequently Asked Questions:
1. Which region has the largest share in the Global Virtual Kitchen Market?
Ans: North America held the highest share in 2024.
2. What is the growth rate of the Global Virtual Kitchen Market?
Ans: The Global Market is expected to grow at a CAGR of 11% during the forecast period 2025-2032.
3. What is the scope of the Global Virtual Kitchen Market report?
Ans: The Global Virtual Kitchen Market report helps with the PESTEL, Porter's, Recommendations for Investors and leaders, and market estimation for the forecast period.
4. Who are the key players in the Global Virtual Kitchen Market?
Ans: The important key players in the Global Virtual Kitchen Market are – Kitopi (UAE), Micro-Star International (MSI) (Taiwan), Dahmakan (Malaysia), Rebel Foods (India), etc
5. What is the study period of the Virtual Kitchen Market?
Ans: The Global Virtual Kitchen Market is studied from 2024 to 2032.