
Uranium Market By Product Type, By Uranium Grade, By Mining Method, By Supply Source, By Enrichment Level, By Application, By End User and Regional Insights 2034
Overview
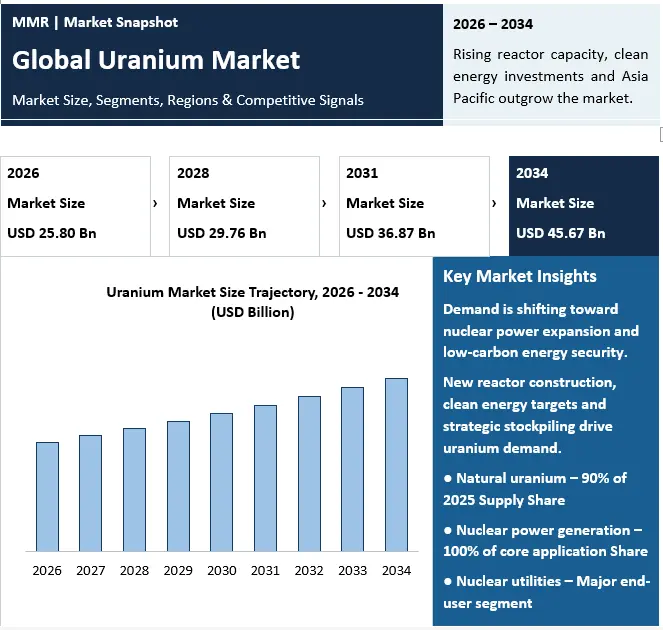
The Global Uranium Market was valued at USD 25.80 Billion in 2026 and is projected to reach USD 49.05 Billion by 2034, growing at a CAGR of 7.4% during 2027-2034, according to Maximize Market Research (MMR). Uranium is the fuel feedstock of nuclear power. The market covers natural uranium (U3O8 yellowcake and natural uranium hexafluoride), enriched uranium (low-enriched uranium, LEU, and high-assay low-enriched uranium, HALEU), depleted uranium and reprocessed uranium, produced by open-pit mining, underground mining, in-situ recovery (ISR), heap leaching and byproduct recovery. Buyers are nuclear power generation utilities, nuclear fuel fabrication companies, government and defense organizations, research institutions and laboratories, and nuclear technology developers.
Demand is anchored by a growing reactor fleet. The International Atomic Energy Agency (IAEA) reports 413 operating reactors with 377.1 GWe of capacity at the end of 2026 and, in its September 2026 outlook, raises its high case to 1,045 GWe by 2050 and 1,284 GWe by 2060. The OECD Nuclear Energy Agency (NEA) and IAEA Red Book puts reactor-related uranium requirements at about 64,500 tU in 2024, rising to between 84,800 tU and 143,900 tU by 2050, while world mine output reached 61,924 tU in 2024, the highest level since 2016. Identified resources recoverable below USD 260 per kgU exceed 8.1 million tonnes, so geology is not the constraint; investment, permitting and enrichment capacity are.
Prices and contracting are firming. Cameco reported an average long-term uranium price of USD 96.50 per pound U3O8 and a spot price of USD 89.63 per pound at 30 September 2026, up USD 13.50 and USD 7.00 over twelve months, and says utilities are still contracting below replacement-rate demand. The U.S. Energy Information Administration (EIA) shows that U.S. reactor owners bought 46.9 million pounds U3O8e in 2026 at a weighted-average USD 58.46 per pound, with 87% delivered under long-term contracts, and paid USD 108.70 per separative work unit (SWU) for enrichment. Supply is concentrated: Kazatomprom produced 25,839 tU in 2026 on a 100% basis and guides to 27,500-29,000 tU for 2026, subject to sulphuric acid availability.
Governments are rebuilding the fuel chain. The U.S. Department of Energy (DOE) announced USD 2.7 billion in enrichment task orders on 5 January 2026: USD 900 million each to American Centrifuge Operating (Centrus) and General Matter for HALEU capacity and to Orano Federal Services for LEU capacity. Executive orders signed on 23 May 2026 set a goal of 400 GW of U.S. nuclear capacity by 2050, and the Prohibiting Russian Uranium Imports Act restricts Russian-origin enriched uranium, with waivers possible through 2028.
This report answers both sides of the search: what the uranium market is worth for miners, converters, enrichers, fabricators, utilities and investors, and what buyers ask most, from uranium market size, uranium price forecast and uranium supply and demand to enriched uranium, HALEU, in-situ recovery uranium mining, secondary uranium supply and the policies that shape nuclear fuel procurement.
Maximize Market Research provides a segment-level analysis of the global uranium market size, share and forecast by product type, uranium grade, mining method, supply source, enrichment level, application and end user, together with regional analysis, value-chain mapping, competitive landscape and strategic scenarios through 2034.
Uranium Market Growth Outlook
To know about the Research Methodology :- Request Free Sample Report
Global Uranium Market Overview:
MMR measures the market at vendor-revenue level across the front end of the nuclear fuel cycle: natural uranium concentrate, conversion to uranium hexafluoride, enrichment services, depleted and reprocessed uranium, and defense-grade and research material sold to reactor operators, fuel fabricators and governments. The defining traits are long-term contracts that lag spot prices, a small number of large mines, enrichment and conversion bottlenecks, and policy-driven buying of secure supply.
Three shifts shape 2026-2034: demand moves from replacement of retiring units to genuine fleet growth, including life extensions, restarts and small modular reactors (SMRs); value shifts from mined pounds to enrichment, conversion and HALEU capacity as buyers diversify away from single-country supply; and term contracting at higher prices pulls ISR, brownfield and restart projects forward while secondary supply fades.
Key Findings: Eight Insights Shaping the Global Uranium Market
MMR’s analysis of EIA, IAEA, NEA, DOE and company disclosures from Kazatomprom and Cameco points to eight findings that explain where uranium value is created through 2034.
| # | Finding | Evidence | So what |
| 1 | The market grows about 1.9x by 2034 | USD 25.80 Bn (2026) to USD 49.05 Bn (2034) at 7.4% CAGR (MMR) | Fuel supply shifts from cyclical to structural growth |
| 2 | The reactor fleet keeps growing | IAEA: 413 reactors and 377.1 GWe at end-2026; high case 1,045 GWe by 2050 | A rising demand base for decades |
| 3 | Requirements outrun mine supply | Red Book: 64,500 tU needed in 2024 vs 61,924 tU mined; 84,800-143,900 tU by 2050 | New mines and long-term contracts are needed |
| 4 |
Term prices lead the market |
Cameco: long-term USD 96.50/lb, spot USD 89.63/lb at 30 Sep 2026 | Utilities pay for security of supply |
| 5 | Legacy contracts lag the market | EIA: U.S. reactors paid USD 58.46/lb in 2026; 87% under long-term contracts at USD 55.91 | Realized prices reset upward as contracts roll |
| 6 | Enrichment is the tightest link | EIA: USD 108.70/SWU, 77% of U.S. SWU from foreign suppliers; DOE USD 2.7 Bn awards | Enrichment, conversion and HALEU earn the premium |
| 7 | Supply is concentrated | Kazatomprom 25,839 tU in 2026; Cameco Cigar Lake 19.1 Mlb and McArthur River/Key Lake 15.1 Mlb (100% basis) | Single-mine outages and reagent supply move prices |
| 8 | Policy turns fuel into strategy | U.S. 400 GW goal by 2050; Russian import restrictions with waivers through 2027 | Domestic and allied fuel chains win funding |
Global Uranium Market Dynamics:
Uranium Market Growth Drivers: Reactor Fleet Growth, Supply Security and Government Targets
• Reactor fleet growth and life extensions. The IAEA counts 413 operating reactors at end-2026 and, at end-2024, 62 reactors with 64.4 GW under construction. Its high case reaches 1,045 GWe by 2050, with extensions offsetting retirements.
• Electricity demand and firm clean power. Nuclear generated 2,689.1 TWh in 2026, 8.4% of world electricity (IAEA). Cameco’s management describes AI and data-center load as added upside rather than the foundation of demand.
• Government targets. U.S. executive orders of 23 May 2026 aim for 400 GW by 2050, 10 large reactors under construction by 2030 and 5 GW of uprates.
• Supply-security policy. The Prohibiting Russian Uranium Imports Act and DOE’s USD 2.7 billion enrichment awards push buyers toward diversified, allied and domestic supply.
• Under-contracted utilities. Cameco says contracting remains below replacement rate; industry term contracting was 42 million pounds in the first nine months of 2026 against 45 million a year earlier.
• Higher prices for new supply. Long-term prices of USD 96.50 per pound support ISR expansions and restarts; the Red Book notes exploration spending recovered to about USD 800 million in 2022.
Uranium Market Restraints: Long Lead Times, Supply Concentration and Capacity Bottlenecks
• Long development lead times. The Red Book stresses that long lead times for new projects raise the risk of supply disruption if investment is delayed.
• Concentrated and disruption-prone supply. Kazatomprom’s 2026 guidance depends on sulphuric acid, and Cameco’s Key Lake outage cut third-quarter 2026 production 20% to 3.5 million pounds.
• Conversion and enrichment bottlenecks. Cameco notes conversion is capital-intensive and needs policy and contract certainty; new Western enrichment capacity, such as Orano’s Oak Ridge plant, targets LEU output only from 2031.
• Contract price ceilings. Cameco’s realized price rose 10% to USD 66.64 per pound in nine months while spot rose 22%, showing how legacy ceilings cap producer gains.
• Proliferation and licensing limits. HALEU and highly enriched uranium face safeguards, licensing and weapons-risk scrutiny that slow deployment.
What Are the Biggest Uranium Market Opportunities Through 2034?
• HALEU for advanced reactors and SMRs: DOE awarded USD 900 million each to Centrus’ American Centrifuge Operating and General Matter, and Centrus plans 12 metric tons a year of initial HALEU capacity.
• Domestic and allied enrichment: Orano’s planned USD 5 billion Project Ike in Oak Ridge and General Matter’s Paducah site add LEU and HALEU capacity.
• ISR and restart supply: Paladin’s Langer Heinrich produced 3.0 million pounds in 2026 and guides to 4.0-4.4 million for 2026; the Red Book identifies about 11,750 tU a year of idled capacity.
• Recycling and secondary supply: The May 2026 executive orders direct DOE to identify uranium and plutonium inventories that could be recycled into reactor fuel.
• Long-term contracting wave: Kazatomprom reported about 104 million pounds of long-term transactions in 2026, and replacement-rate contracting is still to come.
• By product and heap-leach recovery: Phosphate, rare-earth and low-grade projects add smaller, flexible volumes.
Global Uranium Market Segment Analysis:
Uranium Market by Product Type: Natural, Enriched, Depleted and Reprocessed Uranium
Natural uranium holds about 49% of 2026 value, covering U3O8 concentrate and natural uranium hexafluoride sold by miners and converters. Enriched uranium holds 45% and grows faster at an 8.6% CAGR as SWU prices rise and HALEU demand starts. Depleted uranium (3%) covers tails, shielding and re-enrichment feed, and reprocessed uranium (3%) is the fastest-growing type at a 9.5% CAGR from a small base.
Uranium Market by Uranium Grade: High-Grade, Medium-Grade and Low-Grade Ore
Low-grade ore, mostly ISR sandstone, open-pit and Olympic Dam-type deposits, supplies about 55% of 2026 value and grows fastest at an 8.3% CAGR. High-grade ore holds 28%, led by Canada’s Athabasca Basin, where Cameco reported 2026 output of 19.1 million pounds at Cigar Lake and 15.1 million pounds at McArthur River/Key Lake (100% basis). Medium-grade ore holds 17% with a 7.0% CAGR. High-grade output is the swing supply, but outages such as Key Lake’s 2026 shutdown show its operating risk.
Uranium Market by Mining Method: Open-Pit, Underground, ISR, Heap Leaching and Byproduct Recovery
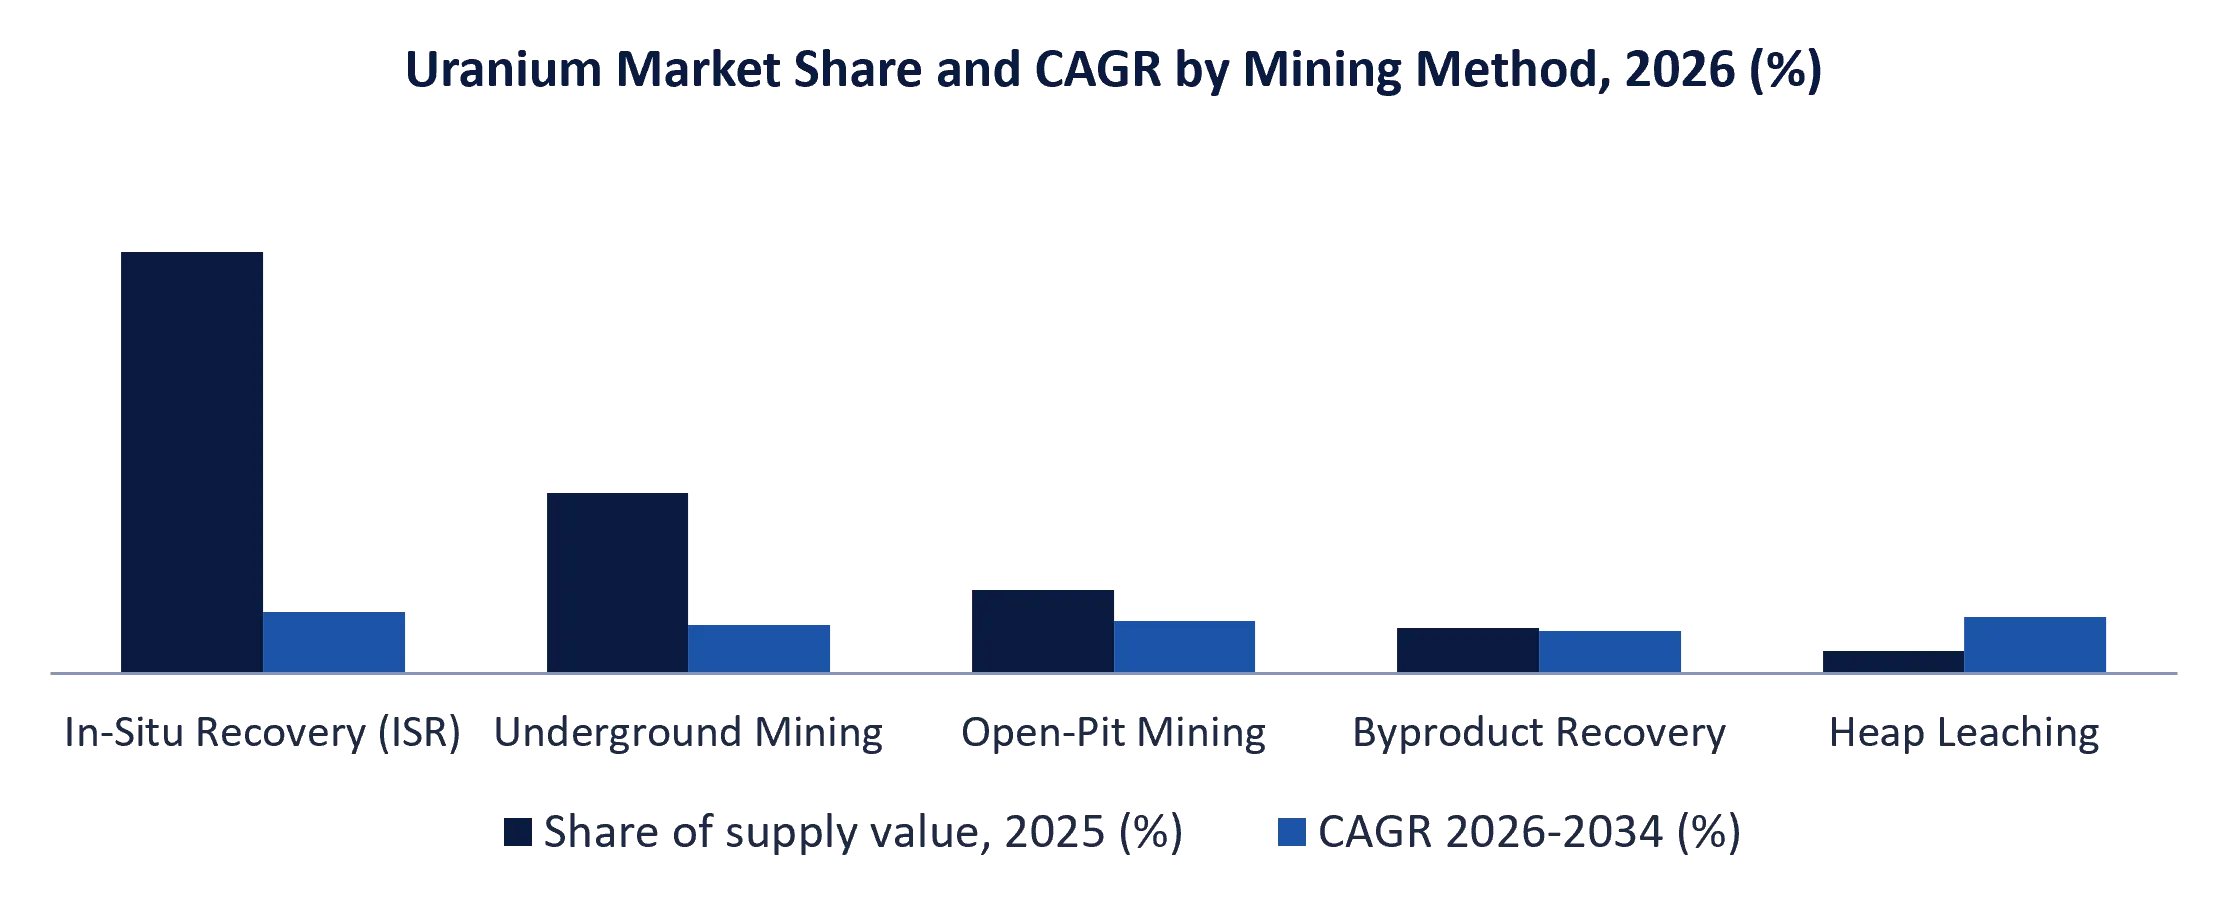
In-situ recovery (ISR) is the largest mining method at about 56% of 2026 supply value and grows fastest at an 8.1% CAGR, driven by Kazakhstan, where Kazatomprom reported 25,839 tU in 2026. Underground mining holds 24% (Canada’s Athabasca Basin), open-pit mining 11%, byproduct recovery 6% and heap leaching 3% (7.5% CAGR). MMR derives these shares from Red Book country data and Kazatomprom and Cameco output.
Uranium Market by Supply Source: Primary, Secondary, Reprocessed and Byproduct Supply
Primary mine supply holds about 82% of 2026 value and grows at 7.9%. Secondary supply (inventories, underfeeding, downblending and stockpiles) holds 9% and is the slowest-growing source at 4.8% as stocks are drawn down; the Red Book cites 5,000-6,000 tU a year by 2040 with limited visibility. Byproduct uranium holds 6%, and reprocessed uranium supply 3% with the fastest growth at 9.5%.
Uranium Market by Application: Commercial Power, SMRs, Research, Naval, Defense and Radioisotopes
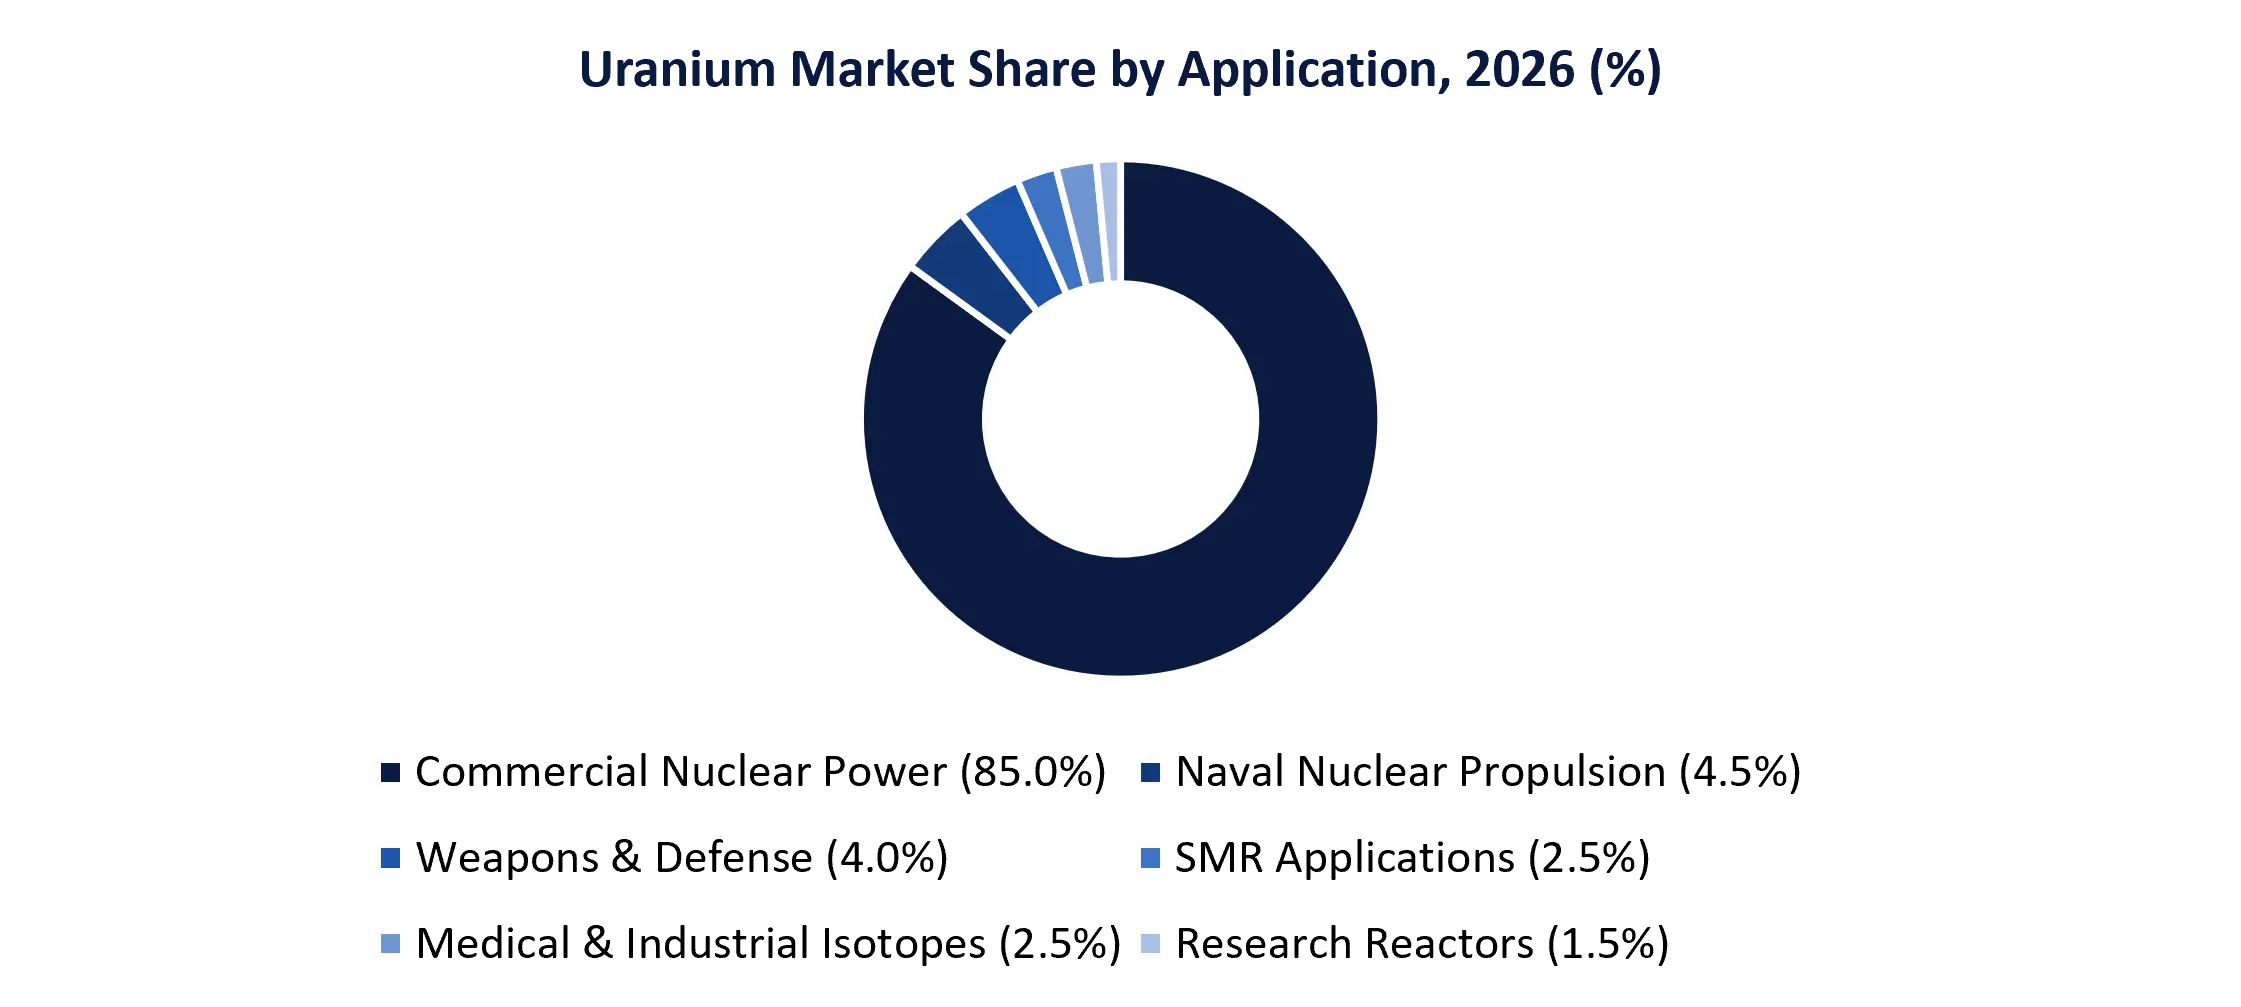
Commercial nuclear power generation dominates at about 85% of 2026 value and grows at 7.0%. SMR applications hold 2.5% but are the fastest-growing at a 24.0% CAGR, as the IAEA expects SMRs to take a larger share of new capacity. Naval nuclear propulsion holds 4.5%, nuclear weapons and defense applications 4.0%, medical and industrial radioisotope production 2.5% (8.8% CAGR) and research and experimental reactors 1.5%.
Uranium Market by End User: Utilities, Fuel Fabricators, Government, Research and Technology Developers
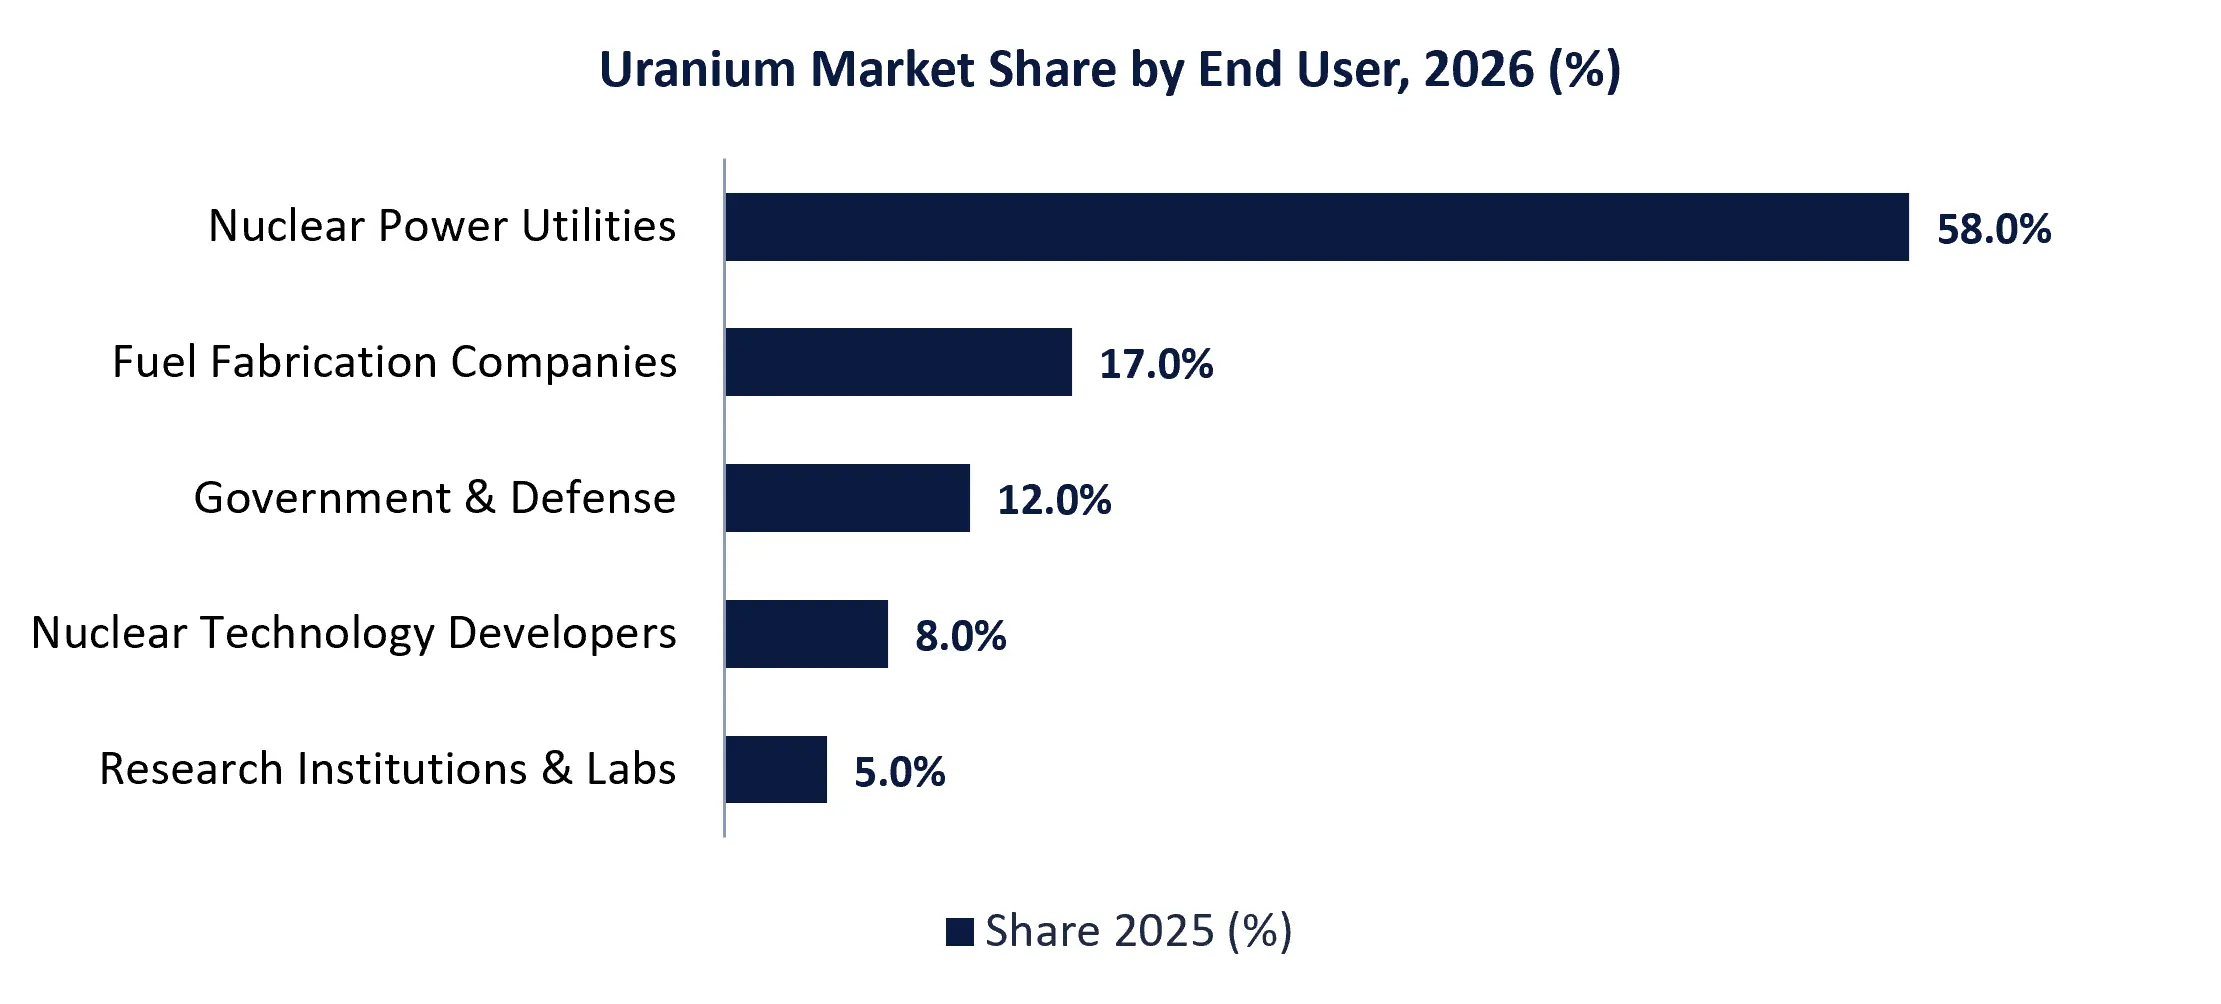
Nuclear power generation utilities lead at 58% of 2026 value, followed by nuclear fuel fabrication companies at 17% and government and defense organizations at 12%. Nuclear technology developers are the fastest-growing buyer group at a 12.4% CAGR as advanced-reactor projects secure fuel, while research institutions and laboratories hold 5%.
 Global Uranium Market Regional Analysis:
Asia Pacific is the largest region at about 35% of 2026 value and the fastest-growing at a 9.2% CAGR, led by China, India, Japan and South Korea, with Kazakhstan the dominant supplier; the Red Book expects East Asia to become the largest consuming region. North America holds 29%, anchored by the U.S. fleet of 94 reactors, EIA-reported purchases of 46.9 million pounds in 2026, DOE enrichment funding and Canadian production. Europe holds 27%, supported by Orano, Urenco and the Euratom framework. Middle East & Africa (5%) and Central & South America (4%) are smaller but growing with new national programs and producers such as Namibia.
Uranium Ecosystem: From Mine to Reactor Fuel
| Layer | What happens | Examples |
| 1. Exploration and mining | Uranium is explored, mined and milled into U3O8 concentrate | Kazatomprom, Cameco, Orano, Paladin Energy, NexGen Energy |
| 2. Conversion and enrichment | U3O8 is converted to UF6 and enriched to LEU or HALEU | Cameco, Orano, Urenco, Rosatom, Centrus Energy |
| 3. Fuel fabrication | Enriched UF6 becomes pellets, rods and assemblies | Westinghouse, Framatome, Global Nuclear Fuel, TVEL |
| 4. Utilities and reactor operators | Reactor owners contract, stock and burn fuel | U.S. civilian reactor owners, EDF, KEPCO, NPCIL (India) |
| 5. Government and standards | Policy, data, funding and safeguards | DOE, EIA, IAEA, NEA, U.S. NRC |
Uranium Companies and Competitive Landscape:
The global uranium market combines state-backed miners, integrated fuel-cycle groups, specialist enrichers, junior developers and fuel fabricators. Competition varies by step: Kazatomprom, Cameco and Orano dominate mined supply, Rosatom, Urenco, Orano and CNNC hold most enrichment capacity, and juniors compete on ISR restarts and new projects in the United States, Namibia and Canada.
Company disclosures show how buyers and sellers respond to tightness. Kazatomprom’s fourth-quarter 2026 update reported 25,839 tU of production (100% basis), a year-end long-term price of USD 86.50 per pound and a supply agreement with Kansai Electric Power signed on 22 December 2026. Cameco’s third-quarter 2026 report cited a long-term price of USD 96.50 per pound and said Westinghouse adjusted EBITDA attributable to Cameco rose 15% to C$143 million.
Competitive Strategies in the Uranium Market
• Value over volume: Kazatomprom cut 2026 nominal production levels by about 10% to 29,697 tU, tying output to market conditions.
• Integrated fuel-cycle exposure: Cameco combines mining, fuel services and its stake in Westinghouse to capture value beyond mined pounds.
• Enrichment build-out: Centrus at Piketon, Orano at Oak Ridge and General Matter at Paducah are using DOE funding to add U.S. capacity.
• Long-term contracting: Producers sign multi-year supply agreements with utilities, such as Kazatomprom’s deal with Kansai Electric.
• Brownfield restarts and ramp-ups: Paladin’s Langer Heinrich and Cameco’s McArthur River plans show how quickly proven assets can add pounds.
Uranium Standards and Regulation: Key Frameworks and Policy
• Prohibiting Russian Uranium Imports Act: restricts imports of Russian-origin enriched uranium, with DOE waivers possible through 2027.
• Executive Order 14302, Reinvigorating the Nuclear Industrial Base: signed 23 May 2026, it uses Defense Production Act authority to speed LEU and HALEU supply and sets 400 GW by 2050.
• DOE enrichment programs: LEU and HALEU task orders worth USD 2.7 billion, paid on milestones over ten years.
• EIA Uranium Marketing Annual Report: the annual survey of U.S. purchases, prices, inventories and enrichment services (Form EIA-858).
• NEA and IAEA Red Book: the biennial reference for resources, production and reactor requirements through 2050.
• IAEA safeguards and Euratom oversight: safeguards cover enrichment and highly enriched material, and the Euratom Supply Agency monitors EU fuel diversification.
Global Uranium Market Recent Developments
| Date | Development | Source |
| Jan 2026 | DOE awards USD 2.7 billion in LEU and HALEU enrichment task orders | U.S. Department of Energy |
| Feb 2026 | Kazatomprom reports 25,839 tU in 2026 and guides 27,500-29,000 tU for 2026 | Kazatomprom |
| 2026 | NEA and IAEA publish Uranium 2026 (Red Book): 64,500 tU needed in 2024, up to 143,900 tU by 2050 | OECD NEA / IAEA |
| Jul 2026 | EIA releases 2026 Uranium Marketing Annual Report: 46.9 million lb at USD 58.46/lb | U.S. EIA |
| Sep 2026 | IAEA raises high case to 1,045 GWe by 2050 and extends outlook to 2060 | IAEA |
| Sep 2026 | Cameco reports long-term price of USD 96.50/lb and spot USD 89.63/lb at 30 Sep | Cameco |
Global Uranium Market Scope:Inquire before buying
| Global Uranium Market | |||
|---|---|---|---|
| Report Coverage |
Details | ||
| Base Year: |
2026 | Forecast Period: |
2027-2034 |
| Historical Data: |
2020 to 2026 | Market Size in 2026: |
USD 25.80 Billion |
| Forecast Period 2027 to 2034 CAGR: |
7.4% | Market Size in 2034: |
USD 49.05 Billion |
| Uranium Market Segments Covered: | By Product Type | Natural Uranium Enriched Uranium Depleted Uranium Reprocessed Uranium |
|
| By Uranium Grade | High-Grade Uranium Ore Medium-Grade Uranium Ore Low-Grade Uranium Ore |
||
| By Mining Method | Open-Pit Mining Underground Mining In-Situ Recovery (ISR) Heap Leaching Byproduct Uranium Recovery |
||
| By Supply Source | Primary Uranium Supply Secondary Uranium Supply Reprocessed Uranium Supply Uranium Recovered as Byproduct |
||
| By Enrichment Level | Natural Uranium Low-Enriched Uranium (LEU) High-Assay Low-Enriched Uranium (HALEU) Highly Enriched Uranium (HEU) |
||
| By Application | Commercial Nuclear Power Generation Small Modular Reactor (SMR) Applications Research and Experimental Reactors Naval Nuclear Propulsion Nuclear Weapons and Defense Applications Medical and Industrial Radioisotope Production |
||
| By End User | Nuclear Power Generation Utilities Nuclear Fuel Fabrication Companies Government and Defense Organizations Research Institutions and Laboratories Nuclear Technology Developers |
||
Global Uranium Market, By Region:
North America (United States, Canada, and Mexico)
Europe (UK, France, Germany, Italy, Spain, Sweden, Austria, and the Rest of Europe)
Asia Pacific (China, South Korea, Japan, India, Australia, ASEAN, Indonesia, Philippines, Malaysia, Vietnam, Thailand, ASEAN, Rest of Asia Pacific)
Middle East & Africa (South Africa, GCC, Nigeria, Rest of ME&A)
South America (Brazil, Argentina, Rest of South America)
Global Uranium Market Key Players:
1. North America
• Cameco Corporation
• Centrus Energy Corp.
• Energy Fuels Inc.
• Uranium Energy Corp.
• enCore Energy Corp.
• Ur-Energy Inc.
• NexGen Energy Ltd.
• Denison Mines Corp.
• Westinghouse Electric Company
• Global Laser Enrichment
• General Matter, Inc.
2. Europe
• Orano SA
• Urenco Group
• Framatome
• Rosatom State Atomic Energy Corporation (TENEX, TVEL)
• Uranium One
3. Asia-Pacific
• Kazatomprom (National Atomic Company)
• China National Nuclear Corporation (CNNC)
• CGN Mining Co. Ltd.
• Paladin Energy Ltd
• BHP Group (Olympic Dam)
• Boss Energy Ltd
• Uranium Corporation of India Limited (UCIL)
• Nuclear Fuel Complex (India)
• Navoiyuran (Uzbekistan)
4. Middle East & Africa
• Rössing Uranium Limited
• Swakop Uranium (Husab Mine)
• Emirates Nuclear Energy Corporation (ENEC)
5. South America
• Indústrias Nucleares do Brasil (INB)
• Comisión Nacional de Energía Atómica (CNEA), Argentina
Uranium Market – Additional FAQs
1. How big is the uranium market?
Ans: MMR estimates the global uranium market at USD 25.80 Billion in 2026 and USD 49.05 Billion by 2034, a 7.4% CAGR over 2026-2034.
2. Which country produces the most uranium?
Ans: Kazakhstan is the largest producer. Kazatomprom alone reported 25,839 tU in 2026 on a 100% basis, and Canada, led by Cameco’s Cigar Lake and McArthur River, is the next largest source of mined uranium.
3. What is the uranium price today?
Ans: Cameco reported an average long-term price of USD 96.50 per pound U3O8 and a spot price of USD 89.63 per pound at 30 September 2026. U.S. reactor owners paid a lower weighted-average USD 58.46 per pound in 2026 because most volume is under older long-term contracts (EIA).
4. How much uranium does the world need?
Ans: The NEA and IAEA Red Book puts reactor-related requirements at about 64,500 tU in 2024 and between 84,800 tU and 143,900 tU by 2050, against 61,924 tU of mine output in 2024.
5. What is HALEU and why does it matter?
Ans: High-assay low-enriched uranium is enriched to between 5% and 20% U-235 and is needed by many advanced reactors and SMRs. DOE awarded USD 900 million each to Centrus’ American Centrifuge Operating and General Matter in January 2026 to build U.S. HALEU capacity.
6. How does the Russian uranium import restriction affect the market?
Ans: The Prohibiting Russian Uranium Imports Act restricts Russian-origin enriched uranium, with waivers possible through 2027. EIA data show foreign suppliers provided 77% of U.S. SWU purchases in 2026, which explains the push for new enrichment capacity.
7. Is there enough uranium to meet demand?
Ans: Identified resources recoverable below USD 260 per kgU exceed 8.1 million tonnes (Red Book), enough for projected demand through 2050, but the agencies warn that resources do not guarantee supply without investment in mines, conversion and enrichment.
8. Which mining method produces the most uranium?
Ans: In-situ recovery (ISR), the dominant method in Kazakhstan, supplies about 56% of 2026 value in MMR’s estimate, ahead of underground mining at 24% and open-pit mining at 11%.