
Power Generation Market Size by Type, Energy Source, End User, Region – Segment-Level Market Assessment, Growth Opportunity Analysis, Competitive Mapping & Forecast to 2032
Overview
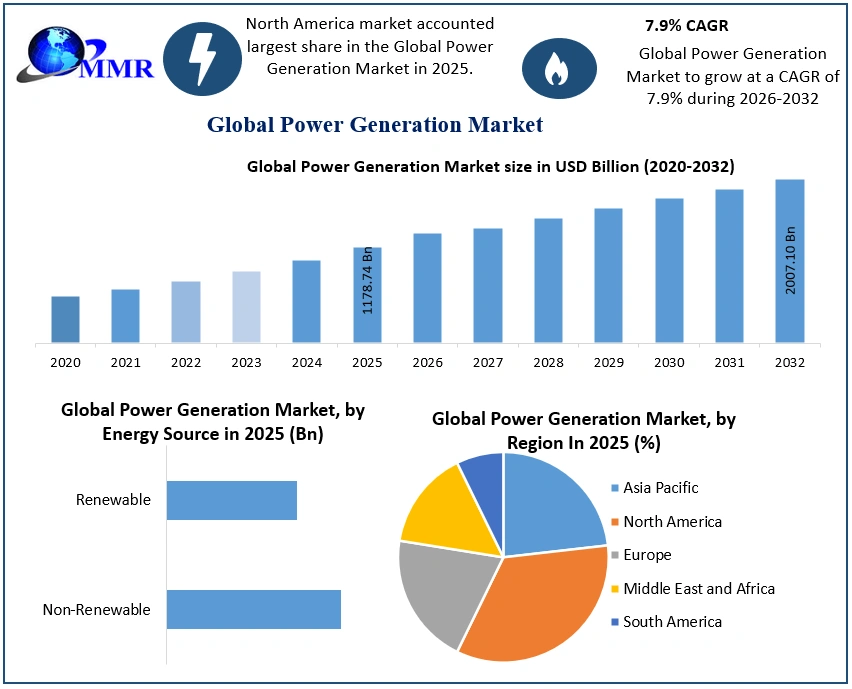
The Power Generation Market size was valued at USD 1178.74 Billion in 2025 and the total Power Generation revenue is expected to grow at a CAGR of 7.9% from 2025 to 2032, reaching nearly USD 2007.10 Billion by 2032.
Power Generation Market Overview:
Power is a critical element of infrastructure, serving as a foundation for economic growth and societal welfare. Adequate power infrastructure is essential for sustained economic development, allowing industries, businesses, and households to access reliable and affordable electricity. The power industry ensures universal access to power sustainably, fostering socio-economic progress while mitigating environmental impact.
Increasing global population and urbanization rise, resulting in surges in electricity demand and driving market growth. The Power Generation Market plays an essential role in energy generation, transmission, and distribution which includes diverse power generation sources, including fossil fuels, nuclear energy, and renewable energy, offering to countries' escalating energy demands. Siemens AG, ABB Ltd., Enel SpA and NextEra Energy, Inc. are the major key players contributing to advancements in the Power Generation Market. These companies play a significant role in driving innovation, technological developments, and industry growth.
 To know about the Research Methodology :- Request Free Sample Report
Power Generation Market Scope and Research Methodology
The Power Generation Market report is a withal representation of innovation, policy support, increased competition, and environmental concerns by global and local players holding Power Generation Market in different countries. The report covered Market structure by comparative analysis of key players, and market followers, which makes this report insightful to the Power Generation Market outlook.
The Power Generation Market report aims to outlook the market size based on segments, regional distribution and industry competition. The bottom-up approach has been used to estimate and forecast market size and market growth. The report provides a detailed examination of the key players in the Power industry, including revenue. The report covers the global, regional and local level analysis of the Power Generation Market with the factors restraining, driving and challenging the market growth during the forecast period.
Power Generation Market Dynamics:
Power Generation Market Drivers
Growing investment in infrastructure development and industrialization boosts the market growth
Increasing investment in infrastructure development and industrialization driving the market growth. Countries prioritize the expansion and upgrade of their infrastructure, including power infrastructure, as they strive for economic growth and development. For example, the Dubai Electricity and Water Authority (DEWA), has announced its intention to develop 4GW of renewable energy projects in collaboration with Independent Power Producers (IPPs).
A significant amount of investment is needed for infrastructure development projects such as power plants, transmission lines, substations, and distribution networks. As a result of these investments, various stakeholders in the Power Generation Market will have opportunities to grow their businesses. This includes power producers, equipment manufacturers, and service providers. These stakeholders can cater to the increasing demand for power infrastructure and related services. Additionally, industrialization plays a pivotal role in driving Power Generation Market growth. As countries industrialize and expand their manufacturing sectors, electricity consumption increases substantially. Industries rely on a stable and dependable power supply to support their operations, machinery, and processes. Consequently, the need for additional power generation capacity, as well as the need for efficient transmission and distribution systems, has risen sharply throughout the world.
Power Generation Market Restraint
Regulatory Challenges and policy uncertainties hinder the market growth
Policy uncertainties present significant constraints on Power Generation Market expansion. These constraints arise due to the complex and evolving nature of regulatory frameworks, as well as uncertainties surrounding government policies and regulations related to the power sector. Such challenges and uncertainties can impede the Power Generation Market's growth and development by creating obstacles. For instance, regulatory challenges and policy uncertainty are found in the dynamic landscape of renewable energy policies. Governments worldwide have implemented incentives and subsidies to encourage renewable energy to reduce fossil fuel dependencies. However, the policies and incentives change as per the region, and this lack of consistency and uniformity between regions are expected to hamper the growth of the market, Modifications to policies, such as reductions in subsidies or changes to feed-in tariffs, can impact the economic feasibility of renewable energy projects and cause hesitation and uncertainty in investment decisions.
Power Generation Market Segment Analysis:
based on Power Generation - Source, Wind energy is dominating the market in 2025 and is expected to continue its dominance during the forecast period which is driven by its clean and renewable nature, as well as its cost-effectiveness. Followed by Hydroelectric power generation, the energy of flowing water, making it a renewable and sustainable source. Nuclear energy has low greenhouse gas emissions and high-power output and continues to grow at a notable CAGR during the forecast period. Renewable energy sources, including solar, wind, and geothermal, are expected remarkable growth due to technological advancements and supportive policies. Thermal power and Fossil Fuel based power are also expected to have significant growth during the forecast period.
Power Generation Market, by Power Generation - Source (%) In 2025

Based on Power Infrastructure, Transmission lines dominated the Power Generation Market in 2025. As the development of transmission lines is important for delivering electricity from power plants to various regions. Followed by construction, operation, and expansion of power plants present significant market opportunities due to the rising global energy consumption. The demand for electricity continues to grow, requiring new power plants to meet this increasing need. Expansion and modernization of distribution networks are fast-growing segments during the forecast period, which connect transmission lines to end consumers and provide market opportunities.
Power Generation Market Regional Insights:
North America dominated the market in 2025 and is expected to maintain its dominant position during the forecast period. Several key players in the region play an active role in shaping the power landscape, including the United States and Canada. Asia Pacific's Power Generation Market is the largest and fastest-growing globally. The rapid urbanization, industrialization, and population growth in the region have led to a significant increase in electricity demand in recent years. China, India, and Southeast Asian nations drive this demand.
Europe leads the way in renewable energy and decarbonization efforts. Germany, the United Kingdom, and Denmark are a few of the countries that have made remarkable advances in the transition to renewable energy sources in recent years. Europe's Power Generation Market is driven by European Union policies and targets focusing on renewable energy, energy efficiency, and emission reduction. South America and the Middle East and Africa regions are expected to contribute to the Power Generation Market. This is thanks to emerging power plants and ongoing developments in their respective areas.
Competitive Landscape:
The global Market is highly competitive, with numerous key players operating at various stages of the power value chain. Major companies in the market include power utilities, independent power producers, equipment manufacturers, and service providers such as Tokyo Electric Power Company Holding Inc, NTPC Ltd, Electricite de France S.A., General Electric Company, and Siemens AG. As competition increased, regional transmission organizations (RTOs) and independent system operators (ISOs) were established to ensure fair and efficient operation of the power grid. These entities facilitated the integration of power producers, managed the transmission of electricity, and promoted competition in the wholesale Power Generation Market.
Power Generation Market Scope: Inquiry Before Buying
| Global Power Generation Market | |||
|---|---|---|---|
| Report Coverage | Details | ||
| Base Year: | 2025 | Forecast Period: | 2026-2032 |
| Historical Data: | 2020 to 2025 | Market Size in 2025: | USD 1178.74 Bn. |
| Forecast Period 2026 to 2032 CAGR: | 7.9% | Market Size in 2032: | USD 2007.10 Bn. |
| Segments Covered: | by Type | Hydroelectricity Fossil Fuel Electricity Nuclear Electricity Solar Electricity Wind Electricity Geothermal Electricity Biomass Electricity Other Electricity |
|
| by Energy Source | Non-Renewable Renewable |
||
| by End User | Residential Sector Commercial Sector Industrial Sector |
||
Power Generation Market, by Region
North America (United States, Canada and Mexico)
Europe (UK, France, Germany, Italy, Spain, Sweden, Austria, Turkey, Russia and Rest of Europe)
Asia Pacific (China, India, Japan, South Korea, Australia, ASEAN and Rest of APAC)
Middle East and Africa (South Africa, GCC, Egypt, Nigeria and Rest of ME&A)
South America (Brazil, Argentina, Columbia and Rest of South America)
Power Generation Market, Key Players are
1. ABB Ltd.
2. China Energy Investment Corporation Limited
3. Dominion Energy, Inc.
4. Duke Energy Corporation
5. E.ON SE
6. Electricite de France S.A.
7. Enel SpA
8. Engie SA
9. Exelon Corporation
10. General Electric Company
11. Iberdrola S.A.
12. Iberdrola, S.A.
13. National Grid plc
14. NextEra Energy, Inc.
15. NTPC Ltd
16. Ørsted A/S
17. Siemens AG
18. State Grid Corporation of China
19. Tokyo Electric Power Company Holding Inc
Frequently Asked Questions:
1] What segments are covered in the Global Market report?
Ans. The segments covered in the Market report are based on Power Generation - Type, Energy Source, End-User and Region.
2] Which region is expected to hold the highest share of the Global Market?
Ans. The North America region is expected to hold the highest share of the Market.
3] What is the market size of the Global Market by 2032?
Ans. The market size of the Market by 2032 is expected to reach USD 2007.10 Bn.
4] What is the forecast period for the Global Market?
Ans. The forecast period for the Market is 2026 - 2032.
5] What was the market size of the Global Market in 2025?
Ans. The market size of the Market in 2025 was valued at USD 1178.74 Bn.