Energy Drinks Market Size by Product Format, Nature, Distribution Channel, Packaging, Region, Industry-Wide Analysis, Competitive Landscape Assessment & Long-Term Forecast to 2032

8.23%
CAGR (2026-2032)
85.28 USD Bn.
Forecast Market Size
304
Report Pages
120
Market Tables

Overview

The Energy Drinks Market is a rapidly developing segment of the global functional beverage industry, including ready-to-drink Energy Drinks, energy shots, powders, and concentrates formulated to enhance alertness, energy, concentration, and physical performance. During 2026–2032, market growth is expected to be supported by changing lifestyles, growing demand from young adults, increasing functional beverage consumption, working professionals, athletes, fitness enthusiasts, and gamers, and expanding availability through convenience stores and e-commerce. The industry is increasingly shifting toward reduced-sugar, zero-sugar, natural, clean-label, and functionally enhanced formulations, while flavour innovation, premiumization, sports and gaming partnerships, digital marketing, and growth across emerging markets continue to create new growth opportunities.

According to Maximize Market Research (MMR), the Global Energy Drinks Market was valued at USD 85.28 Billion in 2025 and is expected to reach USD 148.34 Billion by 2032, growing at a CAGR of 8.23% during the forecast period (2026-2032). Growth is supported by increasing fitness awareness, expanding e-commerce and retail distribution, premiumization, and strong demand from young adults, professionals, athletes, and gamers.
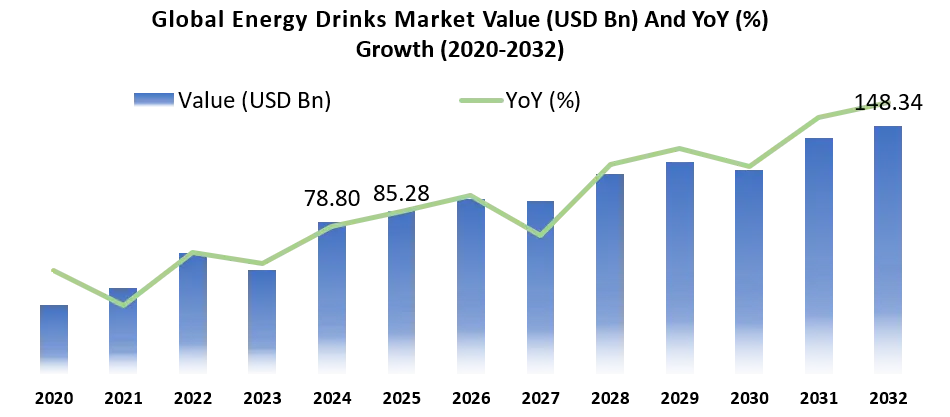
Energy Drinks Market YOY Growth
MMR report provides comprehensive insights into the Energy Drinks Market Value & Volume, Market Share, Growth Trends, Competitive Landscape, Pricing Analysis, Consumer Behaviour, Product Innovation, Investment Opportunities, and Regional Outlook, enabling manufacturers, beverage companies, investors, and distributors to identify emerging opportunities and formulate effective business strategies through 2032.

Market Investment Opportunities in the Energy Drinks Market

The Global Energy Drinks Market offers significant investment potential, driven by the rapid adoption of premium and functional beverages. Key investment areas include:

• Over 35% share expected for zero-sugar and low-calorie Energy Drinks in new product launches by 2032.
• 40% of incremental market growth is projected to originate from Asia-Pacific through 2032.
• 15% of global Energy Drinks sales are expected to be generated through online retail channels by 2032.
• 5 major investment themes include natural ingredients, sustainable packaging, digital commerce, premium product innovation, and manufacturing capacity expansion.
• 3 high-growth consumer segments—fitness enthusiasts, gamers, and young professionals—are expected to drive future demand and premium product adoption.

Energy Drinks Market Growth Outlook
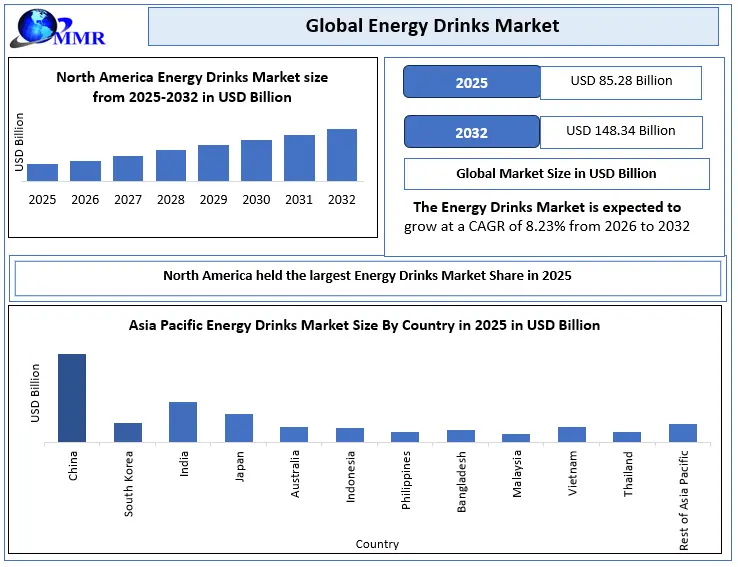
Energy Drinks Market Growth Outlook

To know about the Research Methodology :- Request Free Sample Report

Established Players vs. New Entrants in the Energy Drinks Market

Parameter Established Players New / Emerging Entrants
Representative Brands Red Bull, Monster Energy, Rockstar, 5-hour Energy, Lucozade PRIME Energy, C4 Energy, GHOST Energy, ZOA Energy, G FUEL
Market Position Strong market leadership and established customer base Challenger brands targeting high-growth niches
Distribution Reach Extensive global retail and on-trade presence Growing retail, convenience and e-commerce penetration
Product Strategy Broad portfolios, flavour extensions and zero-sugar variants Functional, fitness, wellness and differentiated formulations
Target Consumers Broad mass-market consumers Gen Z, fitness, gaming and lifestyle consumers
Competitive Strength Brand equity, scale, distribution and shelf presence Innovation, digital-first marketing and strong consumer engagement

Energy Drinks Market Dynamics:

Key Trends Shaping the Global Energy Drinks Market, 2025 & Beyond

• Accelerating Shift Toward Zero-Sugar & Low-Sugar Energy Drinks: Health consciousness and weight-management priorities are driving strong demand for zero- and reduced-sugar formulations.
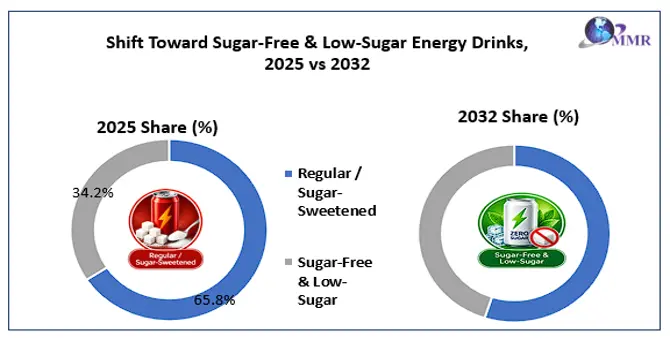
Energy Drinks Market Key Trends

• Natural, Plant-Based & Clean-Label Energy Formulations: Increasing preference for botanical extracts, matcha, green tea, yerba mate, adaptogens, and naturally sourced ingredients.
• Functional Energy Drinks Moving Beyond Caffeine: Brands are combining energy with stamina, hydration, focus, recovery, and cognitive-performance benefits.
• Nootropics & Cognitive-Performance Ingredients Gaining Momentum: L-theanine, citicoline, B vitamins, ginseng, and L-tyrosine are increasingly being combined to support focus, concentration, and mental energy.
• Energy Drinks Converging with Sports Nutrition and Hydration: Growing incorporation of electrolytes, BCAAs, creatine, and performance ingredients is growing Energy Drinks into fitness, sports performance, and recovery occasions.

Indicator 2026 Statistic
U.S. Sports & Performance Drinks Market xx
Global Sports Drinks Market xx
U.S. Hydration Powder Market xx
Sports Drinks Share of India Sports Nutrition Market xx
Isotonic Share of India Sports Drinks Market 45.20%

Energy Drinks Market Drivers:

Rapid Urbanization, Busy Lifestyles & Rising Need for Convenient Energy Solutions

Growing urbanization, longer working and commuting hours, shift-based employment, demanding study schedules, and increasingly fast-paced lifestyles are strengthening demand for convenient, ready-to-consume energy beverages.
Consumers are increasingly seeking quick solutions for concentration, energy, alertness, and fatigue management, while the portability and immediate consumption of Energy Drinks make them suitable for workplaces, travel, and other on-the-go occasions. This structural shift in daily consumption patterns is expected to support Energy Drinks market growth through 2032.

Expanding Retail Availability & Distribution Network

Increasing penetration across convenience stores, gyms, supermarkets, foodservice outlets, vending channels, and online platforms is making Energy Drinks more accessible and growing consumption occasions. Growth of retail infrastructure, particularly across emerging economies in APAC, South America, and the Middle East & Africa, is expected to support further Energy Drinks market penetration by 2032.

Challenges in the Energy Drinks Market:

Key Challenge Impact on Market
Health Concerns Around High Caffeine & Sugar Intake Concerns over sleep disruption, cardiovascular effects and high sugar consumption can restrict consumption and rise public-health scrutiny.
Growing Regulatory Scrutiny & Compliance Requirements Caffeine limits, warning labels, ingredient rules and functional-claim requirements increase compliance complexity and reformulation costs.
Restrictions on Marketing & Sales to Younger Consumers Growing restrictions around youth advertising and sales can limit access to an important consumer demographic.
Sugar Taxes & Pricing Pressure Sugar-related taxation can increase retail prices and put pressure on margins while encouraging reformulation.
Competition from Alternative Functional Beverages Sports drinks, functional waters, hydration products, coffee and nootropic beverages provide consumers with alternative sources of energy and functionality.

Global Energy Drinks Demand & Consumption by Region, 2026

In 2026, global Energy Drinks Market demand remains focussed in North America, Europe, and Asia Pacific, which together account for an expected 89% of global demand. North America leads with nearly XX.23% share, supported by high consumption frequency, strong retail penetration, and established energy-drink consumption habits, followed by Europe at XX.5% and Asia Pacific at XX.5%.
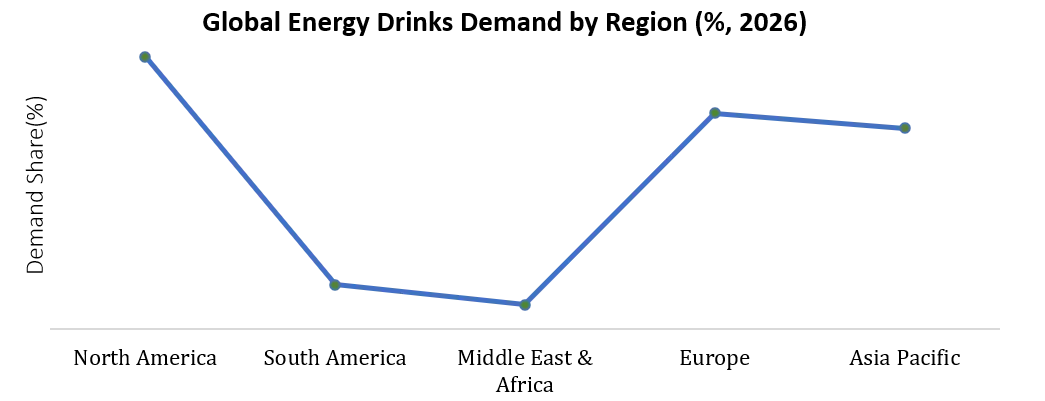
Energy Drinks Market by Region
Asia Pacific is expected to record the strongest demand growth, supported by urbanization, a rising disposable income, growing young consumer population, and increasing retail availability. South America and the Middle east and Africa collectively represent around 9% of demand but offer significant long-term growth potential as product availability and consumer awareness increase.

Energy Drinks Market Segment Insight

Ready-to-Drink Energy Drinks dominated the Energy Drinks Market by Product Format in 2025 Owing to:

• Strong On-the-Go Consumption – High demand from professionals, students, fitness consumers, gamers, and active consumers.

• High Convenience & Portability – RTD Energy Drinks provide immediate consumption without mixing or preparation.

• Extensive Retail Availability – Strong presence across convenience stores, supermarkets, vending machines, fuel stations, gyms, and online channels.

• Wide Product Variety – Extensive availability of low-calorie, regular, zero-sugar, natural, and functional formulations.

• Strong Impulse-Purchase Demand – Single-serve bottles and packaging formats encourage immediate consumption and frequent purchases.

• High Consumer Familiarity – RTD remains the most established and widely recognized Energy Drinks format compared with powders, shots, and concentrates.
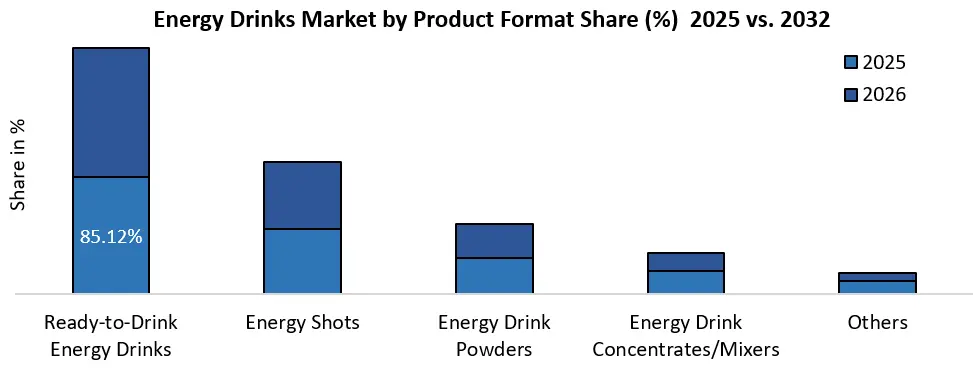
Energy Drinks Market by Product Format
In 2025, Non-Alcoholic Energy Drinks Dominated the Energy Drinks Market by Category:

• Broader Consumer Base – Non-alcoholic Energy Drinks serve students, athletes, professionals, gamers, a fitness consumer, and other adult consumers.

• Many Consumption Occasions – Strong consumption across work, travel, study, sports, gaming, fitness, and social occasions.

• Wide Retail Availability – Wide distribution through convenience stores, supermarkets, fuel stations, vending machines, gyms, and online retail.

• Fewer Consumption Restrictions – Unlike alcoholic Energy Drinks, non-alcoholic variants face fewer age-, venue-, and occasion-related limitations.

• Strong Product Innovation – Zero-sugar, natural caffeine, low-calorie, hydration, functional, and performance-focused formulations expand consumer choice.

• High Purchase Frequency – Everyday energy and alertness needs support more frequent consumption compared with alcoholic Energy Drinks.
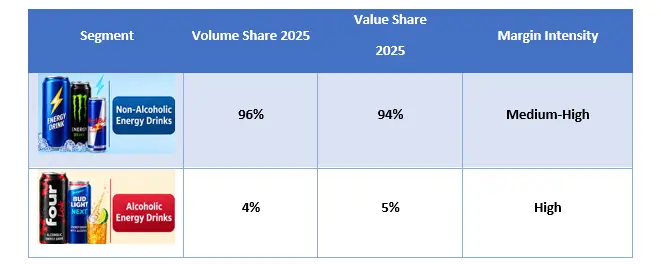
Energy Drinks Market by Category
Regional Insight in Energy Drinks Market:

North America Energy Drinks Market – Revenue Leader

• 37.34% global revenue share in 2025
• Largest regional Energy Drinks Market
• High consumption supported by fast-paced lifestyles
• Strong demand for functional and convenient beverages
• Market demand increasingly driven by:

o Health & wellness consciousness
o Natural & organic formulations
o Vitamins & minerals
o Functional ingredients

Asia Pacific – Growth Engine

• Fastest CAGR: 9.15% during 2026–2032
• Large young consumer population
• Strong demand among students & early-career professionals
• Rapid growth of:

o Fitness culture
o Nightlife consumption
o Gaming & esports
o Sugar-free & functional variants
o Localized flavours


Europe – Health & Regulatory Transition

• Strong established Energy Drinks consumption base
• Growing focus on sugar reduction and responsible caffeine consumption
• Increasing preference for zero-sugar and lower-calorie variants
• Demand increasingly influenced by:

o Health-conscious purchasing
o Clean-label formulations
o Functional ingredients
o Regulatory scrutiny

Country wise Insight in Energy Drinks Market:

Country Key Developments Growth Opportunities
United States Strong shift toward zero-sugar, functional and performance-oriented Energy Drinks Functional formulations, fitness-focused products, D2C and premium Energy Drinks
Canada Increasing preference for low-sugar, natural and clean-label beverages Natural caffeine, organic formulations and functional energy products
United Kingdom Sugar reduction and health-conscious product reformulation gaining importance Zero-sugar, low-calorie and natural energy formulations
Germany Strong retail penetration and increasing functional beverage innovation Premium, organic and performance-focused Energy Drinks
France Growing consumer focus on natural ingredients and reduced sugar Plant-based caffeine and clean-label energy beverages

Competitive Landscape: Energy Drinks Market

The Energy Drinks Market is highly competitive, with established players such as PepsiCo Inc., Monster Energy Company, and Red Bull GmbH leading the market owing to their extensive product portfolios, strong brand recognition, and global distribution networks. These companies focus on innovation, particularly through the development of smart

Recent Developments in Energy Drinks Market

Company Date Key Development Strategic Significance
HELL ENERGY Sep-25 Launched BLACK CHERRY premium Energy Drinks in India with black cherry flavour, B-vitamins and no added preservatives; rollout across general trade, modern retail and quick-commerce in major cities Strengthens India portfolio, targets Gen Z and Millennials, and expands premium/flavour-led positioning
Grupo Jumex & AriZona Beverages Oct-25 Expanded their partnership with the launch of Jumex Energy, featuring energy beverages formulated with fruit nectar blends Supports convergence of energy and fruit beverages and broadens functional beverage portfolio
Monster Energy Nov-25 Introduced Ultra Wild Passion, a zero-sugar Energy Drinks featuring passionfruit and citrus flavour notes Strengthens zero-sugar portfolio and addresses demand for innovative, fruit-forward flavours

Leading companies in Energy Drinks market were focusing on R&D to innovate new products or improve existing ones. This could involve developing Energy Drinks derivatives with enhanced properties or applications to cater to specific industry needs.

Global Energy Drinks Market Scope: Inquire before buying

Global Market
Report Coverage Details
Base Year: 2025 Forecast Period: 2026-2032
Historical Data: 2020 to 2025 Market Size in 2025: USD 85.28 Bn.
Forecast Period 2026 to 2032 CAGR: 8.23% Market Size in 2032: USD 148.34 Bn.
Segments Covered: by Product Format Ready-to-Drink Energy Drinks
Energy Shots
Energy Drinks Powders
Energy Drinks Concentrates/Mixers
Others
by Category Non-Alcoholic Energy Drinks
Alcoholic Energy Drinks
by Nature Conventional Energy Drinks
Organic/Natural Energy Drinks
by Sugar Content Regular/Sugar-Sweetened
Sugar-Free/Zero-Sugar
by Flavour Unflavoured
Flavoured
Citrus
Berry
Tropical Fruit
Cola
Mixed Fruit
Others
by Packaging Type Cans
Bottles
Others
by Pack Size Below 200 ml
200–500 ml
Above 500 ml
by Distribution Channel Off-Trade
 Supermarkets & Hypermarkets
 Convenience Stores
 Specialty Stores
 Independent Retailers
 Online Retail
 Others
On-Trade
 Bars & Nightclubs
 Restaurants & Cafés
 Hotels
 Others
by Consumer Group Teenagers
Young Adults
Adults

Energy Drinks Market by Region

North America (United States, Canada and Mexico)
Europe (United Kingdom, France, Germany, Italy, Spain, Sweden, Russia and the Rest of Europe)
Asia Pacific (China, South Korea, Japan, India, Australia, Indonesia, Malaysia, Philippines, Thailand, Vietnam and the Rest of the Asia Pacific)
Middle East and Africa (MEA) (South Africa, GCC, Nigeria and the Rest of MEA)
South America (Brazil, Argentina, Colombia, Chile and the Rest of South America)

Energy Drinks Market Key Players

North America
1. Monster Energy Company
2. PepsiCo Inc. (Rockstar Energy)
3. Celsius Holdings Inc.
4. Keurig Dr Pepper Inc. (Ghost Energy)
5. Living Essentials LLC (5-hour Energy)
6. Congo Brands (Prime Energy)
7. Vital Pharmaceuticals Inc. (Bang Energy)
8. Nutrabolt (C4 Energy)
9. Jones Soda Co.
10. ZOA Energy LLC
11. Aspire Brands Inc.
12. Red Bull North America

Europe
13. Red Bull GmbH
14. Hell Energy Magyarország Kft.
15. Oshee Polska Sp. z o.o.
16. Carabao Europe Ltd.
17. Tenzing Natural Energy
18. Lucozade Ribena Suntory
19. BOOST Drinks Ltd.
20. Black Energy Drinks
21. Effect Energy Drinks
22. Crazy Wolf Energy

Asia-Pacific
23. Suntory Holdings Limited
24. Otsuka Pharmaceutical Co., Ltd.
25. Taisho Pharmaceutical Co., Ltd.
26. Eastroc Beverage Group
27. Hangzhou Wahaha Group
28. Nongfu Spring Co., Ltd.
29. TC Pharmaceutical Industries Co., Ltd. (Krating Daeng)
30. Carabao Group Public Company Limited
31. Amrutanjan Health Care Ltd.
32. Hector Beverages Pvt. Ltd. (Tzinga)
33. Reliance Consumer Products Ltd. (Campa Energy)
34. Asahi Group Holdings, Ltd.

Middle East & Africa
35. Power Horse Energy Drinks GmbH
36. XXL Energy Drinks
37. Wild Tiger Energy Drinks
38. Dubai Refreshments PJSC
39. Aujan Coca-Cola Beverages Company
40. Al Rabie Saudi Foods Co. Ltd.
41. National Beverage Company
42. Masafi Co. LLC

South America
43. Ambev S.A.
44. Grupo Petrópolis (TNT Energy Drinks)
45. Bebidas Fruki S.A.
46. AJE Group
47. Quala Group (Vive 100)
48. Ajegroup Brasil
49. Refres Now S.A.
50. Bebidas Bolivianas BBO S.A.
Others

Frequently Asked Questions:

1] What segments are covered in the Energy Drinks Market report?
Ans. The segments covered in the Energy Drinks Market report are based on Product Format, Category, Nature, Sugar Content, Flavour, Packaging Type, Pack Size Distribution Channel, Consumer Group and region.

2] Which region is expected to hold the highest share of the Energy Drinks Market?
Ans. The North America region is expected to hold the highest share of the Energy Drinks Market.

3] What is the market size of the Energy Drinks Market by 2032?
Ans. The market size of the Energy Drinks Market by 2032 is USD 148.34 Bn.

4] What is the growth rate of the Energy Drinks Market?
Ans. The Global Energy Drinks Market is growing at a CAGR of 8.23% during the forecasting period 2026-2032.

5] What was the market size of the Energy Drinks Market in 2025?
Ans. The market size of the Energy Drinks Market in 2025 was USD 85.28 Bn.

Table of Contents

A1. Executive Market Landscape and Industry Overview 1.1 Global Energy Drinks Market Size Valuation and Forecast Analysis (Value in USD Billion & Volume in Liters), 2025–2032 1.2 Historical Evolution of the Global Energy Drinks Industry and Consumer Lifestyle Transformation (2020–2025) 1.3 Current Global Market Structure, Brand Landscape, and Industry Maturity Assessment 1.4 Key Growth Drivers Accelerating Global Energy Drinks Consumption Across Consumer Segments 1.5 Major Industry Challenges Affecting Product Innovation, Consumer Perception, and Market Expansion 1.6 Emerging Growth Opportunities Across Functional, Natural, and Premium Energy Drinks Categories 1.7 Strategic Long-Term Market Outlook Supporting Industry Expansion Through 2032 A2. Global Energy Drinks Market Dynamics & Strategic Predictive Frameworks 2.1 Global Energy Drinks Market Trends 2.2 Global Energy Drinks Market DROC Framework Analysis 2.2.1 Drivers 2.2.2 Restraints 2.2.3 Opportunities 2.2.4 Challenges 2.3 PORTER'S Five Forces Analytical Framework 2.3.1 Supplier Power (Ingredient Suppliers, Flavour Manufacturers, Packaging Companies, Beverage Co-packers) 2.3.2 Buyer Power (Retail Chains, Convenience Stores, Online Retailers, Foodservice Operators) 2.3.3 Threat of New Entrants (Private Labels, Functional Beverage Startups, Sports Nutrition Brands) 2.3.4 Threat of Substitutes (Coffee, Tea, Sports Drinks, Functional Water, Carbonated Soft Drinks) 2.3.5 Competitive Rivalry Among Global Energy Drinks Manufacturers 2.4 PESTLE Macroeconomic Influence Grid Analysis (Political, Economic, Social, Technological, Legal and Environmental Indicators) A3. Global Macroeconomic Assessment and Beverage Industry Outlook 3.1 Assessment of Global Economic Indicators Influencing Energy Drinks Consumption Patterns 3.2 Comparative Analysis of Disposable Income, Urbanization, and Consumer Spending Trends 3.3 Evaluation of Inflation, Commodity Prices, and Manufacturing Cost Movements 3.4 Assessment of Retail Beverage Industry Performance Across Major Economies 3.5 Analysis of Sports Participation, Fitness Culture, and Lifestyle Changes Supporting Market Growth 3.6 Future Macroeconomic Outlook Driving the Global Energy Drinks Industry A4. Manufacturing Process and Production Intelligence Assessment 4.1 End-to-End Energy Drinks Manufacturing Process Assessment from Ingredient Preparation to Final Packaging 4.2 Beverage Processing Workflow and Manufacturing Efficiency Assessment Across Global Production Facilities 4.3 Manufacturing Automation and Smart Production Technology Adoption Assessment 4.4 Product Quality Assurance, Food Safety Systems, and Manufacturing Compliance Assessment 4.5 Manufacturing Process Optimization Supporting Operational Excellence 4.6 Future Manufacturing Innovation Supporting Beverage Production A5. Ingredient Composition, Product Formulation, and Innovation Assessment 5.1 Comparative Assessment of Caffeine, Taurine, Guarana, B-Vitamins, Electrolytes, Botanical Extracts, and Functional Ingredients 5.2 Comparative Analysis of Ingredient Formulation Strategies Supporting Performance, Hydration, Recovery, and Cognitive Wellness 5.3 Clean Label, Natural Ingredient, and Sugar Reduction Formulation Assessment 5.4 Flavour Innovation and Ingredient Customization Trends Across Global Markets 5.5 Functional Ingredient Development Supporting Health-Oriented Beverage Innovation 5.6 Future Ingredient Innovation Roadmap Supporting Market Development A6. Industry Ecosystem and Value Chain Assessment 6.1 Global Energy Drinks Industry Ecosystem Assessment from Raw Material Suppliers to End Consumers 6.2 Upstream Assessment Covering Ingredient Manufacturers, Sweetener Producers, Flavour Houses, and Packaging Suppliers 6.3 Midstream Assessment Across Beverage Manufacturers, Contract Packers, and Brand Owners 6.4 Downstream Ecosystem Assessment Covering Distribution Partners, Retail Ecosystem, and End Consumers 6.5 Value Creation Assessment Across the Global Energy Drinks Industry 6.6 Stakeholder Dependency Analysis Across the Beverage Value Chain A7. Demand & Supply Chain and Procurement Intelligence 7.1 Global Supply Chain Structure Supporting Energy Drinks Manufacturing Operations 7.2 Tier-1, Tier-2, and Tier-3 Supplier Ecosystem Assessment 7.3 Procurement Strategy Analysis for Ingredients, Packaging Materials, and Beverage Additives 7.4 Inventory Management and Supply Continuity Assessment Across Global Markets 7.5 Supply Chain Risk Analysis Covering Raw Material Availability and Logistics Challenges 7.6 Future Supply Chain Optimization Strategies Supporting Industry Growth A8. Consumer Demographic and Age-wise Consumption Assessment 8.1 Comparative Assessment of Energy Drinks Consumption Across Different Age Groups and Consumer Demographics 8.2 Age-wise Consumption Pattern Analysis Across Teenagers, Young Adults, Adults, and Senior Consumers 8.3 Consumer Preference Assessment Based on Gender, Occupation, Fitness Lifestyle, and Gaming Communities 8.4 Consumption Frequency and Usage Occasion Analysis Across Major Consumer Groups 8.5 Lifestyle and Behavioural Factors Influencing Energy Drinks Purchasing Decisions 8.6 Future Demographic Trends Supporting Global Market Expansion A9. Country-wise Adoption Analysis (2025) 9.1 Comparative Assessment of Energy Drinks Adoption Across Major Global Markets (2025) 9.2 Country-wise Per Capita Energy Drinks Consumption Analysis (2025) 9.3 Country-wise Brand Acceptance and Consumer Preference Assessment (2025) 9.4 Comparative Assessment of Market Maturity Across Developed and Emerging Countries (2025) 9.5 Country Competitiveness Assessment Based on Consumption, Distribution Infrastructure, and Brand Presence 9.6 Future Country-Level Adoption Outlook Supporting Market Growth A10. Regulatory Framework, Health Guidelines, and Age Restriction Assessment 10.1 Comparative Assessment of Global Food Safety Regulations Governing Energy Drinks 10.2 Country-wise Assessment of Age Restrictions and Sales Regulations for Energy Drinks 10.3 Comparative Analysis of Caffeine Limits, Ingredient Standards, and Nutritional Labelling Requirements 10.4 Government Regulations on Marketing and Advertising Energy Drinks to Children and Adolescents 10.5 Comparative Assessment of Product Registration and Regulatory Compliance Across Global Markets 10.6 Future Regulatory Developments Influencing the Global Energy Drinks Industry A11. Government Policy Impact and Beverage Industry Development Assessment 11.1 Assessment of Government Policies Supporting Functional Beverage Manufacturing and Market Expansion 11.2 Comparative Analysis of National Food Safety Policies Influencing Energy Drinks Production and Sales 11.3 Evaluation of Sugar Taxation Policies and Public Health Initiatives Affecting Energy Drinks Consumption 11.4 Assessment of Government Programs Promoting Responsible Caffeine Consumption and Consumer Awareness 11.5 Comparative Analysis of Import, Export, and Foreign Investment Policies Supporting Beverage Industry Development 11.6 Future Government Policy Outlook Influencing the Global Energy Drinks Market A12. Product Portfolio, Packaging, and Market Segmentation Assessment 12.1 Comparative Assessment of Ready-to-Drink Energy Drinks, Energy Shots, Powder Mixes, and Functional Beverage Formats 12.2 Market Segmentation Analysis Across Conventional, Sugar-Free, Organic, Functional, and Premium Product Categories 12.3 Packaging Format Assessment Across Cans, PET Bottles, Glass Bottles, and Multi-Pack Formats 12.4 Product Positioning Assessment Across Sports, Lifestyle, Gaming, Wellness, and Performance Nutrition Categories 12.5 New Product Launch and Portfolio Diversification Assessment Across Global Markets 12.6 Future Product Portfolio Evolution Supporting Industry Growth A13. Pricing Structure, Cost Composition, and Commercial Margin Assessment (2020–2025) 13.1 Historical Energy Drinks Pricing Trend Analysis Across Global Markets (2020–2025) 13.2 Comparative Assessment of Ingredient, Packaging, Manufacturing, and Logistics Cost Structures 13.3 Comparative Retail Pricing Assessment Across Premium, Mid-Range, and Economy Product Categories 13.4 Regional Price Competitiveness Assessment Across Major Beverage Markets 13.5 Value Chain Margin Distribution Across Manufacturers, Distributors, and Retailers 13.6 Future Pricing Outlook Supporting Global Market Competitiveness A14. Global Trade Flow, Import–Export, and International Logistics Assessment (2025) 14.1 Comparative Assessment of Global Import–Export Trade Flow for Energy Drinks 14.2 Regional Export Competitiveness Assessment Across Major Beverage Manufacturing Countries 14.3 International Logistics Infrastructure Assessment Supporting Cross-Border Beverage Distribution 14.4 Customs Regulations and International Trade Compliance Assessment 14.5 Trade Barrier Analysis Influencing Global Energy Drinks Market Expansion 14.6 Future International Trade Outlook Supporting Global Industry Growth A15. Distribution Channel and Retail Landscape Assessment 15.1 Comparative Assessment of Distribution Channels Across Supermarkets, Hypermarkets, Convenience Stores, Online Retail, Gyms, Foodservice, and Vending Machines 15.2 Channel-wise Sales Contribution Assessment Across Organized Retail, Traditional Trade, and Digital Commerce 15.3 Retail Expansion Strategy Assessment Across Modern Trade and E-commerce Platforms 15.4 Distribution Network Optimization Supporting Global Consumer Accessibility 15.5 Retail Partnership Assessment Across Convenience Chains and Foodservice Operators 15.6 Future Distribution Channel Evolution Supporting Market Growth A16. Substitute Products and Cross-Category Competitive Assessment 16.1 Comparative Assessment of Energy Drinks Against Coffee, Sports Drinks, Functional Beverages, Soft Drinks, and Ready-to-Drink Tea & Coffee 16.2 Consumer Preference Analysis Across Substitute Beverage Categories Based on Occasion, Functionality, and Lifestyle 16.3 Comparative Nutritional Assessment Covering Caffeine, Sugar, Functional Ingredients, and Caloric Content 16.4 Price Competitiveness Analysis Between Energy Drinks and Substitute Beverage Categories 16.5 Market Share Shift Analysis Driven by Consumer Switching Behavior Across Beverage Categories 16.6 Future Competitive Outlook of Substitute Products Influencing Global Energy Drinks Market Growth A17. Sustainability, ESG, and Consumer Health Assessment 17.1 Comparative Assessment of Sustainable Packaging Solutions Across the Global Energy Drinks Industry 17.2 Carbon Footprint Assessment Across Beverage Manufacturing and Distribution Operations 17.3 Aluminium Can Recycling, Plastic Reduction, and Circular Packaging Assessment 17.4 ESG Performance Benchmarking Across Leading Energy Drinks Manufacturers 17.5 Consumer Health Perception Assessment Regarding Caffeine Intake, Sugar Content, and Functional Ingredients 17.6 Future Sustainability and Health-Conscious Consumption Outlook A18. Strategic Investment Opportunity and Commercial Feasibility Assessment 18.1 Comparative Assessment of Regional Investment Attractiveness Across the Global Energy Drinks Market 18.2 Commercial Feasibility Assessment for New Manufacturing Facilities and Brand Expansion Projects 18.3 Investment Trends Supporting Functional Ingredients, Clean Label Products, and Sustainable Packaging Technologies 18.4 Strategic Partnership, Merger, Acquisition, and Brand Collaboration Assessment Across the Beverage Industry 18.5 Return on Investment Assessment Supporting Global Business Expansion 18.6 Long-Term Strategic Investment Outlook Through 2032 A19. Global Energy Drinks Market: Market Size and Forecast by Segmentation (by Value USD Million and Volume in Liters) (2025–2032) 19.1 Global Energy Drinks Market Size and Forecast, by Product Format 19.1.1 Ready-to-Drink Energy Drinks 19.1.2 Energy Shots 19.1.3 Energy Drinks Powders 19.1.4 Energy Drinks Concentrates/Mixers 19.1.5 Others 19.2 Global Energy Drinks Market Size and Forecast, By Category 19.2.1 Non-Alcoholic Energy Drinks 19.2.2 Alcoholic Energy Drinks 19.3 Global Energy Drinks Market Size and Forecast, By Nature 19.3.1 Conventional Energy Drinks 19.3.2 Organic/Natural Energy Drinks 19.4 Global Energy Drinks Market Size and Forecast, By Sugar Content 19.4.1 Regular/Sugar-Sweetened 19.4.2 Sugar-Free/Zero-Sugar 19.5 Global Energy Drinks Market Size and Forecast, By Flavour 19.5.1 Unflavoured 19.5.2 Flavoured 19.5.2.1 Citrus 19.5.2.2 Berry 19.5.2.3 Tropical Fruit 19.5.2.4 Cola 19.5.2.5 Mixed Fruit 19.5.2.6 Others 19.6 Global Energy Drinks Market Size and Forecast, By Packaging Type 19.6.1 Cans 19.6.2 Bottles 19.6.3 Others 19.7 Global Energy Drinks Market Size and Forecast, By Pack Size 19.7.1 Below 200 ml 19.7.2 200–500 ml 19.7.3 Above 500 ml 19.8 Global Energy Drinks Market Size and Forecast, By Distribution Channel 19.8.1 Off-Trade 19.8.1.1 Supermarkets & Hypermarkets 19.8.1.2 Convenience Stores 19.8.1.3 Specialty Stores 19.8.1.4 Independent Retailers 19.8.1.5 Online Retail 19.8.1.6 Others 19.8.2 On-Trade 19.8.2.1 Bars & Nightclubs 19.8.2.2 Restaurants & Cafés 19.8.2.3 Hotels 19.8.2.4 Others 19.9 Global Energy Drinks Market Size and Forecast, By Consumer Group 19.9.1 Teenagers 19.9.2 Young Adults 19.9.3 Adults 19.9.3.1 Note: Segment-wise market size estimates for all regions and countries will follow the same structure throughout the final report. SECTION B: GLOBAL ENERGY DRINKS MARKET COMPETITIVE LANDSCAPE B1. Competitive Landscape 1.1 MMR Competitive Matrix 1.2 Competitive Positioning of Leading Global Energy Drinks Manufacturers (Revenue & Market Share %) 1.3 Key Players Benchmarking 1.3.1 Company Name 1.3.2 Headquarters 1.3.3 Year Established 1.3.4 Business Portfolio 1.3.5 Energy Drinks Product Portfolio 1.3.6 Key Brands 1.3.7 Manufacturing Facilities 1.3.8 Production Capacity 1.3.9 Geographic Presence 1.3.10 Distribution Network 1.3.11 Revenue (2025) 1.3.12 Market Share (%) 1.3.13 Research & Development (R&D) Focus 1.3.14 Sustainability & ESG Initiatives 1.3.15 Recent Product Launches 1.3.16 Strategic Developments (Partnerships, M&A & Expansion) 1.3.17 Competitive Strength / Market Position 1.4 Market Structure 1.4.1 Tier-I Global Beverage Companies 1.4.2 Tier-II Regional Energy Drinks Manufacturers 1.4.3 Emerging Functional Beverage Brands 1.4.4 Private Label Manufacturers 1.5 Recent Strategic Developments 1.6 Mergers & Acquisitions B2. Competitive Market Structure and Industry Positioning Analysis 2.1 Comparative Assessment of Global Market Concentration Using CR3, CR5, and Herfindahl–Hirschman Index (HHI) 2.2 Competitive Positioning Assessment Across Global, Regional, and Emerging Energy Drinks Brands 2.3 Market Share Benchmarking Based on Brand Portfolio, Geographic Presence, and Commercial Performance 2.4 Entry Barrier Assessment for New Energy Drinks Manufacturers 2.5 Competitive Advantage Analysis Based on Product Innovation, Marketing Strategy, and Distribution Strength 2.6 Future Competitive Landscape Outlook Across the Global Energy Drinks Industry B3. Company Market Share and Revenue Performance Analysis (2025–2026) 3.1 Comparative Revenue-Based Market Share Analysis of Leading Global Energy Drinks Companies 3.2 Regional Revenue Contribution Assessment Across North America, Europe, Asia Pacific, Middle East & Africa, and South America 3.3 Revenue Distribution Analysis Across Product Categories and Packaging Formats 3.4 Commercial Performance Benchmarking Across Premium, Mainstream, and Functional Energy Drinks Brands 3.5 Sales Performance Assessment Across Domestic and International Markets 3.6 Future Revenue Growth Outlook Across Global Market Participants B4. Corporate Growth Strategy and Business Expansion Analysis 4.1 Geographic Expansion Strategies Across High-Growth Beverage Markets 4.2 Manufacturing Capacity Expansion Strategies Supporting Global Demand 4.3 Brand Portfolio Diversification Strategies Across Functional Beverage Categories 4.4 Market Penetration Strategies Across Emerging Consumer Segments 4.5 Strategic Partnerships, Joint Ventures, Mergers, and Acquisition Assessment 4.6 Long-Term Corporate Growth Roadmap Across the Global Energy Drinks Industry B5. Product Portfolio and Brand Benchmarking Analysis 5.1 Comparative Assessment of Product Portfolios Across Leading Energy Drinks Manufacturers 5.2 Comparative Benchmarking of Sugar-Free, Functional, Organic, and Premium Product Offerings 5.3 Packaging Portfolio Benchmarking Across Cans, Bottles, Multi-Packs, and Energy Shots 5.4 Brand Positioning Assessment Across Sports, Gaming, Lifestyle, and Wellness Categories 5.5 New Product Launch Benchmarking Across Global Beverage Companies 5.6 Future Product Development Strategy Assessment B6. Financial Performance and Profitability Benchmarking 6.1 Comparative Revenue Growth Assessment Across Leading Energy Drinks Companies 6.2 Operating Margin, EBITDA, and Net Profit Performance Benchmarking 6.3 Revenue per Employee and Operational Productivity Comparison 6.4 Capital Investment and Manufacturing Asset Utilization Assessment 6.5 Return on Investment and Financial Stability Benchmarking 6.6 Long-Term Financial Performance Assessment Across Industry Participants B7. Manufacturing Footprint and Operational Benchmarking 7.1 Comparative Assessment of Global Manufacturing Facilities and Beverage Production Plants 7.2 Regional Production Footprint Benchmarking Across Major Energy Drinks Companies 7.3 Manufacturing Efficiency Benchmarking Across Leading Beverage Manufacturers 7.4 Co-Manufacturing and Contract Production Network Assessment 7.5 Operational Flexibility Benchmarking Supporting Product Portfolio Expansion 7.6 Global Manufacturing Competitiveness Assessment B8. Brand Strategy, Marketing, and Consumer Engagement Analysis 8.1 Comparative Assessment of Brand Positioning Strategies Across Leading Energy Drinks Companies 8.2 Marketing Investment Benchmarking Across Sports Sponsorships, Esports, Music, and Lifestyle Events 8.3 Digital Marketing and Social Media Engagement Benchmarking 8.4 Celebrity and Athlete Endorsement Strategy Assessment 8.5 Customer Loyalty and Brand Retention Strategy Analysis 8.6 Future Marketing Strategy Outlook Supporting Brand Expansion B9. Innovation, R&D, and Intellectual Property Benchmarking 9.1 Comparative Assessment of Research & Development Investment Across Leading Beverage Companies 9.2 Innovation Benchmarking Across Functional Ingredients, Sugar Reduction, and Clean Label Technologies 9.3 Patent Portfolio Assessment Supporting Beverage Formulation and Packaging Innovation 9.4 Product Development Pipeline Assessment Across Global Energy Drinks Brands 9.5 Innovation Leadership Benchmarking Supporting Competitive Differentiation 9.6 Future Innovation Strategy Outlook Across the Global Market 10. Company Profiles: Region-Wise Market Participants (40+ Key Players 10.1 Detailed Profile Parameters Considered 10.1.1 Overview 10.1.2 Business Portfolio 10.1.3 Product Portfolio 10.1.4 Financial Performance (2023–2025) 10.1.5 Manufacturing Infrastructure 10.1.6 Beverage Manufacturing Capabilities 10.1.7 Geographic Presence 10.1.8 Recent Developments 10.2 Key Players North America 10.2.1. Red Bull North America 10.2.2. Monster Energy Company 10.2.3. PepsiCo Inc. (Rockstar Energy) 10.2.4. Celsius Holdings Inc. 10.2.5. Keurig Dr Pepper Inc. (Ghost Energy) 10.2.6. Living Essentials LLC (5-hour Energy) 10.2.7. Congo Brands (Prime Energy) 10.2.8. Vital Pharmaceuticals Inc. (Bang Energy) 10.2.9. Nutrabolt (C4 Energy) 10.2.10. Jones Soda Co. (Mary Jones Energy) 10.2.11. ZOA Energy LLC 10.2.12. Aspire Brands Inc. Europe 10.2.13. Red Bull GmbH (Austria) 10.2.14. Hell Energy Magyarország Kft. 10.2.15. Oshee Polska Sp. z o.o. 10.2.16. Carabao Europe Ltd. 10.2.17. Tenzing Natural Energy 10.2.18. Lucozade Ribena Suntory (Lucozade Energy) 10.2.19. BOOST Drinks Ltd. 10.2.20. Black Energy Drinks 10.2.21. Effect Energy Drinks 10.2.22. Crazy Wolf Energy Asia Pacific 10.2.23. Suntory Holdings Limited 10.2.24. Otsuka Pharmaceutical Co., Ltd. (Oronamin C) 10.2.25. Taisho Pharmaceutical Co., Ltd. (Lipovitan D) 10.2.26. Eastroc Beverage Group 10.2.27. Hangzhou Wahaha Group 10.2.28. Nongfu Spring Co., Ltd. 10.2.29. TC Pharmaceutical Industries Co., Ltd. (Krating Daeng) 10.2.30. Carabao Group Public Company Limited 10.2.31. AJE Group (Big Cola Energy) 10.2.32. Amrutanjan Health Care Ltd. (India) 10.2.33. Hector Beverages Pvt. Ltd. (Tzinga) 10.2.34. Reliance Consumer Products Ltd. (Campa Energy) Middle East & Africa 10.2.35. Power Horse Energy Drinks GmbH (Middle East Operations) 10.2.36. XXL Energy Drinks 10.2.37. Wild Tiger Energy Drinks 10.2.38. Dubai Refreshments PJSC 10.2.39. Aujan Coca-Cola Beverages Company 10.2.40. Al Rabie Saudi Foods Co. Ltd. South America 10.2.41. Ambev S.A. 10.2.42. Bebidas Fruki S.A. 10.2.43. Grupo Petrópolis (TNT Energy Drinks) 10.2.44. AJE Group 10.2.45. Vive 100 (Quala Group) 10.2.46. Volt Energy Drinks (Regional Brand) Others SECTION C: KEY INSIGHTS, STRATEGIC OUTLOOK & METHODOLOGICAL FRAMEWORK C1. Key Findings C2. Strategic Moves & Industry Outlook C3. Research Methodology

Custom Market Research Services

We Will Customise The Research For You, In Case The Report Listed Above Does Not Meet With Your Requirements