
Cable Glands Market - Industry Structure Evaluation, Demand Drivers Analysis, Regional Growth Analysis and Identification, Competitive Positioning / Landscape Review & Global Market Size Forecast to 2032
Overview
Global Cable Glands Market size was valued at USD 2.24 Bn. in 2025, and the total Cable Glands Market revenue is expected to grow by 6.5% from 2026 to 2032, reaching nearly USD 3.48 Bn.
Cable Glands Market Overview:
The Cable Gland market is a crucial segment in the electrical and electronics sector, which contains equipment used to secure and seal cables that enter enclosures for safety, electrical continuity, and environmental sealing. Cable glands are used in industrial, hazardous, and outdoor environments in several sectors, including energy, manufacturing, oil & gas, construction, and telecommunications.
The report has defined the cable gland, outlined the types of cable glands (including metallic and non-metallic). The report has analysed availability, demand-supply, and material innovations that have impacted production scalability and costs.
The report mentions Asia-Pacific as the leading regional market, largely driven by industrialization in China and India. Europe and North America also demand cable glands due to strict regulations on health and safety. The Cable Gland market key players include ABB Ltd., Eaton Corporation, Amphenol Corporation, CMP Products, and HUBER+SUHNER, and their market share and approaches. The report also gives end-user contribution, and the use of cable glands in the oil & gas and energy sectors contributes a decent portion of market revenue.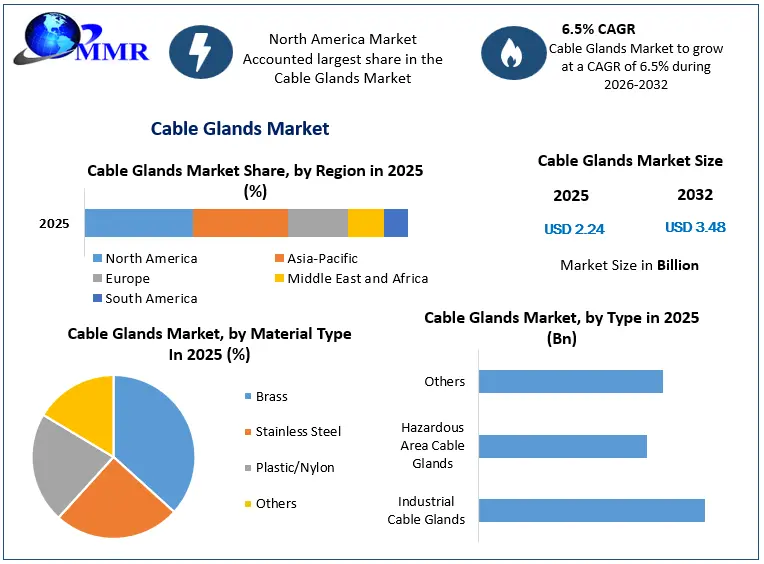
To know about the Research Methodology :- Request Free Sample Report
Cable Glands Market Dynamics
The increasing use of Internet of Things (IoT) devices to drive the Growth of the Cable Glands Market
The increasing use of Internet of Things (IoT) devices drives the growth of the Cable Glands Market by creating a surge in demand for cable glands to support the expanding network of connected devices. As IoT devices become more prevalent in various industries and applications, the need for secure and reliable cable connections to power and communicate with these devices increases significantly.
For example, in the construction industry, where IoT devices are used for smart building management systems, the demand for cable glands to ensure proper connectivity and protection of cables rises in tandem with the adoption of IoT technology. This increased demand for cable glands due to IoT device proliferation leads to a substantial growth opportunity for manufacturers and vendors in the cable glands market. Also, integrating IoT devices in industrial automation and smart city projects further amplifies the need for cable glands to support the infrastructure required for these advanced technologies, driving the growth of the Cable Glands Market.
Major Cable Glands Market Construction Projects Worldwide
| Project Name | Location | Investment | Description |
| NEOM City | Saudi Arabia | $500 billion | A futuristic city in northwestern Saudi Arabia with a varied climate, extensive renewable energy usage, industrial 4.0 principles, and food independence. They are planned to accommodate millions and redefine everyday living, energy supply, production, logistics, education, healthcare, and finance. |
| Dholera Solar Park | India | $170 billion | The Ultra Mega Solar Power Project in Gujarat is aiming for a 5000 MW capacity by 2030. Utilizes both stationary and tracking solar panels, advanced electrical infrastructure, and meticulous planning for efficiency and ecological sustainability. |
| Jubail II Industrial City | Saudi Arabia | $80 billion | Expansion of Jubail Industrial City with infrastructure investments exceeding $80 billion. Includes extensive road networks, industrial sites, a propane dehydrogenation complex, water desalination plants, residential complexes, and an international airport to bolster local industry and efficiency. |
| South-North Water Transfer | China | > $80 billion | Massive project redirecting 45 billion cubic meters of freshwater annually from the southern Yangtze River to northern regions through canal systems. Faces challenges including environmental concerns and the displacement of residents. It was scheduled for completion by 2050, with an initial cost of $79 billion and increasing estimates for the final cost. |
| The Grand Paris Express | France | $45 billion | Major transportation project in France involving four new metro lines and extensions, with 200 kilometers of new track and 68 stations. Expected to serve three million citizens, reduce carbon emissions, and revolutionize travel within Paris by 2050. |
These projects signify substantial investments in various sectors, driving economic growth and innovation. For the cable glands market, these projects present significant expansion opportunities. As construction endeavors expand, so does the need for reliable electrical and data connections, where cable glands are important in ensuring secure and efficient cable management. With the implementation of large-scale projects such as NEOM City, the Gulf Railway, and Dholera Solar Park, there arises a heightened demand for cable glands to support the extensive electrical and communication networks required for these developments.
Additionally, projects including Green Riyadh and the South-North Water Transfer Project underscore the importance of sustainable infrastructure, aligning with the growing trend towards eco-friendly construction practices, which further stimulates demand for environmentally conscious cable gland solutions. These construction projects serve as a substrate for the growth of the cable glands market, creating a conducive environment for innovation and expansion.
Fluctuating Raw Material Price limits to create Restraint for Cable Glands Market
Cable glands, crucial components in electrical and instrumentation systems, rely heavily on materials such as metals, plastics, and rubber. These materials are susceptible to price fluctuations due to various factors such as global demand, supply chain disruptions, and geopolitical tensions. When raw material prices rise, manufacturers face increased production costs, leading to higher prices for cable glands. This deters potential buyers, slows down demand, and hinders market growth. When raw material prices drop, manufacturers reduce prices to remain competitive, which stimulates demand and Cable Glands Market Growth. Also, erratic price movements create uncertainty for manufacturers in planning and budgeting, affecting investment decisions and new product development. Companies hesitate to invest in research and development or expansion projects, limiting innovation and market expansion opportunities. Frequent price changes strain supplier relationships and disrupt supply chains, leading to production delays and inventory management challenges.
Fluctuating raw material prices pose significant challenges to the Cable Glands Market by affecting production costs, pricing strategies, and investment decisions.
Rising Demand for Industrial Automation creates lucrative growth opportunities for the Cable Glands Market. The rising demand for industrial automation boosts the growth in the Cable Glands Market by necessitating efficient and secure cable management solutions. Industrial automation depends heavily on electrical and electronic systems for operations, requiring strong cable connections to ensure smooth functioning and safety. Cable glands are used to protect against environmental factors such as dust, moisture, and vibration while securing cables in place. As industries increasingly adopt automation to enhance productivity and efficiency, the need for reliable cable glands grows exponentially. The growth of sectors such as manufacturing, energy, and transportation further strengthens this demand. Cable Glands manufacturers in the Cable Glands Market are presented with lucrative growth opportunities as they provide the evolving needs of industrial automation, offering innovative and durable solutions to meet the demands of modern industrial settings.
Cable Glands Market Segment Analysis
Based on Cable Type, the Armoured cable type segment significantly dominated the Cable Glands Market in the year 2025. Armoured cables provide superior protection against mechanical damage, moisture, and other environmental hazards compared to non-armoured counterparts. This makes them ideal for use in harsh industrial environments, outdoor installations, and areas prone to vandalism or accidental damage. Armoured cables offer enhanced safety by minimizing the risk of electrical faults, short circuits, and fires caused by physical damage or tampering.
This reliability is particularly crucial in critical infrastructure applications such as power generation, oil and gas, and transportation, where downtime leads to significant losses. High-quality cable glands are required in applications, and this factor is significantly responsible for the growth of the cable glands market. The versatility of armoured cables makes them suitable for a wide range of applications, including power distribution, telecommunications, and data transmission. They withstand high temperatures, pressures, and corrosive substances, ensuring uninterrupted operation in demanding conditions. Advancements in technology have led to the development of lightweight and flexible armoured cable variants, further expanding their usability and Cable Glands market appeal.
Cable Glands Market Regional Analysis
The North American region dominated the Cable Glands Market in the year 2025. Particularly, the United States has been a hub for industrial and infrastructure development. The region has a strong manufacturing sector, extensive oil and gas infrastructure, and significant investments in telecommunications and utilities. These industries require cable glands for efficient cable management and protection. The countries in North America have technological advancements and innovation. This innovation extends to the manufacturing and design of cable glands, making them more efficient, durable, and adaptable to various applications. This technological edge gives North American companies a competitive advantage in the global market.
The North American Cable Glands Market is highly competitive and diversified, with numerous manufacturers offering a wide range of cable glands to meet different industry needs. This competition drives innovation, quality improvement, and cost-effectiveness, further strengthening the region's dominance in the market. North American companies often have well-established distribution networks both domestically and internationally. This allows them to reach a wide customer base and efficiently supply cable glands to various industries across the globe.
Competitive Landscape of Cable Glands Market:
The Cable Glands Market is moderately concentrated, with key global and regional players competing for market share through innovation, safety certifications, and product durability. Growth in demand across the oil and gas, power, and manufacturing sectors is are major driver for the growth of this market. In addition, players are also investing heavily in R&D and creating emerging and established new markets. Some of the prominent players in the market, like CMP Products and Hawke International (a division of Hubbell Inc.), demonstrate innovation, high performance, and certification (based on performance) in their offerings.
For instance, both companies launched a full range of flameproof cable glands in 2025. The focus on innovation was strikingly different in each approach. CMP Products focused on innovation around faster installation and more reliable seals, whereas Hawke's (with an unusual position as a division of Hubbell) approach was all about a modular design for adaptable applications and comprehensive environmental usages for their flameproof cable glands. Each subsequent product position reflects the strategic trend of differentiation on the basis of application-based innovations, which deliver on performance, reliability, usability, and compliance against global safety regulations.
Cable Gland Market Recent Developments
| Date | Company | Development | Impact |
|---|---|---|---|
| 04 December 2024 | ABB Ltd. | The company finalized the strategic acquisition of Solutions Industry & Building (SIB), a premier French manufacturer of highly specialized metallic and plastic cable glands. | This acquisition expands its electrification portfolio, strengthening market reach within railway, hazardous area, and industrial applications globally. |
| 16 March 2025 | Cabex India | The enterprise launched an innovative new portfolio of Hazardous Area Cable Glands specifically engineered to satisfy strict international safety benchmarks. | The commercial rollout scales up environmental defense for complex circuitry in high-risk sectors like petrochemicals, mining, and oil & gas. |
| 15 June 2025 | Amphenol Corporation | The manufacturer officially introduced its cutting-edge GuardXcel Series consisting of ruggedized industrial cable glands, specialized vents, and modular containment accessories. | The unique line boosts system operating lifespans and simplifies hardware mounting procedures to maximize cross-industry deployment efficiency. |
| 24 July 2025 | LAPP India | The component specialist expanded its product availability by rolling out the advanced, heavy-duty SKINTOP cable glands array into the regional industrial landscape. | The product injection delivers upgraded, vibration-proof strain relief and watertight anchoring across general and extreme manufacturing environments. |
Cable Gland Market Key Trends
1. Rising Demand for Explosion-Proof and Flameproof Cable Glands
With increased safety regulations in industries such as oil & gas, mining, and chemical processing, demand for ATEX and IECEx-certified cable glands is growing rapidly.
Example: The hazardous area cable glands segment accounted for approximately 28% of the total market share in 2024 and is projected to grow at a CAGR of 7.5% through 2030.
2. Shift Toward Non-Metallic and Eco-Friendly Materials
Companies are increasingly adopting plastic/nylon cable glands for lightweight, corrosion-resistant applications in renewable energy, telecom, and indoor installations.
Example: The plastic/nylon material segment held around 22% of the material-type market share in 2024, with demand expected to rise by 8% YoY in emerging markets.
3. Integration of Smart Features and Modular Designs
Smart and modular cable gland systems that offer easy installation, sealing flexibility, and IoT compatibility are gaining traction in industrial automation and smart grids.
Example: Over 35% of new product launches in 2023–2024 featured tool-less installation and multi-cable entry support, driven by rising automation demand in Europe and Asia-Pacific.
Cable Glands Market Scope: Inquiry Before Buying
| Cable Glands Market | |||
|---|---|---|---|
| Report Coverage | Details | ||
| Base Year: | 2025 | Forecast Period: | 2026-2032 |
| Historical Data: | 2020 to 2025 | Market Size in 2025: | USD 2.24 Bn. |
| Forecast Period 2026 to 2032 CAGR: | 6.5 % | Market Size in 2032: | USD 3.48 Bn. |
| Segments Covered: | by Type | Industrial Cable Glands Hazardous Area Cable Glands Others |
|
| by Cable Type | Armoured Unarmoured |
||
| by Material Type | Brass Stainless Steel Plastic/Nylon Others |
||
Cable Glands Market by Region
North America (United States, Canada and Mexico)
Europe (United Kingdom, France, Germany, Italy, Spain, Sweden, Russia, Rest of Europe)
Asia Pacific (China, Japan, South Korea, India, Australia, Malaysia, Thailand, Vietnam, Indonesia, Philippines, Rest of APAC)
Middle East and Africa (South Africa, GCC, Nigeria, Egypt, Turkey, Rest of MEA)
South America (Brazil, Argentina, Colombia, Chile, Peru, Rest of South America)
Cable Glands Market Key Players are:
North America:
1. Eaton Corporation (USA)
2. Emerson Electric Co. (USA)
3. Appleton Group (part of Emerson) (USA)
4. Amphenol Industrial Operations (USA)
5. Hubbell Incorporated (USA)
Europe:
1. CMP Products Ltd. (UK)
2. Hawke International (UK, part of Hubbell)
3. Jacob GmbH (Germany)
4. Weidmüller Interface GmbH & Co. KG (Germany)
5. Pflitsch GmbH & Co. KG (Germany)
Asia-Pacific:
1. ABB India Ltd. (India/Switzerland)
2. WISKA Hoppmann GmbH (manufactures in China)
3. Cao Cable Gland Co., Ltd. (China)
4. Shanghai Richeng Electronics (China)
5. Sealcon (India & China operations)
Middle East & Africa:
1. Al Watania Electrical (Saudi Arabia)
2. Cortem Group ME (UAE)
3. Powertech Switchgear Industries (UAE)
4. Aberdare Cables (South Africa)
5. AR-Met (Turkey – active in the MENA region)
Latin America:
1. WEG SA (Brazil)
2. Electro-Mag (Argentina)
3. Phoenix Contact LATAM (Mexico/Brazil operations)
4. Schneider Electric (LATAM divisions)
5. Legrand (LATAM operations)
Frequently Asked Questions
1] What segments are covered in the Global Cable Glands Market report?
Ans. The segments covered in the Cable Glands Market report are based on type, cable type, material type, end user industry, and Regions.
2] Which region is expected to hold the highest Global Cable Glands Market share?
Ans. The North America region is expected to hold the highest Cable Glands Market share.
3] What is the market size of the Global Cable Glands Market by 2032?
Ans. The market size of the Cable Glands Market by 2032 is expected to reach USD 3.48 Bn.
4] What was the market size of the Global Cable Glands Market in 2025?
Ans. The Cable Glands Market size was valued at USD 2.24 Bn. in 2025.
5] Key players in the Cable Glands Market.
Ans. CMP Products (UK), Hawke International (UK), Eaton Corporation (Ireland), Jacob GmbH (Germany), Cable Gland Company (UK)