
E-Fuels Market - Industry Structure Evaluation, Demand Drivers Analysis, Regional Growth Analysis and Identification, Competitive Positioning / Landscape Review & Global Market Size Forecast to 2032
Overview
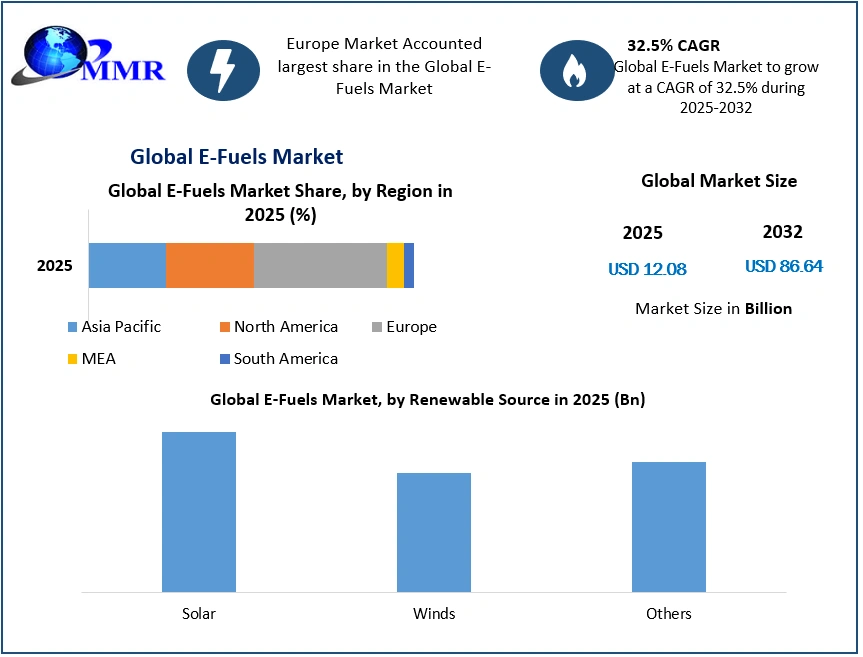
The E-Fuels Market size was valued at USD 12.08 Billion in 2025 and the total E-Fuels revenue is expected to grow at a CAGR of 32.5% from 2026 to 2032, reaching nearly USD 86.64 Billion by 2032.
E-fuel, short for electrofuel, represents a synthetic fuel created from renewable energy sources like solar or wind power using a process called power-to-liquid (PtL). This innovative technology converts renewable electricity into hydrogen through electrolysis, later combining it with carbon dioxide to craft a liquid fuel.
To know about the Research Methodology :- Request Free Sample Report
The global energy landscape is undergoing a transformative shift with e-fuel emerging as a vital pathway to achieving net-zero emissions, a factor that is expected to support the e-fuels market growth. The growth of the e-fuels market is being fueled by several key drivers , a surge in sustainability initiatives globally, emphasizing the reduction of carbon emissions, has led to the rise of e-fuels as a practical solution. Simultaneously, technological advancements, especially in power-to-liquid processes, are transforming e-fuel production, enhancing efficiency, and reducing costs driving the e-fuels market. The compatibility of e-fuels with existing infrastructure and their ability to cater to long-haul transport needs are key drivers of e-fuels market adoption. Additionally, corporate commitments to sustainability, with many integrating e-fuels into their strategies, are supporting market growth. These factors forecast a promising path for the e-fuels market, leading to a more sustainable future in the energy sector through continued innovation and expansion.
As the share of electricity in total final energy consumption continues to rise, several countries are making significant strides in this direction. The UK has positioned e-fuels as a pivotal solution in its ambitious pursuit of achieving net-zero emissions by 2050. Recognizing their potential as a low-carbon gamechanger, the UK government announced in February 2024 a substantial £20 million fund specifically dedicated to supporting the development of e-fuels and other sustainable fuel alternatives. These concerted efforts in the UK signify a growing commitment towards integrating e-fuels into their strategies for a greener and more sustainable transportation future. North America is one of the fastest-growing regions in the growing e-fuels market. With a keen eye on sustainable solutions for reducing carbon emissions, the continent has witnessed a rapid surge in e-fuel initiatives and investments.
E-Fuels Market Dynamics:
The Soaring Demand for Sustainable Aviation Fuels Takes Flight
The rising demand for Sustainable Aviation Fuels (SAFs) reflects a global shift towards greener practices in the aviation industry. These fuels, derived from renewable sources such as plant oils, algae, and waste biomass, offer a significant reduction in lifecycle greenhouse gas emissions compared to conventional jet fuels. Several key factors driving the growing demand for SAFs include, Environmental imperatives, government initiatives, industry commitment, advancements in technology, and increased production capacity drive the e-fuels market. SAFs offer substantial benefits, including a significant reduction in greenhouse gas emissions, sourcing from renewable materials contributing to a circular economy, compatibility with existing aircraft engines, and performance similar to traditional jet fuels. As the aviation sector increasingly embraces sustainability goals, the demand for SAFs is poised for continuous growth, steering the industry towards a greener and more environmentally responsible future, as fuel costs of airlines globally are increased.
E-Fuel Innovations Driving Greener Roads Ahead
The e-fuel revolution is driving a wave of innovation, offering a promising future for environmentally conscious transportation. Researchers are intensifying efforts to revolutionize e-fuel production, aiming to supercharge efficiency, slash expenses, and expand accessibility on a larger scale. The spotlight is firmly fixed on harnessing renewable energy sources, like solar and wind power, to ensure that e-fuel production is not just efficient but also environmentally sound throughout its entire lifecycle. A crucial breakthrough involves capturing CO2 emissions and merging them with renewable hydrogen—a pivotal step catapulting e-fuel technology to unparalleled levels. Simultaneously, advancements in catalyst materials and electrolysis techniques are taking center stage, elevating the speed and effectiveness of e-fuel manufacturing. Both governmental bodies and private sectors are rallying behind e-fuels, acknowledging their immense potential and making substantial investments to pave the way for a competitive, sustainable solution within the transportation sector. These remarkable strides are triumphing over challenges linked to costs, efficiency, scalability, and environmental impact, nudging e-fuels closer to becoming the frontrunner in our pursuit of greener, more sustainable transportation alternatives.
Pioneering the Decarbonization Drive in Transportation
The shift towards e-fuels marks a huge change in power transportation, and it's a game-changer in the market. These synthetic fuels, made from renewable electricity and CO2, are a promising solution to cut down on the transportation sector's carbon emissions. What makes them stand out is that they fit perfectly into the current infrastructure, making it easy to use them in all sorts of transportation without needing big changes. These e-fuels are made from renewable sources, which means they're a big win for the environment compared to regular fuels. They work seamlessly with current transportation systems, especially in engines used for ages, so there's no need to spend a lot of money on upgrades. Plus, they pack the same energy punch as the fuels, making them perfect for long trips, even in tough areas like aviation and heavy-duty transport. By using renewable electricity, e-fuels have the potential to seriously cut down on greenhouse gas emissions compared to fuels, paving the way for a greener future in transportation. This potential for a more sustainable future is set to boost the market, sparking more innovation and investment in the growing e-fuels industry.
E-Fuels Market Segment Analysis:
Based on the Renewable source, the Solar segment held the largest market share of 64.2% and dominated the global E-Fuels market in 2025. Solar energy stands as a renewable resource of immense availability, positioning itself as an ideal and sustainable foundation for e-fuel production. Its abundance originates from the sun's rays, offering a dependable and consistent source of energy that can be harnessed prolifically. The sustainability aspect of solar energy production is particularly noteworthy, given its emission-free nature. In stark contrast to the significant greenhouse gas emissions associated with traditional fossil fuels, solar energy stands out for its cleanliness and sustainability, playing a pivotal role in steering the transportation sector towards decarbonization. Moreover, the maturity of solar energy technology has been pivotal in its evolution towards cost-effectiveness and competitiveness as an electricity source for e-fuel production. Over time, substantial advancements in solar technology have driven down costs while notably enhancing efficiency, marking it as a compelling and viable option for powering the e-fuel industry, and making it an attractive choice for businesses within the e-fuel sector.
Besides that, the wind segment is expected to grow at a rapid CAGR and offer lucrative growth opportunities for e-fuel manufacturers all across the world during the forecast period. Wind energy has emerged as a pivotal player within e-fuel production, playing a significant role in harnessing renewable electricity for creating e-fuels like e-methanol and e-diesel. The rising popularity and increasing merits of wind energy, notably its abundance and sustainability, position it as a promising source of renewable electricity for e-fuels generation driving the e-fuels market. With the rising demand for sustainability, wind energy stands out for its lack of greenhouse gas emissions or pollutants, aligning remarkably well with the transportation sector's goals of reducing carbon footprints. Environmentally friendly attribute sets wind energy apart from fossil fuels, making it pivotal in efforts to reduce greenhouse gas emissions. Moreover, the cost-effectiveness of wind energy has seen notable progress, increasingly becoming competitive and viable for e-fuel production. Advancements in wind turbine technology, coupled with the expansion of wind farms, have substantially reduced costs while enhancing efficiency. The versatility across a diverse range of features contributes significantly to its rapid growth.
E-Fuels Market Regional Insights
The European region led the global E-Fuels market with the highest market share of 60% in 2025. The region is further expected to grow at a CAGR of 32.8% during the forecast period and maintain its dominance by 2032. The increasingly diverse range of substantial investments in research and development, coupled with government incentives, have been key drivers behind the European e-fuels market growth. Countries like Germany, Denmark, Sweden, and the Netherlands have led the charge, implementing supportive policies and robust regulatory frameworks to support the production and widespread adoption of e-fuels. For Instance,
1. Germany’s Renewable Energy Act (EEG), revised multiple times, includes provisions for renewable energy fee-in-tariffs. It supports the generation of electricity from renewable sources, which is crucial for powering e-fuel synthesis plants.
2. Denmark has a long-term Energy Agreement that focuses on achieving a fossil fuel-free future by 2050. The agreement provides incentives and grants for renewable energy projects, including those related to e-fuel development.
3.Sweden's Climate Act sets legally binding targets for reducing greenhouse gas emissions. It drives the country's efforts towards achieving net-zero emissions by 2045, prompting investments and policies favoring sustainable alternatives like e-fuels. 4. The Netherlands established a Climate Agreement, aiming for a 49% reduction in greenhouse gas emissions by 2032. It promotes renewable energy sources and incentivizes low-carbon fuel options like e-fuels through subsidies and tax benefits.
The European regions have championed supportive policies and incentives, ranging from financial subsidies to carbon pricing mechanisms, fostering an environment where e-fuels emerge as an economically preferable choice compared to traditional fossil fuels. Europe has leading-edge research institutions and innovative companies frequently driving e-fuel technologies forward. These advancements have significantly enhanced production processes, elevating efficiency levels and curbing costs driving the e-fuels market.
According to the MMR analysis, the European e-fuels market predicts substantial growth, fueled by environmental concerns, technological strides, and government support. E-fuels are positioned as key players in decarbonizing challenging sectors like aviation and heavy-duty transport. The trends include escalating production capacities, exploration into diversified feedstocks, integration with renewable energy infrastructure, and sustained policy reinforcement. As e-fuel technology matures and costs decline, broader adoption is anticipated, driving Europe towards a more sustainable transportation landscape and paving the way for a global shift towards greener fuels.
The Asia-Pacific are the leaders in the E-Fuels market as these countries are increasingly advancing hydrogen and e-fuel in the e-fuel industry. This is driven by regulatory pressure to reduce greenhouse gas emissions and operational cost savings. Japan has made substantial investments in research and development, aiming to establish a hydrogen society boosting the e-fuel industry. Initiatives such as the Green Growth Strategy and the Basic Hydrogen Strategy emphasize the importance of hydrogen and e-fuels in achieving carbon neutrality. Japan's commitment to hosting the Tokyo Olympic Games in with a focus on hydrogen-powered vehicles showcased its dedication to sustainable energy solutions driving the e-fuels market.
China, renewable energy goals, have shown increasing interest in e-fuels. The country's focus on transitioning towards cleaner energy sources has led to investments in hydrogen and e-fuel projects leading to the e-fuels market’s growth. China's vast renewable energy capacity, including solar and wind, provides a solid foundation for e-fuel production. Several Chinese companies have also initiated research and pilot projects in the e-fuel sector, positioning the country as a potential leader in the future e-fuels market. South Korea has been actively promoting e-fuels as part of its strategy to achieve carbon neutrality. The government has announced plans and incentives to boost the hydrogen economy, including the expansion of hydrogen infrastructure and support for the development of e-fuels. Investments in fuel cell technology and collaborations between government entities and private companies further indicate South Korea's increasing e-fuels market demand. This transition to a low-carbon economy is a complex endeavor, requiring tailored strategies across the country's provinces and territories.
E-Fuels Market Competitive Landscapes:
The Global E-Fuels market is expected to be highly competitive active presence of numerous market players. Major companies are striving to introduce sustainable aviation fuels, green hydrogen, and cost-effective e-fuel production processes, promoting overall market growth. In addition, Several E-Fuels manufacturers are focused on enhancing and expanding their core business through the launch of additional efficient products to keep up with conventional E-Fuels sales. Key players are adopting various business strategies, including technical partnerships and mergers and acquisitions (M&A) to remain competitive in the E-Fuels market. For instance,
In 2023, Porsche and ENI, an Italian energy company, announced a partnership to explore the commercial production of e-fuel in Italy.
In 2023, Airbus and BP signed a MoU to collaborate on the development and use of SAFs.
In 2022, TotalEnergies, a French energy company acquired a 50% stake in Maha Energy, a Canadian company developing e-fuel projects.
Climeworks Known for direct air capture technology, Climeworks has been actively involved in partnerships and acquisitions, including the acquisition of Sunfire, a company specializing in e-fuel production in . Climeworks aims to integrate carbon capture with e-fuel production.
Electrochaea and INERATEC merged, combining their expertise in power-to-gas technology and modular chemical reactors for e-fuel production in.
These strategic endeavors underscore the E-Fuels industry's commitment to diversifying product lines, innovating within segments, and adopting strategic partnerships to compete effectively in the market landscape. As consumer preferences evolve, these proactive strategies position E-Fuels manufacturers for sustained growth and competitiveness in the energy market.
E-Fuels Market Scope:Inquire Before Buying
| Global E-Fuels Market | |||
|---|---|---|---|
| Report Coverage | Details | ||
| Base Year: | 2025 | Forecast Period: | 2026-2032 |
| Historical Data: | 2020 to 2025 | Market Size in 2025: | USD 12.08 Bn. |
| Forecast Period 2026 to 2032 CAGR: | 32.5% | Market Size in 2032: | USD 86.64 Bn. |
| Segments Covered: | by Fuel Type | E-Gasoline E-Diesel Ethanol Hydrogen E-Kerosene Others |
|
| by Renewable Source | Solar Winds Others |
||
| by End Use Application | Transportation Chemicals Power Generation Others |
||
E-Fuels Market, by Region:
North America (United States, Canada, and Mexico)
Europe (UK, France, Germany, Italy, Spain, Sweden, Austria, and the Rest of Europe)
Asia Pacific (China, South Korea, Japan, India, Australia, Indonesia, Malaysia, Vietnam, Taiwan, Bangladesh, Pakistan, and the Rest of APAC)
Middle East and Africa (South Africa, GCC, Egypt, Nigeria, and the Rest of ME&A)
South America (Brazil, Argentina Rest of South America)
E-Fuels Market, Key Players are
1. Siemens Energy
2. Ballard Power Systems, Inc.
3. Saudi Arbian Oil Co.
4. Audi AG
5. Sunfire GmbH
6. Norsk E-Fuel (Norway)
7. Archer Daniels Midland Co.
8. Ballard Power Systems, Inc.
9. Ceres Power Holding Plc
10. Clean Fuels Alliance America
11. Climeworks AG
12. E-Fuel Corporation
13. eFuel Pacific Limited
14. Hexagon Agility
15. Neste
16. Norsk e-Fuel AS
17. E.ON
18. Chargemaster/Ecotricity
19. Cenex
20. Eni
21. ExxonMobil
22. Shell
23. Chevron
24. HIF Global
25. Porsche
26. Mabanaft GmbH & Co.KG
27. Enel Green Power
28. Engie
29. Chemieanlagenbau chemnitz GmbH (CAC)
30. Synhelion
31. Carbon Recycling International (CRI)
32. ABEL Energy
33. NEOM Green Hydrogen company
34. Nordic Electrofuel AS
35. ExxonMobil Corporation
36. INERATEC
37. Arcadia eFuels
FAQs:
1. What are the growth drivers for the E-Fuels market?
Ans. The Increasing focus on reducing carbon emissions and mitigating climate change, coupled with Supportive policies, tax incentives, and infrastructure development by governments worldwide are expected to be the major driver for the E-Fuels market.
2. What are the major trends in the E-Fuels market growth?
Ans. The rise of technological innovations, investment surge etc. are expected to be the major trends in the E-Fuels market.
3. Which region is expected to lead the Global E-Fuels market during the forecast period?
Ans. Europe is expected to lead the global E-Fuels market during the forecast period thanks to increasingly adopting sustainable technologies in the e-fuel industry.
4. What was the Global E-Fuels Market size in 2025?
Ans: The Global E-Fuels Market size was USD 12.08 Billion in 2025.
5. What segments are covered in the E-Fuels Market report?
Ans. The segments covered in the E-Fuels market report are Fuel Type, Renewable source, end-use application.