Micro Turbines Market Size by Power Rating, Application Type, End User Industry, Region – Segment-Level Market Assessment, Growth Opportunity Analysis, Competitive Mapping & Forecast to 2032

9.44%
CAGR (2026-2032)
329.28 USD Mn.
Market Size
312
Report Pages
152
Market Tables

Overview

The Micro Turbines Market size was valued at USD 329.28 Mn in 2025, and the total Micro Turbines revenue is expected to grow at a CAGR of 9.44% from 2026 to 2032, reaching nearly USD 619.16 Mn.

Micro Turbines Market Overview

Micro turbines are compact, high-speed power generation devices that convert fuel (natural gas, biofuels, etc.) into electricity and heat. They typically range from 30 kW to 500 kW and are used for distributed energy, CHP (Combined Heat & Power), and industrial applications. Their key advantages include high efficiency, low emissions, and flexibility in fuel sources.

The demand for microturbines is growing due to their efficiency, low emissions, and suitability for decentralized power generation in industries, commercial buildings, and remote areas. On the supply side, key players like Capstone, Ansaldo Energia, and FlexEnergy dominate the market, with increasing competition driving innovation in performance and cost reduction. However, supply chain challenges and high initial costs can sometimes constrain market expansion.

The microturbine market is dominated by North America (led by the U.S., driven by demand for distributed energy and backup power) and Europe (supported by strict emissions regulations and renewable energy incentives). The top two key players are Capstone Green Energy, the market leader with a broad portfolio of high-efficiency microturbines, and Ansaldo Energia, a major European competitor known for advanced CHP and industrial solutions. Other notable companies include Flex Energy (low-emission systems) and Brayton Energy (hybrid microturbine technologies), but Capstone and Ansaldo remain the most established in the competitive landscape.

The report explores the Micro Turbines Market's segments (Power Rating, Application, End-User, and Region). Data has been provided by market participants, and regions (North America, Asia Pacific, Europe, Middle East & Africa, and South America). It provides a thorough analysis of the rapid advances that are currently taking place across all industry sectors. Facts and figures, illustrations, and presentations are used to provide key data analysis for the historical period from 2019 to 2024. The report investigates the Micro Turbines Market's drivers, limitations, prospects, and barriers. This MMR report includes investor recommendations based on a thorough examination of the Micro Turbines Market's contemporary competitive scenario.Micro Turbines Market Snapshot
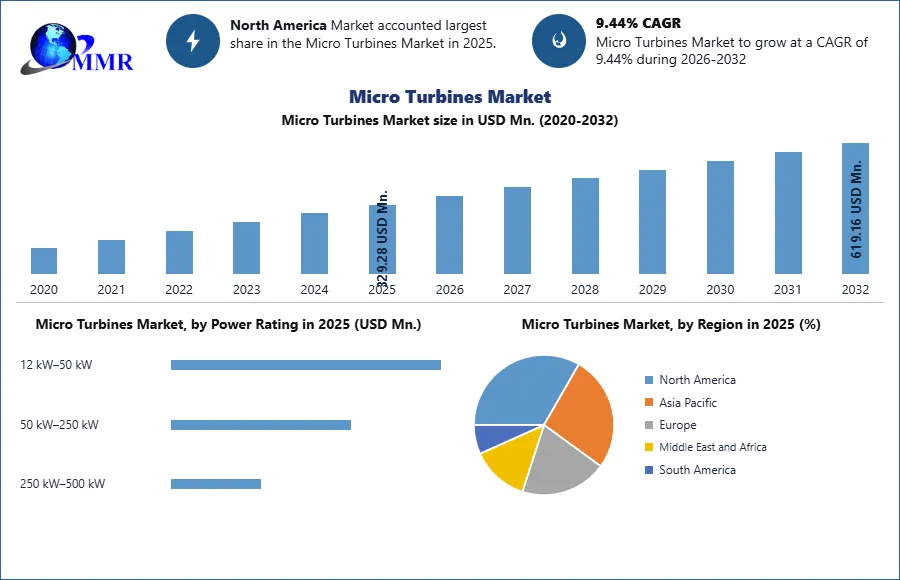
To know about the Research Methodology :- Request Free Sample Report

Micro Turbines Market Dynamics

HP Efficiency to Boost Micro Turbine Market Expansion

The microturbine market is propelled by rising demand for decentralized, resilient power amid grid instability and energy transition trends. Governments incentivize adoption through tax credits (e.g., U.S. ITC, EU CHP Directive) and emissions rules phasing out diesel gensets. Industries favor microturbines for CHP applications, achieving 70–80% efficiency with low NOx emissions. Their ability to utilize natural gas, biogas, and hydrogen blends aligns with decarbonization goals. North America dominates (40% share) due to shale gas affordability, while Europe’s strict carbon policies drive growth. Remote sites (mining, military) also adopt microturbines for off-grid reliability, supported by low maintenance vs. traditional turbines.

Capital Barriers and Competition from Renewables to Create Restraints for the Micro Turbine Market

High capital costs ($1,500–$2,500/kW) and limited output (under 1MW) hinder microturbine competitiveness against solar-storage or gas engines. While lifecycle costs are lower, upfront expenses deter SMEs and developing markets. Supply chain disruptions (e.g., rare metal shortages) delay production, and reliance on natural gas poses risks in regions transitioning to renewables. In Asia and Africa, cheaper coal/diesel alternatives slow adoption. Additionally, technology skepticism persists due to niche awareness, and hybrid renewables often offer better scalability. Regulatory hurdles, like lengthy grid interconnection approvals, further constrain deployments, limiting microturbines to specialized roles in healthcare, data centers, and oilfields.

Capstone & Ansaldo Lead Microturbine Revolution in Hydrogen and Emerging Economies to Create Micro Turbine Market Opportunity

The hydrogen economy presents a breakthrough, with Capstone and Ansaldo developing 100% H2-ready turbines for EU and U.S. clean energy projects. Emerging markets (India, Southeast Asia) offer growth via biogas-driven CHP in the agriculture and wastewater sectors. Waste-to-energy applications (landfill gas, industrial flaring) capitalize on carbon monetization. Hybrid systems pairing microturbines with solar/wind + storage enhance off-grid viability for mining and islands. Innovations in modular, scalable designs could reduce costs, while partnerships with energy-as-a-service firms expand leasing models. With the global microturbine market poised to exceed $3B by 2030, these opportunities could offset current restraints and solidify their role in distributed energy.

Micro Turbines Market Segment Analysis

Based on Application, The Micro Turbines Market is segmented into Combined Heat and Power (CHP) and Standby Power. The Combined Heat and Power (CHP) segment dominated the Micro Turbines Market in 2025 and is expected to hold the largest market share over the forecast period, with holding over 40% share, driven by their high efficiency (70-80%) and widespread adoption in industrial and commercial sectors like manufacturing, healthcare, and data centers. The oil & gas sector follows as a key user for off-grid power and flare gas recovery, while waste-to-energy applications (landfill/biogas) are growing rapidly due to carbon monetization. Emerging opportunities include hybrid renewable-microturbine systems for microgrids and hydrogen-compatible turbines, though high upfront costs limit SME adoption.Micro Turbines Market

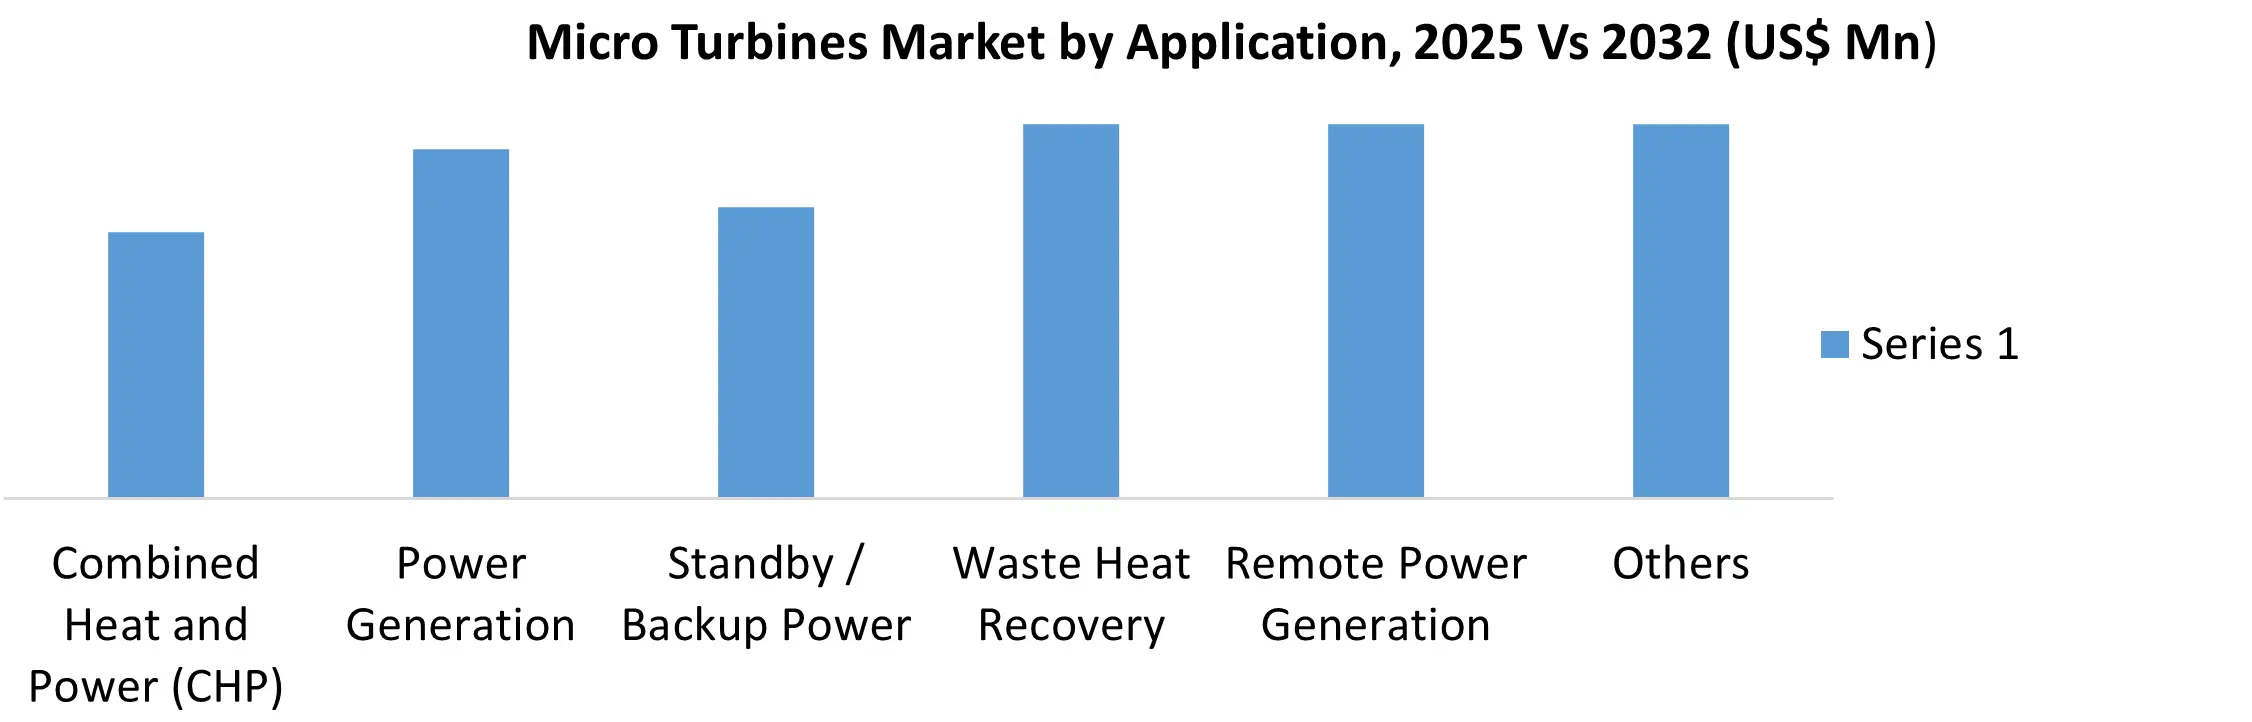
Based on End User, The Micro Turbines Market is segmented into Industrial, Commercial, and Residential Services. The industrial segment dominates the Micro Turbines Market in 2025 and is expected to hold the largest market share over the forecast period. Dominance due to the microturbine adoption, leveraging their high efficiency for combined heat and power (CHP) in manufacturing, oil & gas, and waste processing. Commercial sectors like hospitals, data centers, and hotels follow, utilizing microturbines for resilient, cost-effective energy. Residential use remains limited due to high costs and lower power needs, though microturbines serve niche off-grid applications. Industrial applications account for ~60% of demand, driven by energy-intensive operations and emissions reduction goals, while commercial users represent ~30%, prioritizing reliability. The industrial segment's growth is further fueled by hydrogen-ready systems and biogas integration, whereas commercial adoption benefits from rising distributed energy needs and sustainability mandates in urban infrastructure.

Micro Turbines Market Regional Insights

North America dominates the microturbine market with a 45% global share, driven by abundant shale gas resources, strong policy support (including U.S. Investment Tax Credits and EPA emissions regulations), and high demand for resilient power solutions from industrial and commercial sectors. The region benefits from mature energy infrastructure and hosts leading manufacturers like Capstone, which are pioneering hydrogen-ready and hybrid systems. Key applications include industrial CHP (chemicals, refining), commercial buildings (hospitals, data centers), and oil & gas operations (flare gas recovery). With its technological leadership and favorable market conditions.

Micro Turbines Market Competitive Landscape

The global micro turbines market is highly competitive, with key players focusing on innovation and strategic partnerships to enhance their market share. In 2025, the top two companies are Capstone Green Energy Corporation and Ansaldo Energia, with estimated revenues of $120 million and $90 million, respectively. Capstone Green Energy leads the market with its advanced, low-emission micro turbines, catering to distributed energy systems, while Ansaldo Energia specializes in efficient, hybrid energy solutions. Both companies compete through technological advancements, global expansion, and customized solutions for industries like oil & gas, healthcare, and manufacturing. The competitive landscape is marked by intense R&D investments, with Capstone focusing on sustainability and Ansaldo leveraging its expertise in integrated power systems. Emerging players and regional competitors further intensify the market dynamics, driving innovation and cost efficiency.

Micro Turbines Market Recent Trend

• Hydrogen Compatibility: Major players like Capstone and Ansaldo are launching 100% hydrogen-ready turbines, aligning with global decarbonization goals (EU Hydrogen Strategy, U.S. Clean Hydrogen Hubs).

• Hybrid Energy Systems: Integration with solar/wind + battery storage is gaining traction for off-grid mining, islands, and military bases, enhancing reliability and ROI.

• Waste-to-Energy Expansion: Biogas and landfill gas applications are growing, driven by carbon credit programs and circular economy policies in the EU and Asia.

• Energy-as-a-Service (EaaS) Models: Leasing and pay-per-use options are overcoming high upfront costs, boosting adoption among SMEs.

Micro Turbines Market Recent Development

Date Company Country Recent Development
15-05-2024 Capstone Green Energy USA Launched C1000S, the world’s first 100% hydrogen-fueled microturbine for industrial CHP applications.
22-03-2024 Ansaldo Energia Italy Signed MoU with Snam to develop hydrogen-ready microturbines for Italy’s gas infrastructure.
10-02-2024 FlexEnergy USA Unveiled the YT-3000, an ultra-low-emission microturbine for oilfield flare gas-to-power conversion.
05-01-2024 Brayton Energy USA Secured $12M DOE grant for hybrid solar-microturbine systems for military microgrids.
18-12-2023 Turbec (Mitsubishi) Japan Announced a biogas-to-power microturbine project in Thailand for agro-industrial waste.

Micro Turbines Market Scope: Inquire before buying

Micro Turbines Market
Report Coverage Details
Base Year: 2025 Forecast Period: 2026-2032
Historical Data: 2020 to 2025 Market Size in 2025: 329.28 USD Mn.
Forecast Period 2026-2032 CAGR: 9.44% Market Size in 2032: 619.16 USD Mn.
Segments Covered: by Power Rating 12 kW–50 kW
50 kW–250 kW
250 kW–500 kW
by Fuel Type Natural Gas
Biogas
Diesel
Propane
Hydrogen
by Component Turbine Housing & Enclosures
Combustion Chamber
Heat Exchangers & CHP Units
Fuel System & Piping
Electrical & Control Systems
Exhaust & Emission Systems
by Application Combined Heat and Power (CHP)
Power Generation
Standby / Backup Power
Waste Heat Recovery
Remote Power Generation
Others
by End-Use Industry Industrial
Commercial
Residential
Telecommunications
Transportation
Waste Management
Others

Micro Turbines Market, by Region

North America (United States, Canada and Mexico)
Europe (United Kingdom, France, Germany, Italy, Spain, Sweden, Russia, Rest of Europe)
Asia Pacific (China, Japan, South Korea, India, Australia, Malaysia, Thailand, Vietnam, Indonesia, Philippines, Rest of APAC)
Middle East and Africa (South Africa, GCC, Nigeria, Egypt, Turkey, Rest of MEA)
South America (Brazil, Argentina, Colombia, Chile, Peru, Rest of South America)

Micro Turbines Market Key Players are:

North America:
1. Capstone Green Energy Corporation
2. FlexEnergy Solutions
3. Brayton Energy, LLC
0. Dresser-Rand (Siemens Energy)
5. Calnetix Technologies LLC
6. ICR Turbine Engine Corporation
7. Turbine Technologies Ltd.
8. UAV Turbine Inc.
9. Wilson Solarpower Corporation
10.Turbine Generator Maintenance Inc.
11.Turbine Power Systems
12.Ecovent
13.Others

Europe:
1. Ansaldo Energia S.p.A. (Italy)
2. MAN Energy Solutions (Germany)
3. Aurelia Turbines Oy (Finland)
0. Bladon Technologies Ltd. (U.K.)
5. Centrax Gas Turbines Ltd. (U.K.)
6. Micro Turbine Technology B.V. (Netherlands)
7. Advanced Microturbines Srl (Italy)
8. Bladon Micro Turbine (U.K.)
9. Eneftech Innovation (Europe-based operations)
10.Microturbine Systems Ltd.
11.Others

Asia-Pacific:
1. Mitsubishi Power (Japan)
2. Kawasaki Heavy Industries Ltd. (Japan)
3. Toyota Turbine and Systems Inc. (Japan)
0. Harbin Electric Corporation (China)
5. Bharat Heavy Electricals Limited (BHEL) (India)
6. Shenyang Blower Works Group (China)
7. Daihatsu Diesel Mfg. Co., Ltd. (Japan)
8. Turbotech Precision Engineering Pvt. Ltd. (India)
9. Distributed Energy System OEMs (China cluster)
10.Others

Middle East & Africa:
1.Turbomach SA (South Africa)
2.Sulzer Energy (UAE)
3.Saudi Turbines (Saudi Arabia)
0.Energogas (Egypt)
5.Others

South America:
1.TGM Turbinas (Brazil)
2.Hoffmann Engenharia (Brazil)
3.Termoeléctrica (Argentina)
0.Energía y Potencia (Colombia)
5.Others

Frequently Asked Questions:

1. Which region has the largest share in the Global Micro Turbines Market?
Ans: The North America region held the highest share in 2025.

2. What is the growth rate of the Global Micro Turbines Market?
Ans: The Global Micro Turbines Market is expected to grow at a CAGR of 9.44% during the forecast period 2026-2032.

3. What is the scope of the Global Micro Turbines market report?
Ans: The Global Micro Turbines Market report helps with the PESTEL, Porter's, COVID-19 Impact analysis, Recommendations for Investors & Leaders, and market estimation of the forecast period.

4. Who are the key players in the Global Micro Turbines market?
Ans: The important key players in the Global Micro Turbines Market are – Capstone Turbine, Ansaldo Energia, Toyota Turbine and Systems, and Bowman.

5. What is the study period of this market?
Ans: The Global Micro Turbines is studied from 2025 to 2032.

Table of Contents

1. Micro Turbines Market Introduction
1.1. Study Assumption and Market Definition
1.2. Scope of the Study
1.3. Executive Summary
2. Global Micro Turbines Market: Competitive Landscape
2.1. MMR Competition Matrix
2.2. Competitive Landscape
2.3. Key Players Benchmarking
2.3.1. Company Name
2.3.2. Business Segment
2.3.3. End-user Segment
2.3.4. Revenue (2025)
2.3.5. Company Locations
2.4. Leading Micro Turbines Market Companies, by market capitalization
2.5. Market Structure
2.5.1. Market Leaders
2.5.2. Market Followers
2.5.3. Emerging Players
2.6. Mergers and Acquisitions Details
3. Micro Turbines Market: Dynamics
3.1. Micro Turbines Market Trends by Region
3.1.1. North America Micro Turbines Market Trends
3.1.2. Europe Micro Turbines Market Trends
3.1.3. Asia Pacific Micro Turbines Market Trends
3.1.4. Middle East and Africa Micro Turbines Market Trends
3.1.5. South America Micro Turbines Market Trends
3.2. Micro Turbines Market Dynamics by Region
3.2.1. North America
3.2.1.1. North America Micro Turbines Market Drivers
3.2.1.2. North America Micro Turbines Market Restraints
3.2.1.3. North America Micro Turbines Market Opportunities
3.2.1.4. North America Micro Turbines Market Challenges
3.2.2. Europe
3.2.2.1. Europe Micro Turbines Market Drivers
3.2.2.2. Europe Micro Turbines Market Restraints
3.2.2.3. Europe Micro Turbines Market Opportunities
3.2.2.4. Europe Micro Turbines Market Challenges
3.2.3. Asia Pacific
3.2.3.1. Asia Pacific Micro Turbines Market Drivers
3.2.3.2. Asia Pacific Micro Turbines Market Restraints
3.2.3.3. Asia Pacific Micro Turbines Market Opportunities
3.2.3.4. Asia Pacific Micro Turbines Market Challenges
3.2.4. Middle East and Africa
3.2.4.1. Middle East and Africa Micro Turbines Market Drivers
3.2.4.2. Middle East and Africa Micro Turbines Market Restraints
3.2.4.3. Middle East and Africa Micro Turbines Market Opportunities
3.2.4.4. Middle East and Africa Micro Turbines Market Challenges
3.2.5. South America
3.2.5.1. South America Micro Turbines Market Drivers
3.2.5.2. South America Micro Turbines Market Restraints
3.2.5.3. South America Micro Turbines Market Opportunities
3.2.5.4. South America Micro Turbines Market Challenges
3.3. PORTER's Five Forces Analysis
3.4. PESTLE Analysis
3.5. Technology Roadmap
3.6. Regulatory Landscape by Region
3.6.1. North America
3.6.2. Europe
3.6.3. Asia Pacific
3.6.4. Middle East and Africa
3.6.5. South America
3.7. Key Opinion Leader Analysis For Micro Turbines Industry
3.8. Analysis of Government Schemes and Initiatives For Micro Turbines Industry
3.9. Micro Turbines Market Trade Analysis
3.10. The Global Pandemic Impact on Micro Turbines Market
4. Micro Turbines Market: Global Market Size and Forecast by Segmentation (in USD Mn.) 2025-2032
4.1. Micro Turbines Market Size and Forecast, by Power Rating (2025-2032)
4.1.1. 12 kW–50 kW
4.1.2. 50 kW–250 kW
4.1.3. 250 kW–500 kW
4.2. Micro Turbines Market Size and Forecast, by Fuel Type (2025-2032)
4.2.1. Natural Gas
4.2.2. Biogas
4.2.3. Diesel
4.2.4. Propane
4.2.5. Hydrogen
4.3. Micro Turbines Market Size and Forecast, by Component (2025-2032)
4.3.1. Turbine Housing & Enclosures
4.3.2. Combustion Chamber
4.3.3. Heat Exchangers & CHP Units
4.3.4. Fuel System & Piping
4.3.5. Electrical & Control Systems
4.3.6. Exhaust & Emission Systems
4.4. Micro Turbines Market Size and Forecast, by Application (2025-2032)
4.4.1. Combined Heat and Power (CHP)
4.4.2. Power Generation
4.4.3. Standby / Backup Power
4.4.4. Waste Heat Recovery
4.4.5. Remote Power Generation
4.4.6. Others
4.5. Micro Turbines Market Size and Forecast, by End-Use Industry (2025-2032)
4.5.1. Industrial
4.5.2. Commercial
4.5.3. Residential
4.5.4. Telecommunications
4.5.5. Transportation
4.5.6. Waste Management
4.5.7. Others
4.6. Micro Turbines Market Size and Forecast, by Region (2025-2032)
4.6.1. North America
4.6.2. Europe
4.6.3. Asia Pacific
4.6.4. Middle East and Africa
4.6.5. South America
5. North America Micro Turbines Market Size and Forecast by Segmentation (in USD Mn.) 2025-2032
5.1. North America Micro Turbines Market Size and Forecast, by Power Rating (2025-2032)
5.1.1. 12 kW–50 kW
5.1.2. 50 kW–250 kW
5.1.3. 250 kW–500 kW
5.2. North America Micro Turbines Market Size and Forecast, by Fuel Type (2025-2032)
5.2.1. Natural Gas
5.2.2. Biogas
5.2.3. Diesel
5.2.4. Propane
5.2.5. Hydrogen
5.3. North America Micro Turbines Market Size and Forecast, by Component (2025-2032)
5.3.1. Turbine Housing & Enclosures
5.3.2. Combustion Chamber
5.3.3. Heat Exchangers & CHP Units
5.3.4. Fuel System & Piping
5.3.5. Electrical & Control Systems
5.3.6. Exhaust & Emission Systems
5.4. North America Micro Turbines Market Size and Forecast, by Application (2025-2032)
5.4.1. Combined Heat and Power (CHP)
5.4.2. Power Generation
5.4.3. Standby / Backup Power
5.4.4. Waste Heat Recovery
5.4.5. Remote Power Generation
5.4.6. Others
5.5. North America Micro Turbines Market Size and Forecast, by End-Use Industry (2025-2032)
5.5.1. Industrial
5.5.2. Commercial
5.5.3. Residential
5.5.4. Telecommunications
5.5.5. Transportation
5.5.6. Waste Management
5.5.7. Others
5.6. North America Micro Turbines Market Size and Forecast, by Country (2025-2032)
5.6.1. United States
5.6.1.1. United States Micro Turbines Market Size and Forecast, by Power Rating (2025-2032)
5.6.1.1.1. 12 kW–50 kW
5.6.1.1.2. 50 kW–250 kW
5.6.1.1.3. 250 kW–500 kW
5.6.1.2. United States Micro Turbines Market Size and Forecast, by Fuel Type (2025-2032)
5.6.1.2.1. Natural Gas
5.6.1.2.2. Biogas
5.6.1.2.3. Diesel
5.6.1.2.4. Propane
5.6.1.2.5. Hydrogen
5.6.1.3. United States Micro Turbines Market Size and Forecast, by Component (2025-2032)
5.6.1.3.1. Turbine Housing & Enclosures
5.6.1.3.2. Combustion Chamber
5.6.1.3.3. Heat Exchangers & CHP Units
5.6.1.3.4. Fuel System & Piping
5.6.1.3.5. Electrical & Control Systems
5.6.1.3.6. Exhaust & Emission Systems
5.6.1.4. United States Micro Turbines Market Size and Forecast, by Application (2025-2032)
5.6.1.4.1. Combined Heat and Power (CHP)
5.6.1.4.2. Power Generation
5.6.1.4.3. Standby / Backup Power
5.6.1.4.4. Waste Heat Recovery
5.6.1.4.5. Remote Power Generation
5.6.1.4.6. Others
5.6.1.5. United States Micro Turbines Market Size and Forecast, by End-Use Industry (2025-2032)
5.6.1.5.1. Industrial
5.6.1.5.2. Commercial
5.6.1.5.3. Residential
5.6.1.5.4. Telecommunications
5.6.1.5.5. Transportation
5.6.1.5.6. Waste Management
5.6.1.5.7. Others
5.6.2. Canada
5.6.2.1. Canada Micro Turbines Market Size and Forecast, by Power Rating (2025-2032)
5.6.2.1.1. 12 kW–50 kW
5.6.2.1.2. 50 kW–250 kW
5.6.2.1.3. 250 kW–500 kW
5.6.2.2. Canada Micro Turbines Market Size and Forecast, by Fuel Type (2025-2032)
5.6.2.2.1. Natural Gas
5.6.2.2.2. Biogas
5.6.2.2.3. Diesel
5.6.2.2.4. Propane
5.6.2.2.5. Hydrogen
5.6.2.3. Canada Micro Turbines Market Size and Forecast, by Component (2025-2032)
5.6.2.3.1. Turbine Housing & Enclosures
5.6.2.3.2. Combustion Chamber
5.6.2.3.3. Heat Exchangers & CHP Units
5.6.2.3.4. Fuel System & Piping
5.6.2.3.5. Electrical & Control Systems
5.6.2.3.6. Exhaust & Emission Systems
5.6.2.4. Canada Micro Turbines Market Size and Forecast, by Application (2025-2032)
5.6.2.4.1. Combined Heat and Power (CHP)
5.6.2.4.2. Power Generation
5.6.2.4.3. Standby / Backup Power
5.6.2.4.4. Waste Heat Recovery
5.6.2.4.5. Remote Power Generation
5.6.2.4.6. Others
5.6.2.5. Canada Micro Turbines Market Size and Forecast, by End-Use Industry (2025-2032)
5.6.2.5.1. Industrial
5.6.2.5.2. Commercial
5.6.2.5.3. Residential
5.6.2.5.4. Telecommunications
5.6.2.5.5. Transportation
5.6.2.5.6. Waste Management
5.6.2.5.7. Others
5.6.3. Mexico
5.6.3.1. Mexico Micro Turbines Market Size and Forecast, by Power Rating (2025-2032)
5.6.3.1.1. 12 kW–50 kW
5.6.3.1.2. 50 kW–250 kW
5.6.3.1.3. 250 kW–500 kW
5.6.3.2. Mexico Micro Turbines Market Size and Forecast, by Fuel Type (2025-2032)
5.6.3.2.1. Natural Gas
5.6.3.2.2. Biogas
5.6.3.2.3. Diesel
5.6.3.2.4. Propane
5.6.3.2.5. Hydrogen
5.6.3.3. Mexico Micro Turbines Market Size and Forecast, by Component (2025-2032)
5.6.3.3.1. Turbine Housing & Enclosures
5.6.3.3.2. Combustion Chamber
5.6.3.3.3. Heat Exchangers & CHP Units
5.6.3.3.4. Fuel System & Piping
5.6.3.3.5. Electrical & Control Systems
5.6.3.3.6. Exhaust & Emission Systems
5.6.3.4. Mexico Micro Turbines Market Size and Forecast, by Application (2025-2032)
5.6.3.4.1. Combined Heat and Power (CHP)
5.6.3.4.2. Power Generation
5.6.3.4.3. Standby / Backup Power
5.6.3.4.4. Waste Heat Recovery
5.6.3.4.5. Remote Power Generation
5.6.3.4.6. Others
5.6.3.5. Mexico Micro Turbines Market Size and Forecast, by End-Use Industry (2025-2032)
5.6.3.5.1. Industrial
5.6.3.5.2. Commercial
5.6.3.5.3. Residential
5.6.3.5.4. Telecommunications
5.6.3.5.5. Transportation
5.6.3.5.6. Waste Management
5.6.3.5.7. Others
6. Europe Micro Turbines Market Size and Forecast by Segmentation (in USD Mn.) 2025-2032
6.1. Europe Micro Turbines Market Size and Forecast, by Power Rating (2025-2032)
6.2. Europe Micro Turbines Market Size and Forecast, by Fuel Type (2025-2032)
6.3. Europe Micro Turbines Market Size and Forecast, by Component (2025-2032)
6.4. Europe Micro Turbines Market Size and Forecast, by Application (2025-2032)
6.5. Europe Micro Turbines Market Size and Forecast, by End-Use Industry (2025-2032)
6.6. Europe Micro Turbines Market Size and Forecast, by Country (2025-2032)
6.6.1. United Kingdom
6.6.1.1. United Kingdom Micro Turbines Market Size and Forecast, by Power Rating (2025-2032)
6.6.1.2. United Kingdom Micro Turbines Market Size and Forecast, by Fuel Type (2025-2032)
6.6.1.3. United Kingdom Micro Turbines Market Size and Forecast, by Component (2025-2032)
6.6.1.4. United Kingdom Micro Turbines Market Size and Forecast, by Application (2025-2032)
6.6.1.5. United Kingdom Micro Turbines Market Size and Forecast, by End-Use Industry (2025-2032)
6.6.2. France
6.6.2.1. France Micro Turbines Market Size and Forecast, by Power Rating (2025-2032)
6.6.2.2. France Micro Turbines Market Size and Forecast, by Fuel Type (2025-2032)
6.6.2.3. France Micro Turbines Market Size and Forecast, by Component (2025-2032)
6.6.2.4. France Micro Turbines Market Size and Forecast, by Application (2025-2032)
6.6.2.5. France Micro Turbines Market Size and Forecast, by End-Use Industry (2025-2032)
6.6.3. Germany
6.6.3.1. Germany Micro Turbines Market Size and Forecast, by Power Rating (2025-2032)
6.6.3.2. Germany Micro Turbines Market Size and Forecast, by Fuel Type (2025-2032)
6.6.3.3. Germany Micro Turbines Market Size and Forecast, by Component (2025-2032)
6.6.3.4. Germany Micro Turbines Market Size and Forecast, by Application (2025-2032)
6.6.3.5. Germany Micro Turbines Market Size and Forecast, by End-Use Industry (2025-2032)
6.6.4. Italy
6.6.4.1. Italy Micro Turbines Market Size and Forecast, by Power Rating (2025-2032)
6.6.4.2. Italy Micro Turbines Market Size and Forecast, by Fuel Type (2025-2032)
6.6.4.3. Italy Micro Turbines Market Size and Forecast, by Component (2025-2032)
6.6.4.4. Italy Micro Turbines Market Size and Forecast, by Application (2025-2032)
6.6.4.5. Italy Micro Turbines Market Size and Forecast, by End-Use Industry (2025-2032)
6.6.5. Spain
6.6.5.1. Spain Micro Turbines Market Size and Forecast, by Power Rating (2025-2032)
6.6.5.2. Spain Micro Turbines Market Size and Forecast, by Fuel Type (2025-2032)
6.6.5.3. Spain Micro Turbines Market Size and Forecast, by Component (2025-2032)
6.6.5.4. Spain Micro Turbines Market Size and Forecast, by Application (2025-2032)
6.6.5.5. Spain Micro Turbines Market Size and Forecast, by End-Use Industry (2025-2032)
6.6.6. Sweden
6.6.6.1. Sweden Micro Turbines Market Size and Forecast, by Power Rating (2025-2032)
6.6.6.2. Sweden Micro Turbines Market Size and Forecast, by Fuel Type (2025-2032)
6.6.6.3. Sweden Micro Turbines Market Size and Forecast, by Component (2025-2032)
6.6.6.4. Sweden Micro Turbines Market Size and Forecast, by Application (2025-2032)
6.6.6.5. Sweden Micro Turbines Market Size and Forecast, by End-Use Industry (2025-2032)
6.6.7. Austria
6.6.7.1. Austria Micro Turbines Market Size and Forecast, by Power Rating (2025-2032)
6.6.7.2. Austria Micro Turbines Market Size and Forecast, by Fuel Type (2025-2032)
6.6.7.3. Austria Micro Turbines Market Size and Forecast, by Component (2025-2032)
6.6.7.4. Austria Micro Turbines Market Size and Forecast, by Application (2025-2032)
6.6.7.5. Austria Micro Turbines Market Size and Forecast, by End-Use Industry (2025-2032)
6.6.8. Rest of Europe
6.6.8.1. Rest of Europe Micro Turbines Market Size and Forecast, by Power Rating (2025-2032)
6.6.8.2. Rest of Europe Micro Turbines Market Size and Forecast, by Fuel Type (2025-2032)
6.6.8.3. Rest of Europe Micro Turbines Market Size and Forecast, by Component (2025-2032)
6.6.8.4. Rest of Europe Micro Turbines Market Size and Forecast, by Application (2025-2032)
6.6.8.5. Rest of Europe Micro Turbines Market Size and Forecast, by End-Use Industry (2025-2032)
7. Asia Pacific Micro Turbines Market Size and Forecast by Segmentation (in USD Mn.) 2025-2032
7.1. Asia Pacific Micro Turbines Market Size and Forecast, by Power Rating (2025-2032)
7.2. Asia Pacific Micro Turbines Market Size and Forecast, by Fuel Type (2025-2032)
7.3. Asia Pacific Micro Turbines Market Size and Forecast, by Component (2025-2032)
7.4. Asia Pacific Micro Turbines Market Size and Forecast, by Application (2025-2032)
7.5. Asia Pacific Micro Turbines Market Size and Forecast, by End-Use Industry (2025-2032)
7.6. Asia Pacific Micro Turbines Market Size and Forecast, by Country (2025-2032)
7.6.1. China
7.6.1.1. China Micro Turbines Market Size and Forecast, by Power Rating (2025-2032)
7.6.1.2. China Micro Turbines Market Size and Forecast, by Fuel Type (2025-2032)
7.6.1.3. China Micro Turbines Market Size and Forecast, by Component (2025-2032)
7.6.1.4. China Micro Turbines Market Size and Forecast, by Application (2025-2032)
7.6.1.5. China Micro Turbines Market Size and Forecast, by End-Use Industry (2025-2032)
7.6.2. S Korea
7.6.2.1. S Korea Micro Turbines Market Size and Forecast, by Power Rating (2025-2032)
7.6.2.2. S Korea Micro Turbines Market Size and Forecast, by Fuel Type (2025-2032)
7.6.2.3. S Korea Micro Turbines Market Size and Forecast, by Component (2025-2032)
7.6.2.4. S Korea Micro Turbines Market Size and Forecast, by Application (2025-2032)
7.6.2.5. S Korea Micro Turbines Market Size and Forecast, by End-Use Industry (2025-2032)
7.6.3. Japan
7.6.3.1. Japan Micro Turbines Market Size and Forecast, by Power Rating (2025-2032)
7.6.3.2. Japan Micro Turbines Market Size and Forecast, by Fuel Type (2025-2032)
7.6.3.3. Japan Micro Turbines Market Size and Forecast, by Component (2025-2032)
7.6.3.4. Japan Micro Turbines Market Size and Forecast, by Application (2025-2032)
7.6.3.5. Japan Micro Turbines Market Size and Forecast, by End-Use Industry (2025-2032)
7.6.4. India
7.6.4.1. India Micro Turbines Market Size and Forecast, by Power Rating (2025-2032)
7.6.4.2. India Micro Turbines Market Size and Forecast, by Fuel Type (2025-2032)
7.6.4.3. India Micro Turbines Market Size and Forecast, by Component (2025-2032)
7.6.4.4. India Micro Turbines Market Size and Forecast, by Application (2025-2032)
7.6.4.5. India Micro Turbines Market Size and Forecast, by End-Use Industry (2025-2032)
7.6.5. Australia
7.6.5.1. Australia Micro Turbines Market Size and Forecast, by Power Rating (2025-2032)
7.6.5.2. Australia Micro Turbines Market Size and Forecast, by Fuel Type (2025-2032)
7.6.5.3. Australia Micro Turbines Market Size and Forecast, by Component (2025-2032)
7.6.5.4. Australia Micro Turbines Market Size and Forecast, by Application (2025-2032)
7.6.5.5. Australia Micro Turbines Market Size and Forecast, by End-Use Industry (2025-2032)
7.6.6. Indonesia
7.6.6.1. Indonesia Micro Turbines Market Size and Forecast, by Power Rating (2025-2032)
7.6.6.2. Indonesia Micro Turbines Market Size and Forecast, by Fuel Type (2025-2032)
7.6.6.3. Indonesia Micro Turbines Market Size and Forecast, by Component (2025-2032)
7.6.6.4. Indonesia Micro Turbines Market Size and Forecast, by Application (2025-2032)
7.6.6.5. Indonesia Micro Turbines Market Size and Forecast, by End-Use Industry (2025-2032)
7.6.7. Malaysia
7.6.7.1. Malaysia Micro Turbines Market Size and Forecast, by Power Rating (2025-2032)
7.6.7.2. Malaysia Micro Turbines Market Size and Forecast, by Fuel Type (2025-2032)
7.6.7.3. Malaysia Micro Turbines Market Size and Forecast, by Component (2025-2032)
7.6.7.4. Malaysia Micro Turbines Market Size and Forecast, by Application (2025-2032)
7.6.7.5. Malaysia Micro Turbines Market Size and Forecast, by End-Use Industry (2025-2032)
7.6.8. Vietnam
7.6.8.1. Vietnam Micro Turbines Market Size and Forecast, by Power Rating (2025-2032)
7.6.8.2. Vietnam Micro Turbines Market Size and Forecast, by Fuel Type (2025-2032)
7.6.8.3. Vietnam Micro Turbines Market Size and Forecast, by Component (2025-2032)
7.6.8.4. Vietnam Micro Turbines Market Size and Forecast, by Application (2025-2032)
7.6.8.5. Vietnam Micro Turbines Market Size and Forecast, by End-Use Industry (2025-2032)
7.6.9. Taiwan
7.6.9.1. Taiwan Micro Turbines Market Size and Forecast, by Power Rating (2025-2032)
7.6.9.2. Taiwan Micro Turbines Market Size and Forecast, by Fuel Type (2025-2032)
7.6.9.3. Taiwan Micro Turbines Market Size and Forecast, by Component (2025-2032)
7.6.9.4. Taiwan Micro Turbines Market Size and Forecast, by Application (2025-2032)
7.6.9.5. Taiwan Micro Turbines Market Size and Forecast, by End-Use Industry (2025-2032)
7.6.10. Rest of Asia Pacific
7.6.10.1. Rest of Asia Pacific Micro Turbines Market Size and Forecast, by Power Rating (2025-2032)
7.6.10.2. Rest of Asia Pacific Micro Turbines Market Size and Forecast, by Fuel Type (2025-2032)
7.6.10.3. Rest of Asia Pacific Micro Turbines Market Size and Forecast, by Component (2025-2032)
7.6.10.4. Rest of Asia Pacific Micro Turbines Market Size and Forecast, by Application (2025-2032)
7.6.10.5. Rest of Asia Pacific Micro Turbines Market Size and Forecast, by End-Use Industry (2025-2032)
8. Middle East and Africa Micro Turbines Market Size and Forecast by Segmentation (in USD Mn.) 2025-2032
8.1. Middle East and Africa Micro Turbines Market Size and Forecast, by Power Rating (2025-2032)
8.2. Middle East and Africa Micro Turbines Market Size and Forecast, by Fuel Type (2025-2032)
8.3. Middle East and Africa Micro Turbines Market Size and Forecast, by Component (2025-2032)
8.4. Middle East and Africa Micro Turbines Market Size and Forecast, by Application (2025-2032)
8.5. Middle East and Africa Micro Turbines Market Size and Forecast, by End-Use Industry (2025-2032)
8.6. Middle East and Africa Micro Turbines Market Size and Forecast, by Country (2025-2032)
8.6.1. South Africa
8.6.1.1. South Africa Micro Turbines Market Size and Forecast, by Power Rating (2025-2032)
8.6.1.2. South Africa Micro Turbines Market Size and Forecast, by Fuel Type (2025-2032)
8.6.1.3. South Africa Micro Turbines Market Size and Forecast, by Component (2025-2032)
8.6.1.4. South Africa Micro Turbines Market Size and Forecast, by Application (2025-2032)
8.6.1.5. South Africa Micro Turbines Market Size and Forecast, by End-Use Industry (2025-2032)
8.6.2. GCC
8.6.2.1. GCC Micro Turbines Market Size and Forecast, by Power Rating (2025-2032)
8.6.2.2. GCC Micro Turbines Market Size and Forecast, by Fuel Type (2025-2032)
8.6.2.3. GCC Micro Turbines Market Size and Forecast, by Component (2025-2032)
8.6.2.4. GCC Micro Turbines Market Size and Forecast, by Application (2025-2032)
8.6.2.5. GCC Micro Turbines Market Size and Forecast, by End-Use Industry (2025-2032)
8.6.3. Nigeria
8.6.3.1. Nigeria Micro Turbines Market Size and Forecast, by Power Rating (2025-2032)
8.6.3.2. Nigeria Micro Turbines Market Size and Forecast, by Fuel Type (2025-2032)
8.6.3.3. Nigeria Micro Turbines Market Size and Forecast, by Component (2025-2032)
8.6.3.4. Nigeria Micro Turbines Market Size and Forecast, by Application (2025-2032)
8.6.3.5. Nigeria Micro Turbines Market Size and Forecast, by End-Use Industry (2025-2032)
8.6.4. Rest of ME&A
8.6.4.1. Rest of ME&A Micro Turbines Market Size and Forecast, by Power Rating (2025-2032)
8.6.4.2. Rest of ME&A Micro Turbines Market Size and Forecast, by Fuel Type (2025-2032)
8.6.4.3. Rest of ME&A Micro Turbines Market Size and Forecast, by Component (2025-2032)
8.6.4.4. Rest of ME&A Micro Turbines Market Size and Forecast, by Application (2025-2032)
8.6.4.5. Rest of ME&A Micro Turbines Market Size and Forecast, by End-Use Industry (2025-2032)
9. South America Micro Turbines Market Size and Forecast by Segmentation (in USD Mn.) 2025-2032
9.1. South America Micro Turbines Market Size and Forecast, by Power Rating (2025-2032)
9.2. South America Micro Turbines Market Size and Forecast, by Fuel Type (2025-2032)
9.3. South America Micro Turbines Market Size and Forecast, by Component (2025-2032)
9.4. South America Micro Turbines Market Size and Forecast, by Application (2025-2032)
9.5. South America Micro Turbines Market Size and Forecast, by End-Use Industry (2025-2032)
9.6. South America Micro Turbines Market Size and Forecast, by Country (2025-2032)
9.6.1. Brazil
9.6.1.1. Brazil Micro Turbines Market Size and Forecast, by Power Rating (2025-2032)
9.6.1.2. Brazil Micro Turbines Market Size and Forecast, by Fuel Type (2025-2032)
9.6.1.3. Brazil Micro Turbines Market Size and Forecast, by Component (2025-2032)
9.6.1.4. Brazil Micro Turbines Market Size and Forecast, by Application (2025-2032)
9.6.1.5. Brazil Micro Turbines Market Size and Forecast, by End-Use Industry (2025-2032)
9.6.2. Argentina
9.6.2.1. Argentina Micro Turbines Market Size and Forecast, by Power Rating (2025-2032)
9.6.2.2. Argentina Micro Turbines Market Size and Forecast, by Fuel Type (2025-2032)
9.6.2.3. Argentina Micro Turbines Market Size and Forecast, by Component (2025-2032)
9.6.2.4. Argentina Micro Turbines Market Size and Forecast, by Application (2025-2032)
9.6.2.5. Argentina Micro Turbines Market Size and Forecast, by End-Use Industry (2025-2032)
9.6.3. Rest Of South America
9.6.3.1. Rest Of South America Micro Turbines Market Size and Forecast, by Power Rating (2025-2032)
9.6.3.2. Rest Of South America Micro Turbines Market Size and Forecast, by Fuel Type (2025-2032)
9.6.3.3. Rest Of South America Micro Turbines Market Size and Forecast, by Component (2025-2032)
9.6.3.4. Rest Of South America Micro Turbines Market Size and Forecast, by Application (2025-2032)
9.6.3.5. Rest Of South America Micro Turbines Market Size and Forecast, by End-Use Industry (2025-2032)
10. Company Profile: Key Players
10.1. North America:
10.1.1. Company Overview
10.1.2. Business Portfolio
10.1.3. Financial Overview
10.1.4. SWOT Analysis
10.1.5. Strategic Analysis
10.1.6. Scale of Operation (small, medium, and large)
10.1.7. Details on Partnership
10.1.8. Regulatory Accreditations and Certifications Received by Them
10.1.9. Awards Received by the Firm
10.1.10. Recent Developments
10.2. Capstone Green Energy Corporation
10.3. FlexEnergy Solutions
10.4. Brayton Energy
10.5. LLC
10.6. Dresser-Rand (Siemens Energy)
10.7. Calnetix Technologies LLC
10.8. ICR Turbine Engine Corporation
10.9. Turbine Technologies Ltd.
10.10. UAV Turbine Inc.
10.11. Wilson Solarpower Corporation
10.12. Turbine Generator Maintenance Inc.
10.13. Turbine Power Systems
10.14. Ecovent
10.15. Others
10.16. Europe:
10.17. Ansaldo Energia S.p.A. (Italy)
10.18. MAN Energy Solutions (Germany)
10.19. Aurelia Turbines Oy (Finland)
10.20. Bladon Technologies Ltd. (U.K.)
10.21. Centrax Gas Turbines Ltd. (U.K.)
10.22. Micro Turbine Technology B.V. (Netherlands)
10.23. Advanced Microturbines Srl (Italy)
10.24. Bladon Micro Turbine (U.K.)
10.25. Eneftech Innovation (Europe-based operations)
10.26. Microturbine Systems Ltd.
10.27. Asia-Pacific:
10.28. Mitsubishi Power (Japan)
10.29. Kawasaki Heavy Industries Ltd. (Japan)
10.30. Toyota Turbine and Systems Inc. (Japan)
10.31. Harbin Electric Corporation (China)
10.32. Bharat Heavy Electricals Limited (BHEL) (India)
10.33. Shenyang Blower Works Group (China)
10.34. Daihatsu Diesel Mfg. Co.
10.35. Ltd. (Japan)
10.36. Turbotech Precision Engineering Pvt. Ltd. (India)
10.37. Distributed Energy System OEMs (China cluster)
10.38. Middle East & Africa:
10.39. Turbomach SA (South Africa)
10.40. Sulzer Energy (UAE)
11. Key Findings
12. Industry Recommendations
13. Micro Turbines Market: Research Methodology
14. Terms and Glossary

Custom Market Research Services

We Will Customise The Research For You, In Case The Report Listed Above Does Not Meet With Your Requirements