
Active Pharmaceutical Ingredients Market Size by Synthesis Type, Drug Type, Manufacturer Type, Therapeutic Area, Region, Industry-Wide Analysis, Competitive Landscape Assessment & Long-Term Forecast to 2032
Overview
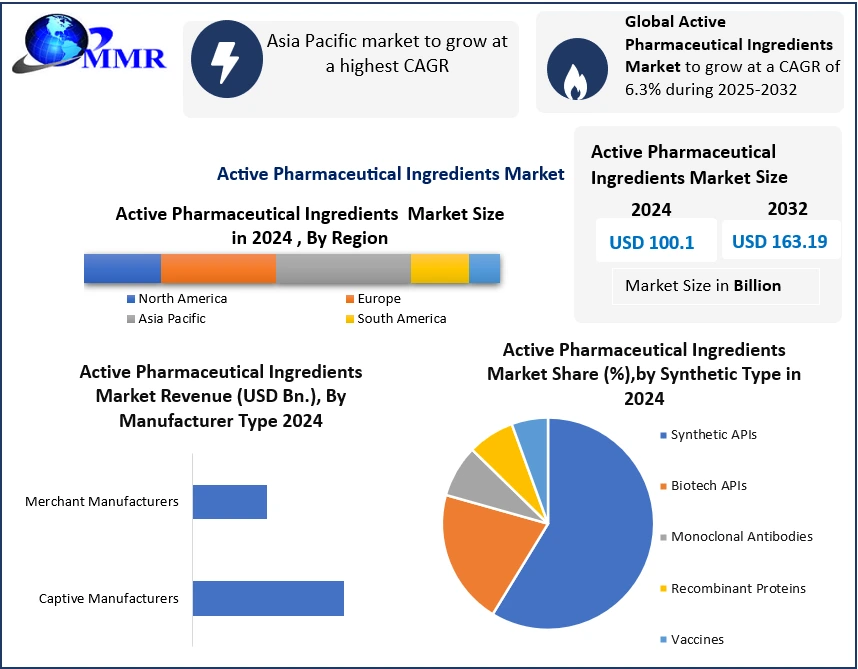
Global Active Pharmaceutical Ingredients Market size was valued at USD 100.1 Billion in 2024, and the total Active Pharmaceutical Ingredients Market revenue is expected to grow by 6.3% from 2025 to 2032, reaching nearly USD 163.19 Billion.
Active Pharmaceutical Ingredients Market Overview
Active Pharmaceutical Ingredients (APIs) form the backbone of the pharmaceutical industry, providing the therapeutic effects that drive patient outcomes. Today, the API market is evolving rapidly, influenced by technological innovations, AI-assisted drug discovery, continuous manufacturing, and precision synthesis. These advancements are enabling manufacturers to deliver products that are more consistent, higher in quality, and produced at faster rates. Global demand for specialized therapies—ranging from precision medicines to biologics and chronic condition treatments—is reshaping the API industry.
 To know about the Research Methodology :- Request Free Sample Report
Manufacturers are increasingly prioritizing high-quality standards, accelerated production timelines, and strict regulatory compliance to meet the expectations of global healthcare providers and patients. From a production perspective, India and China continue to dominate API supply globally, benefiting from cost-effective manufacturing, skilled labor, and extensive Good Manufacturing Practices (GMP) infrastructure. Meanwhile, North America and Europe are seeing a strategic push toward domestic API production, accelerated by post-COVID-19 initiatives aimed at building resilient supply chains. U.S. federal programs targeting supply chain security and self-reliance are also creating incentives to reduce dependency on overseas suppliers. The product mix within the API market is also shifting. While traditional small-molecule APIs remain significant, there is noticeable growth in APIs for biologics, peptides, and specialty therapies, particularly in oncology, autoimmune disorders, and rare diseases. Leading API producers—including Teva API, Dr. Reddy's API, Pfizer CentreOne, and Lonza—are leveraging AI, advanced purification technologies, and partnerships with biotech and Contract Development and Manufacturing Organizations (CDMOs) to enhance production capabilities and meet complex market demands.
Active Pharmaceutical Ingredients Market Dynamics
Chronic Disease Treatments to Drive Active Pharmaceutical Ingredients Market Growth
The global rise in chronic conditions-such as diabetes, cancer, cardiovascular diseases, and autoimmune diseases-is increasing demand for APIMs at an alarming rate. An aging population and improvement of healthcare access worldwide has led to rapid growth in the pharmaceutical market, which is pursued further by high-potency active pharmaceutical ingredients (HPAPIs) and personalized and targeted therapies leading to sustained growth in market demand.
Supply Chain Resilience and Onshoring Initiatives to Drive the Active Pharmaceutical Ingredients Market
In the aftermath of COVID-19, pharmaceutical supply chains faced dramatic and unreal disruptions, and the industry has begun to shift its supplier’s production of API back to North America, Europe, and other areas. To mitigate its dependency on foreign sourcing-leading to increased dependence on supply from China and India-governments worldwide are incentivizing local sourcing for companies. Although these changes have implications for the changing landscape of sourcing, they are providing new opportunities for domestic companies and supporting global resilience in pharmaceuticals.
Regulatory Compliance and High Production Costs to restrain Active Pharmaceutical Ingredients Market
Despite the apparent growth opportunities in the API manufacturing arena, it has obviously not been an all roses proposition given a complex regulatory regime, stringent environmental compliance, and sharply rising production costs. API manufacturers must navigate recent standards imposed by the FDA, EMA, and any other relevant regulatory authority to bring appropriate products to market, which can dramatically limit competition to market entry - especially for smaller and mid-sized producers. In addition, the capital-intensive nature of API manufacturing dramatically reduces scalability and access for other market participants.
Active Pharmaceutical Ingredients Market Segment Analysis
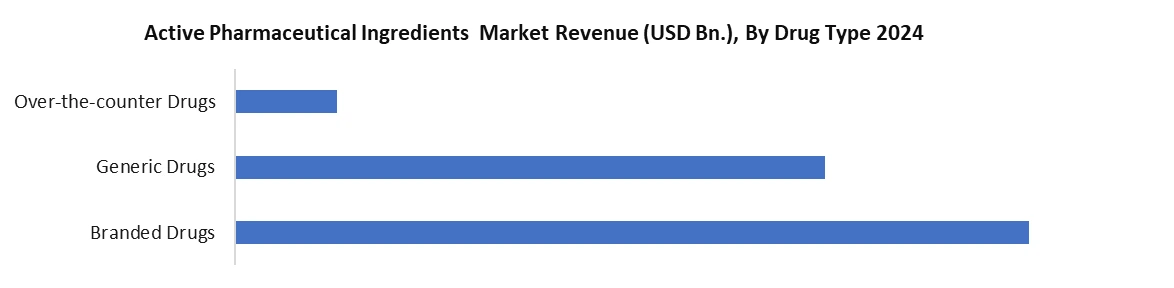
Based on Drug Type, the Active Pharmaceutical Ingredients (API) market is segmented into drug type including Branded Drugs, Generic Drugs and Over-the-Counter (OTC) Drugs. Branded Drugs provide high-value growth through the use of high-complexity API's like biologics and HPAPI's, supported by strong R&D and regulatory in developed markets. Generic Drugs are volume driven mostly by the need for affordable medicine once the patent has expired, and this is especially true in emerging economies. OTC is increasing also due to self-medication practices, as well as improved consumer health consciousness awareness, resulting in high volume demand of APIs to treat the majority of most of these common ailments. Collectively, these API segments provide balance to the overall growth of the API market.
Active Pharmaceutical Ingredients Market Competitive Landscape:
Teva Active Pharmaceutical Ingredients (Israel) and Dr. Reddy's Laboratories (India) are two key players in the global API marketplace. They each tap into API production and supply with an equivalent vision through an integrated lens; Teva is a leading and generalist API supplier with a significant API portfolio in multiple therapeutic areas or markets (e.g., oncology, cardiovascular, and CNS). Teva generally behaves as a dominant API supplier according to market share, using their vertically integrated business model, regulatory requirements (i.e., FDA, EMA), and distribution to meet the needs of both generic and branded manufacturers throughout the world.
Dr. Reddy's has taken a high-quality, low-cost position as an API, and distinctly bases strategy on a backward (broadly) integrated vision and sustainability. All innovation at Dr. Reddy's seeks to green the chemistry and process of production, while also remaining capacity oriented during changing patent timelines. Dr. Reddy's undertakes R&D facilities in both India and Europe, enabling speedy development and custom synthesis, especially for generics that might be complex or in areas with limited therapeutics.
Teva relies on and is using reliability-based standards, and volume capacity to penetrate growth in established markets. Conversely, Dr. Reddy's is using agility and are capacity oriented in price sensitive emerging markets. The volume of operational capacity and price (essentially, mark-up on price) brings both players towards a comparable path with their operational flexibility - but both organisations show different pricing and partnership strategies - Teva's is reliability and strength of supply chains and reliability, and for branded manufacturers globally, Dr. Reddy's is for pricing (affordability) and precision at more or less high standards (of API) in product diversity or differences in therapeutic outcome.
Active Pharmaceutical Ingredients Market Key Developments:
Feb-2025-Eli Lilly-USA
In the last three years, to exceed 50B USD in U.S. manufacturing investments, we have built four new U.S. pharmaceutical sites, each focused on their processes to manufacture active pharmaceutical ingredients and injectable therapies. These investments are expected to create 13,000 jobs overall, and represent the largest singular pharma manufacturing investments in U.S. history.
Feb-2025-Eli Lilly-USA
To develop three U.S. plants for pharmaceutical ingredient development, aiming to reshore essential segments of the drug supply chain now supplied primarily through foreign sourcing, enhanced domestic manufacturing resilience.
Apr-2025-Novartis
USA-To committed 23B USD over 5 years expanding US manufacturing and R&D with 10 facilities including 7 new locations has indicated it is doing this to acquire 100 % of important medications made in the US and a new R&D site in San Diego.
Active Pharmaceutical Ingredients Market Key Trends:
More Outsourcing to (CMOs): Pharmaceutical companies are increasing outsourcing API production to CMOs to decrease costs, optimize their capabilities and focus on areas of primary expertise, drug development and commercialization.
More Biopharmaceutical APIs: There is a preference for biopharmaceutical APIs, powered by advances in biotechnology, including more complex therapies like monoclonal antibodies and recombinant proteins.
More Quality and Regulatory Compliance: Regulatory agencies across the globe are tightening standards on API manufacturing, including GMP quality standards and compliance, product safety, and product quality.
Scope of the Active Pharmaceutical Ingredients Market Report: Inquire before buying
| Global Active Pharmaceutical Ingredients Market | |||
|---|---|---|---|
| Report Coverage | Details | ||
| Base Year: | 2024 | Forecast Period: | 2025-2032 |
| Historical Data: | 2019 to 2024 | Market Size in 2024: | USD 100.1 Bn. |
| Forecast Period 2025 to 2032 CAGR: | 6.3 | Market Size in 2032: | USD 163.19 Bn. |
| Segments Covered: | by Synthesis Type | Biotech Monoclonal Antibodies Recombinant Proteins Vaccines Synthetic |
|
| by Drug Type | Branded Drugs Generic Drugs Over-the-counter (OTC) Drugs |
||
| by Manufacturer Type | Captive Manufacturers Merchant Manufacturers |
||
| by Therapeutic Area | Cardiology Pulmonology Opthalmology Neurology Oncology Orthopedics |
||
Active Pharmaceutical Ingredients Market, by Region
North America (United States, Canada, and Mexico)
Europe (UK, France, Germany, Italy, Spain, Sweden, Austria, and the Rest of Europe)
Asia Pacific (China, South Korea, Japan, India, Australia, Indonesia, Malaysia, Vietnam, Taiwan, Bangladesh, Pakistan, and the Rest of APAC)
Middle East and Africa (South Africa, GCC, Egypt, Nigeria, and the Rest of ME&A)
South America (Brazil, Argentina Rest of South America)
Active Pharmaceutical Ingredients Market, Key Players
North America
1. United States
2. Cambrex Corporation
3. Catalent Pharma Solutions
4. Patheon (Thermo Fisher Scientific)
5. AbbVie Inc. (USA)
6. Hospira Inc. (USA)
Europe
1. Switzerland
2. Lonza Group
3. Siegfried Holding AG
4. EuroAPI
5. Bachem
6. Corden Pharma
7. Evonik Industries
8. EuroAPI (Headquarters)
9. Denmark
10. AGC Biologics
11. Bristol-Myers Squibb (Ireland)
12. Xellia Pharmaceuticals (Europe)
Asia-Pacific
1. India
2. Dr. Reddy’s Laboratories
3. Aurobindo Pharma
4. Sun Pharmaceutical Industries
5. Neuland Laboratories
6. Granules India
7. Unichem Laboratories
8. Alkem Laboratories
9. Jubilant Life Sciences
10. WuXi AppTec
11. CSPC Pharmaceutical Group
12. Zhejiang Hisun Pharmaceutical
13. Fosun Pharma
14. Sino Biopharmaceutical
15. Samsung Biologics
16. Astellas Pharma Inc. (Japan)
17. Takeda Pharmaceutical Company (Japan)
18. Lupin Limited (India)
19. Cipla Inc. (India)
Middle East
1. Teva API
Frequently Asked Questions
1. What factors are driving the growth of the API market?
Ans: Factors such as increasing prevalence of chronic diseases, growing generic drug market, and rising demand for biopharmaceuticals are driving the growth of the API market.
2. Which region dominated the API market in terms of market share?
Ans: Asia Pacific currently dominated the API market, with a significant market share attributed to the presence of major pharmaceutical manufacturing hubs.
3. What are some key challenges faced by the API market?
Ans: Active Pharmaceutical Ingredients ensures that every user and device, regardless of location, undergoes strict authentication and authorization, reducing the risk of unauthorized access and data breaches in remote work scenarios.
4. What challenges does the Active Pharmaceutical Ingredients market face?
Ans: Challenges include stringent regulatory requirements, quality compliance issues, and the increasing cost of API production.
5. How is the market responding to the trend of outsourcing API manufacturing?
Ans: There is a notable trend of pharmaceutical companies outsourcing API manufacturing to reduce costs and focus on core competencies.