
Water Transport Market Size by Type, Vessel Type, Propulsion, Application and Region – Segment-Level Market Assessment, Growth Opportunity Analysis, Competitive Mapping & Forecast to 2032
Overview
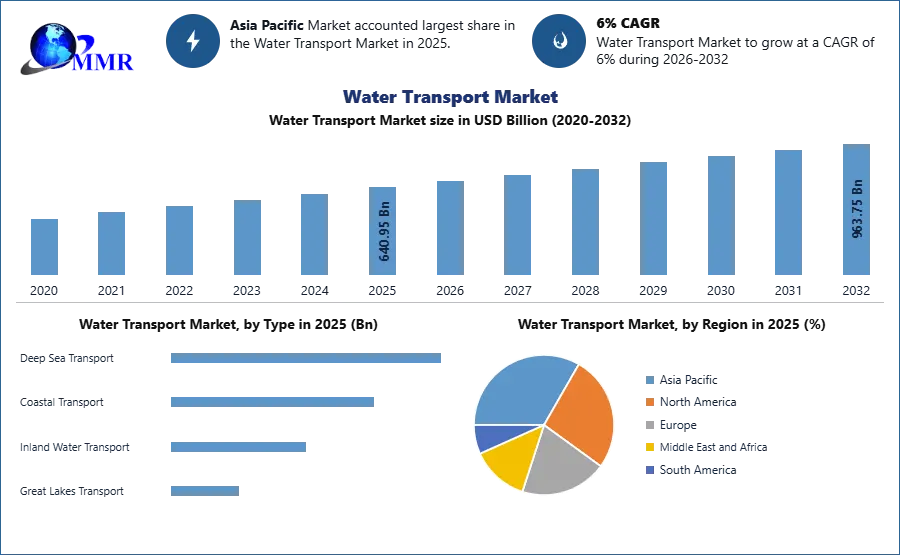
The Water Transport Market was valued at USD 640.95 Bn in 2025, and the total revenue of the Water Transport Market is expected to grow at a CAGR of 6% from 2026 to 2032, reaching nearly USD 963.75 Bn by 2032. Increased demand for affordable logistics fuels market expansion.
Water Transport Market Overview:
Water transportation has been an important ways of transporting commodities, products, and people. Ships now transport important commodities such as coal, oil, and gas to drive the global economy. Growing use of the water transport for transporting the commodities drive the Water Transport Market growth. Waterways carried around 1.2 million metric tonnes of coal and over 1.9 million metric tonnes of oil in 2020 alone. Even more crucial, over 80% of all commodities are moved by sea, primarily by container ships.
Ships have a considerable capacity compared to other forms of freight transport, making them more cheap and suited for moving large, heavy, and bulky products while emitting comparatively little pollutants. Shipping contributed for roughly 11% of global transportation emissions in 2018, less than road and air transport.
Water transportation is undoubtedly one of the most difficult modes of transportation. It involves several partners, including carriers, ports, tug operators, and freight forwarders, all of whom must work together for the supply chain to function well.
 To know about the Research Methodology :- Request Free Sample Report
Research Methodology
The study provides high-quality insights and is the result of comprehensive secondary research, rigorous primary interviews with industry stakeholders, and validation and triangulation with internal databases and statistical tools. Accuracy is guaranteed throughout all of the report's various analyzed Water Transport market categories thanks to data triangulation across several data points. The logical, scientific, and mathematical coherence of the quantitative data is ensured by the employment of both a top-down and bottom-up technique for market evaluation.
More than 1,000 verified secondary sources, including corporate annual reports, fact books, press releases, journals, investor presentations, white papers, patents, and articles, were used to collect the data. More than ten extensive primary interviews with market actors across the value chain in all four areas, as well as industry experts, were conducted to acquire both qualitative and quantitative insights.
The company does in-depth market research from both the supply and demand sides, allowing us to deliver precise data on the whole ecosystem for any research. The study's final results are arrived at using Bottom-Up methodology.
Water Transport Market Dynamics
Market Drivers:
Water transport market has driven by the demand for affordable cargo transportation. Because of the disparity in fare pricing compared to other means of transportation, water freight is typically seen as affordable and cheap for heavy items. The cubic meter of the typical container is frequently used to determine the fee for water transportation. In contrast, the charged weight for air transportation is determined by taking into account both the size and weight of the cargo.
In 2000, products worth around $736 billion were transported by ocean boats, according to the U.S. Department of Transportation. By 2022, it's anticipated that foreign trade within the US would treble, with the bulk of that trade moving via ocean shipping. According to the World Bank, which is a major financier of India's National Waterway Project, the cost of transporting one tonne of freight over 100 kilometers via roadways is around $3.07, via railways is around $1.93, and via waterways is around $1.62, making waterways the most cost-effective mode of cargo transportation in India.
Sensor technologies are increasingly being used by water transportation service providers to monitor ships in remote regions. A sensor is a device that detects and reacts to input from the physical world. The specific input may be light, heat, motion, wetness, pressure, or any of the ship's other environmental phenomena. Sensors in ships' distant locations collect data independently and communicate it to the control room in real-time. Additionally, the construction of a water transportation service would benefit from the competent rise in the integration of cutting-edge technology in water transportation.
It is anticipated that sensors incorporated into the transportation service would considerably increase ship protection and performance. Additionally, sensors can reduce running expenses. Sensors used in water transportation continuously check the operation and provide prompt information about any faults or damages. global growth in water transport market is anticipated as a result of the use of GPS and GNSS systems.
Market Restraints:
Crude oil price volatility is affecting water transport, and it is projected to constrain the water transport market throughout the forecast period. According to the United Nations Conference on Trade and Development, fuel oil is a primary source of energy that powers the worldwide economy, accounting for 95% of the energy utilized in global transportation. Water transport accounts for more than 80% of global goods traffic by volume and is heavily reliant on oil. As the price of oil rises, carriers are compelled to boost their prices or face losses. Typically, the recipient is charged extra to cover the additional expenditures. Product inflation is caused by higher fuel prices, which influence all aspects of product transportation.
When fuel costs fall, consumers obtain lower-cost items, while logistics businesses use the savings to enhance their operations. Changes in fuel prices have a direct influence on operating expenses. According to US energy information administration statistics, crude oil prices surged in 2022, with Brent crude oil spot prices averaging $71/b for the year compared to $42/b in 2020, raising the operational expenses of water transport and hindering the growth of the water transport market.
Trends and Opportunities:
Water transport market, an important trend is the development of information technology systems for better vessel management. According to the United Nations Conference on Trade and Development (UNCTAD), waterways transported almost 80% of world trade by volume in 2019, with a fleet of 95402 ships. On ships, information technology is utilized for fuel optimization and vessel performance monitoring, as well as recognizing scanned copies and pictures of papers, customer relationship management, warehouse management, and Que management systems.
BunkerEx, an online platform for ship owners that assists in locating appropriate bunker ports; Nautilus Labs, which uses data from sensors, manual reports, and market information to create a unified fleet intelligence; and others are used for ship operations management. As a result, the mix of digital and physical connection assists carriers and seaports in integrating procedures with shippers and tracking devices for containers and cargo.
Water Transport Market Segment Analysis
Based on Type, the inland water freight transport segment is expected to grow at a compound annual growth rate (CAGR) of xx% from USD xx billion in 2022 to USD xx billion in 2025. The Russia-Ukraine war, at least in the medium term, hampered global economic recovery from the COVID-19 epidemic. The conflict between these two countries has resulted in economic sanctions against a number of countries, a jump in commodity prices, and supply chain disruptions that have impacted numerous markets throughout the world.
In 2025, Western Europe was the largest region in the inland water freight transport segment. In the inland water freight transport segment, Asia Pacific was the second biggest region. The overall volume of products moved on European inland waterways in 2025 was xx million tonnes, a 3.9% increase over the previous year. The overall transport completed reached xx billion tonne-kilometres, an increase of 3.3% over the previous year, despite a minor drop in miles travelled. Inland rivers mostly transported metal ores and other mining and quarrying materials, and coke and refined petroleum products.' The Netherlands and Germany have the most inland waterway transit across all product categories in Europe.
Russia's geographical location, along with its large national terrain, offers enormous potential for the growth of all modes of transportation. The country's investment in inland transportation infrastructure has fluctuated over the last decade, with an estimated value of xx billion euros in 2025.
Based on Propulsion, the water transport market is segmented into Diesel, LNG and Electric / Hybrid. the Diesel propulsion segment dominated the global Water Transport Market in 2025. Diesel engines remain the most widely used due to their established infrastructure, cost-effectiveness, and high energy density, making them suitable for long-distance shipping and heavy cargo transport. Many commercial and cargo vessels continue to rely on diesel for consistent performance and lower operational costs compared to alternative propulsion methods.
Water Transport Market Regional Insights
In 2023, Asia Pacific was the largest region in the water transport market. The region is expected to grow by xx% during the forecast period. Water transport accounts for approximately 95% of India's trade volume and 70% of its trade value. India has 12 major ports and 205 designated small and intermediate ports. Six new mega ports will be built in the country as part of the National Perspective Plan for Sagarmala. Foreign Direct Investment (FDI) of up to 100% is permitted under the automatic route for port and harbor building and maintenance projects.
It has also permitted a 10-year tax break for businesses that construct, manage, and operate ports, inland waterways, and inland ports. In FY20, India's principal ports had a capacity of 1,534.91 million tonnes per year (MTPA). In FY21, all major Indian ports handled 672.60 million tonnes (MT) of cargo volume.
Russia's inland waterway freight volume has experienced significant recent fluctuations, growing by 11% in 2023. Regarding marine transport, coal led in dry cargo by volume and crude oil led in liquid cargo in Russia. Fossil fuels also made up the majority of transhipments in the nation. International exports made up more than one-third of the air freight volume in Russia. In terms of freight tonnage transported in 2023, Air Bridge Cargo Airlines, a member of the Volga-Dnepr Group and a significant national cargo airline, was in first place.
The United Kingdom has vast water and wastewater infrastructure, including a network of pipelines spanning hundreds of kilometres and more than 1,000 treatment plants supplying drinking water. More than 25 million houses in England and Wales are connected to public water supply networks and sewerage. However, due to their antiquity, many of these pipes from the Victorian era require maintenance. Every day, three billion litres of water are lost in England and Wales. In addition to infrastructure expenditures, smart water metres will continue to be pushed out across the UK, allowing water companies to monitor water flow and identify leaks much more effectively.
Report Scope:
The research evaluates current activities and developments in each sub-sector, as well as revenue growth at the global, regional, and global levels (2023-2030). For this analysis, MMR divided the Water Transport market into type, vehicle type, and geographic locations. The market analysis also contains expected market estimates and trends for 22 countries spread throughout the world's primary geographic zones.
The value for the aforementioned categories is provided in the report (in USD million).
The research also aids in understanding the Water Transport Market trends, structure, and size projections by evaluating market segments. The research serves as an investor's guide by providing a clear depiction of competition analysis of major competitors in the Water Transport Market by financial situation, product portfolio, growth plans, and geographical presence.
Recent Industry Developments
| Exact Date | Company | Development | Impact |
|---|---|---|---|
| 18 March 2026 | Maersk | The company launched a new fully automated global and regional distribution centre in Singapore to boost its Asia Pacific footprint. | This facility reduces transit times and strengthens Maersk's position as an integrated logistics provider in the region. |
| 12 March 2026 | COSCO Shipping Holdings | The group successfully completed Hong Kong's first SIMOPS green methanol bunkering operation for a container vessel. | It sets a new sustainability benchmark for the shipping industry and supports the transition to low-carbon maritime fuels. |
| 03 February 2026 | Hapag-Lloyd and Maersk | The partners officially commenced the Gemini Cooperation service network, deploying approximately 340 vessels across seven key trade corridors. | The alliance aims to achieve 90% schedule reliability, significantly improving service quality for global shippers. |
| 20 January 2026 | Ministry of Ports, Shipping and Waterways | The government initiated the IWDC 3.0 phase, planning ₹5,000 crore in investments for green inland waterway transport by 2030. | This move accelerates the shift from road to low-emission waterborne freight, enhancing regional supply chain efficiency. |
| 12 November 2025 | MSC Cruises | The company confirmed an order for two additional World Class LNG-powered ships valued at €3.5 billion for delivery by 2030. | The investment solidifies MSC’s leadership in sustainable passenger transport and expands its total fleet capacity. |
| 01 April 2025 | CMA CGM | The group entered a five-year strategic partnership with Mistral AI, supported by a €100 million investment to integrate AI solutions. | Integration of AI is expected to optimize cargo routing and improve predictive maintenance for the vessel fleet. |
Water Transport Market Scope: Inquire before buying
| Water Transport Market | |||
|---|---|---|---|
| Report Coverage | Details | ||
| Base Year: | 2025 | Forecast Period: | 2026-2032 |
| Historical Data: | 2020 to 2025 | Market Size in 2025: | 640.95 USD Billion |
| Forecast Period 2026-2032 CAGR: | 6% | Market Size in 2032: | 963.75 USD Billion |
| Segments Covered: | by Type | Deep Sea Transport Coastal Transport Inland Water Transport Great Lakes Transport |
|
| by Vessel Type | Container Ships Dry Bulk Carriers Tankers Passenger Ferries |
||
| by Propulsion | Diesel LNG Electric & Hybrid |
||
| by Application | Cargo Transport Passenger Transport Others |
||
Water Transport Market, by Region
North America (United States, Canada and Mexico)
Europe (UK, France, Germany, Italy, Spain, Sweden, Austria and Rest of Europe)
Asia Pacific (China, South Korea, Japan, India, Australia, Indonesia, Malaysia, Vietnam, Taiwan, Bangladesh, Pakistan and Rest of APAC)
Middle East and Africa (South Africa, GCC, Egypt, Nigeria and Rest of ME&A)
South America (Brazil, Argentina Rest of South America)
Key Players / Competitors Profiles Covered in Brief in Global Water Transport Market Report in Strategic Perspective:
- A.P. Møller-Mærsk A/S
- China Ocean Shipping Company Limited
- Cargill Incorporated
- CMA CGM S.A.
- Hapag-Lloyd AG
- Nippon Yusen
- Evergreen Marine Corp
- K-Line (Kawasaki Kisen Kaisha Ltd.)
- Mediterranean Shipping Company
- Ocean Network Express Holdings Ltd.
- Kuehne + Nagel International AG
- Yang Ming Marine Transport Corporation
- Zim Integrated Shipping Services Ltd.
- Hyundai Merchant Marine Co.
- Wan Hai Lines Ltd.
- Wallenius Wilhelmsen
- Grimaldi Group
- Orient Overseas Container Line
- Matson Inc.
- Crowley Maritime Corporation
- Höegh Autoliners AS
- Pacific International Lines (PTE) Limited
- HMM Co. Ltd.
- SITC International Holdings
- American President Lines LLC