
Waste Management Markett- Industry Structure Evaluation, Demand Drivers Analysis, Regional Growth Analysis and Identification, Competitive Positioning Review & Global Market Size Forecast to 2032
Overview
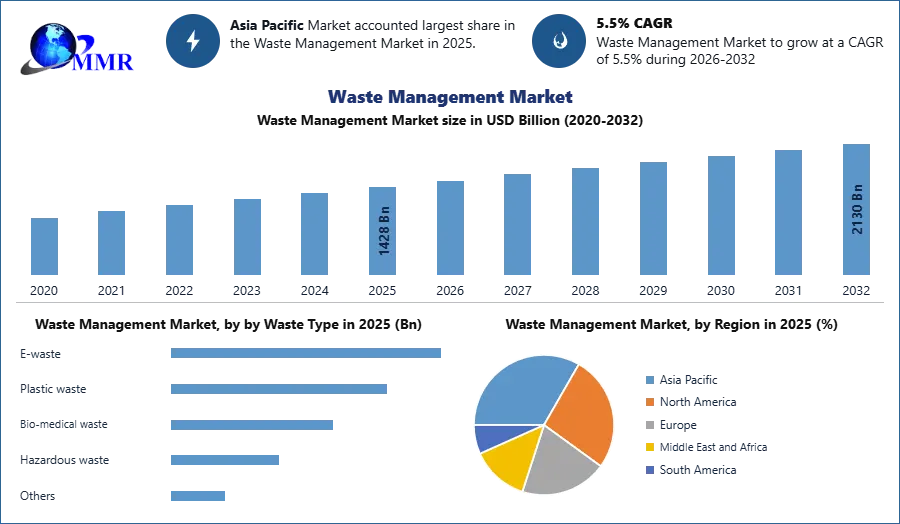
The Waste Management Market size was valued at USD 1,428 Billion in 2025 and the total Waste Management revenue is expected to grow at a CAGR of 5.5% from 2026 to 2032, reaching nearly USD 2,130 Billion.
Waste Management Market Overview
The waste management market has experienced robust global growth, driven by factors such as urbanization, industrialization, and heightened environmental awareness. According to MMR reports, the waste management market is expected to continue growing, driven by the increasing need for efficient waste-handling solutions. Waste management is the process of transporting, collecting, and disposing of waste materials, commonly referred to as garbage or trash. Waste collection, transportation, treatment, and disposal, as well as waste management process monitoring and control, waste-related legislation, technology, and economic systems, are all included.
Waste can be solid, liquid, or gaseous, with various disposal and management strategies for each. The primary factor is the increasing global awareness of environmental issues and the growing emphasis on sustainable practices. Environmental consciousness drives demand for sustainable waste management solutions and encourages the adoption of eco-friendly practices.
The objective of the report is to present a comprehensive analysis of the global market to the stakeholders in the industry. The past and current status of the industry with the forecasted market size and trends are presented in the report with the analysis of complicated data in simple language. The report covers all the aspects of the industry with a dedicated study of key players that include market leaders, followers, and new entrants. The waste management market is expected to grow further with increased urbanization and industrialization, rising environmental concerns, and the adoption of sustainable waste management practices.
 To know about the Research Methodology :- Request Free Sample Report
Waste Management Market Dynamics
Technological Developments in Waste-to-energy
Technological advancements in waste-to-energy play a significant role in the waste management market, it offers innovative solutions to address both environmental and energy-related challenges. Waste-to-energy is the technology used to convert garbage into energy by gasification or incineration is known as waste-to-energy technology. By 2032, waste-to-energy (WTE) is expected to have a $52.9 billion global market size. This is because Renewable resources are replacing coal to minimize carbon content.
Incineration is the process of burning hazardous material at high temperatures to destroy contaminants. China has circulating fluidized bed (CFB) incineration units. They have around 28 operating CFB units, the most current of which was built in 2012 and handles more than 800 tonnes/day. A new factory is being built in Shenzhen that will have a capacity of 5000 metric tonnes per day and will be the world's largest WTE facility. Waste gasification is a chemical process that involves heating waste in a low-oxygen atmosphere until it decomposes into its constituent molecules.
Although gasification is a more sophisticated process than trash incineration, the reactors used in both are very similar. In contrast to trash incineration, gasification technology converts MSW into smaller molecules and destroys pollutants such as dioxins and furans. A gasification facility Energos (part of ENER-G) in Manchester, UK, provides a cost-effective alternative to WTE's huge combustion technology. This facility can process MSW, industrial, and commercial garbage and has a handling capacity of up to 78,000 tons per year.
The Internet of Things (IoT) has been increasingly employed in waste management to enhance efficiency, reduce costs, and improve overall sustainability.
Traditional waste collection techniques follow predetermined routes and schedules. As a result, garbage collection trucks frequently empty waste bins while they are still empty or before they begin to overflow. Waste bin tracking in real-time is made possible by IoT-based waste management. This allows for timely waste collection and disposal while avoiding overflowing dumpsters. IoT-based temperature sensors monitor the temperatures of dumpsters to prevent explosions and fires. Moreover, RFID tags used in garbage trucks allow tracking of the location of these vehicles. This provides companies with highly relevant data that enables better decision-making and plan optimization.
Sensorita, a Norwegian firm, creates IoT-enabled sensors for garbage containers. Machine learning is used by the sensors to provide users with data-driven insights regarding their container fleet. This enables waste management firms to save expenses while also ensuring optimum asset usage. They can also use the sensors to cut carbon emissions for more sustainable trash management. MUSA is an Indonesian start-up that provides a trash management IoT monitoring solution. It includes modules for sensor and data aggregation, analytics, and centralized environmental data management.
Circular waste management guarantees that there is as little waste as possible by reusing and repurposing old products into new raw materials or products. This enables the most efficient use of materials rather than their disposal before end-of-life. Instead of the take-make-dispose paradigm, corporations are now designing products with many lifecycles. They use their manufacturing waste to produce new items. Furthermore, waste-to-energy (WTE) plants convert solid waste into steam for the creation of power. Sustainable packaging is also implemented by brands by sourcing eco-friendly materials with a low environmental impact.
Growing Various Upcoming Recycling and Waste Management Companies
Paper can be recycled to make reusable materials like recycled paper goods and paper pulp. This type of business is profitable since the demand for recycled paper goods in workplaces and homes is increasing. Plastic recycling involves gathering, sorting, and processing plastic material into reusable items. Rubber recycling is crucial to waste management. The procedure reduces the quantity of rubber that ends up in landfills or the natural environment, where it might harm the ecology. Europe recycles around 92% of its end-of-life tires. E-waste management is responsible for the processing, collection, and disposal of electronic trash, such as old and broken gadgets including laptops, televisions, and phones. E-waste is a growing problem as it accounts for above 50 million metric tons globally every year.
Green Construction Waste Management Market
Green construction waste management plays a crucial role in promoting sustainability within the construction industry. The construction industry in Malaysia has been quite robust for the last few years as evidenced by the double-digit growth. The construction industry is recognized as one of the key industries that contributes 10% to the nation’s gross domestic product (GDP). With the country’s move towards the status of a developed nation by 2020, the number of construction projects is expected to increase significantly. The demands in implementing major infrastructure projects, together with the construction of commercial buildings and housing development programs, will produce a large amount of construction waste.
Municipal solid waste (MSW)
Waste management companies provide collection services for municipal solid waste. This involves the regular pickup and transportation of waste from residential and commercial areas to processing facilities. MSW is commonly known as trash or garbage. In 2010, 250 million tons of MSW were generated in the United States. MSW includes organic wastes such as paper, cardboard, food, yard trimmings, and plastics, and inorganic wastes such as metal and glass. Advancements in technology, such as the use of IoT sensors and data analytics, are increasingly applied to manage municipal solid waste more efficiently.
These technologies help optimize collection routes, monitor fill levels in bins, and improve overall waste management processes. Municipal solid waste (MSW) is diverse and a major source of concern for human and environmental health. According to an MMR study, global MSW production will reach 3.2 billion tons by 2050. Rather than being regarded as waste, MSW can be regarded as a critical resource for producing energy, fuel, and valuable chemical compounds through thermochemical conversions.The limited space for landfills
The limited space for landfills is a critical issue within the waste management market, especially in densely populated urban areas where available land is scarce. Rapid urbanization and population growth contribute to increased urban trash generation. The difficulty of locating suitable sites for traditional landfill operations is exacerbated by the scarcity of available land. Landfills have become a necessity for disposing of significant amounts of Municipal Solid Waste (MSW). Landfills have traditionally been seen as the ultimate solution for storing trash at the lowest possible cost.
The everyday disposal of tons of rubbish without any treatment or segregation results in mounds at landfill sites. Landfills are often unscientific in developing nations like India, causing problems such as air pollution from trash burning at landfill sites, groundwater pollution, and soil deterioration. Governments and environmental agencies often provide incentives for businesses and municipalities to adopt innovative waste management practices, fostering the development and implementation of alternative methods.
Landfill methane emissions are a major environmental hazard that contributes to climate change. Methane is a powerful greenhouse gas that is released during the breakdown of organic waste in landfills, posing both environmental and public health concerns. Landfill methane emissions can lead to poor air quality. Although methane is not dangerous in and of itself, its combustion byproducts and the presence of other air pollutants in landfill gas can have a severe impact on local air quality.
Waste Management Market Segment Analysis
Based on Waste Type, the global waste management market is segmented as E-waste, Plastic waste, Bio-medical waste, Hazardous waste, and Others. During the forecast period, the E-waste segment is expected to lead the waste management market. Electrically powered component garbage is included in e-waste. Computers, consumer electronics, and refrigerators are examples of these appliances. E-waste is a mix of useful and harmful elements that must be handled with care and recycled. As a result, e-waste treatment has become more important around the world to protect the environment from the harmful impacts of elements like lead and plastics. Next-generation items are made from recycled materials.
Based on Service Type, the global waste management market is segmented as landfill, Recycling, Incineration, Open dumping, Composting, and anaerobic digestion. The increased need to dispose of waste that cannot be recycled is driving the rise of the landfill industry. Landfills have many advantages, including providing good energy sources, being an environmentally friendly choice, keeping cities, towns, and districts clean, and assisting in the segregation of hazardous waste. They are also a considerably less expensive waste management solution. During the expected period, the landfill segment in the Asia Pacific is expected to grow at a CAGR of 8.21%.
Based on the End-use Industry, Demand for waste management services from the residential segment is expected to be driven by an ever-increasing population and large solid waste creation. Waste created by home end users can be utilized to generate energy in garbage-to-energy plants, which burn solid waste to produce steam in a boiler, as well as to generate electricity. The increase of industrial establishment in developing countries with international trade and development in the field of science and technology has gained the attention of many developed countries.
Recent Industry Developments
| Exact Date | Company | Development | Impact |
|---|---|---|---|
| 17 February 2025 | Waste Management, Inc. | Announced the expansion of its recycling facility network in North America with new investments exceeding USD 150 million to enhance automated material recovery systems. | The expansion strengthens recycling capacity and operational efficiency, supporting growing demand for sustainable waste processing solutions. |
| 12 April 2025 | Veolia Environnement S.A. | Launched a new advanced plastic recycling technology platform designed to process complex plastic waste streams and improve material recovery rates. | This innovation accelerates circular economy initiatives and sustainable waste management practices across global markets. |
| 29 June 2025 | Republic Services, Inc. | Completed the acquisition of a regional recycling and waste collection operator to strengthen its municipal waste services footprint in the United States. | The acquisition expands service coverage and waste collection infrastructure, enhancing operational scale in the waste management sector. |
| 14 October 2025 | SUEZ Group | Announced the development of a large-scale waste-to-energy facility in Europe capable of processing over 300,000 tons of municipal waste annually. | The project enhances energy recovery from waste and reduces landfill dependency, supporting sustainable urban waste management. |
| 21 January 2026 | Clean Harbors, Inc. | Introduced a new hazardous waste treatment and disposal facility with advanced environmental monitoring and processing technologies. | The facility strengthens hazardous waste management capabilities and regulatory compliance across industrial sectors. |
Waste Management Market Regional Insights
Asia-Pacific is the dominant player in Waste Management. Rapid urbanization, demographic increase, and economic development are altering the Asian-Pacific landscape and producing massive amounts of garbage. Increased municipal solid trash is most visible in low- and middle-income countries, where consumption was formerly minimal. Asia spending on urban around US$ 2 billion on urban waste management per year, this amount will increase to about US$47 billion in 2025. Indonesia and the Philippines as well as parts of China and India are the Asian countries facing the greatest waste management challenge, based on projected waste generation rates and relative affluence to deal with the problem.
Today, the urban areas of Asia produce about 760,000 tonnes of municipal solid waste (MSW) per day, or approximately 2.7 million m3 per day. In 2025, this figure will increase to 1.8 million tonnes of waste per day or 5.2 million m3 per day. Local governments in Asia currently spend about US $25 billion per year on urban solid waste management. This amount is used to collect more than 90 percent of the waste in high-income countries, between 50 to 80 percent in middle-income countries, and only 30 to 60 percent in low-income countries. Low-income countries have the lowest proportion of urban populations and garbage. generation rates ranging from Per capita, 0.4 to 0.9 kilogram per day.
As GNP rises towards the middle. spectrum of income, per capita waste the rate of generation is likewise increasing. 0.5 to 1.1 kg per day is the average. The high-income, as projected, countries with the highest generation rates range from Per capita, 1.1 to 5.07 kg per day.
The total waste generated in the EU (European Union), which includes the waste from all economic activities and households amounted to 2.5 million tonnes in 2025. This translates to around 5.3 tons per person in the EU population. While residential rubbish receives a lot of attention, it only accounts for little more than 8% of total waste, compared to more than 36% generated by construction and more than 28% generated by mining and quarrying. Together the waste from mining and quarrying and construction and demolition is classified as major mineral waste and accounts for almost three-quarters (74%) of all waste.
Mining and quarrying activities are relatively big in Romania, Finland, Sweden, and Bulgaria, whereas construction and demolition activities produce large volumes of major mineral waste in Luxembourg, accounting for 86%-90% of total garbage. Estonia was still dominating in Europe when large mineral waste was excluded. mostly as a result of energy generation based on oil shale
Competitive Landscape of the Waste Management Market
The waste management market features a competitive landscape with a mix of established players, regional companies, and emerging startups. The waste management market includes a wide range of services and solutions aimed at assembling, transporting, processing, recycling, and disposing of various types of waste. This includes municipal solid waste, industrial waste, electronic waste, and hazardous waste. Companies such as Waste Management, Inc., Veolia Environment S.A., Republic Services, Inc., and Suez SA stand out as global leaders, offering comprehensive waste management services on an international scale. The waste management market's competitive landscape is characterized by a balance between established industry giants and emerging players eager to make a mark through innovation and sustainability.
In May 2021, SUEZ and Eramet, a major player in the extraction and valuation of metals, agreed to expand their collaboration in the area of recycling end-of-life electric car batteries. This collaboration aims to provide a high-performance, cost-effective, and long-term battery recycling solution for the European market.
In March 2021, Veolia collaborated with Groupe Renault, a vehicle and van manufacturer, and Solvay, a chemical and plastics company, to enable the circular economy of EV battery metals in Europe through closed-loop recycling.
The concept of the circular economy has gained prominence in the waste management industry. Key players are actively promoting and participating in circular economy models, aiming to minimize waste generation and maximize resource recovery. Companies that can successfully negotiate regulatory frameworks, embrace technological breakthroughs and support circular economy practices will be well-positioned for long-term success in this ever-changing market.
Waste Management Market Ecosystem
Waste Management Market Scope: Inquire before buying
| Waste Management Market | |||
|---|---|---|---|
| Report Coverage | Details | ||
| Base Year: | 2025 | Forecast Period: | 2026-2032 |
| Historical Data: | 2020 to 2025 | Market Size in 2025: | 1428 USD Billion |
| Forecast Period 2026-2032 CAGR: | 5.5% | Market Size in 2032: | 2130 USD Billion |
| Segments Covered: | by Waste Type | E-waste Plastic waste Bio-medical waste Hazardous waste Others |
|
| by Service Type | Landfill Recycling Incineration Open Dumping Composition & Anaerobic Digestion |
||
| by Treatment Method | Recycling Landfill Incineration Composting |
||
| by End User | Commercial Industrial Residential |
||
Waste Management Market, by Region
North America (United States, Canada and Mexico)
Europe (UK, France, Germany, Italy, Spain, Sweden, Austria and Rest of Europe)
Asia Pacific (China, South Korea, Japan, India, Australia, Indonesia, Malaysia, Vietnam, Taiwan, Bangladesh, Pakistan and Rest of APAC)
Middle East and Africa (South Africa, GCC, Egypt, Nigeria and Rest of ME&A)
South America (Brazil, Argentina Rest of South America)
Key players / Competitors profiles covered in the Waste Management Market report in strategic perspective
1. Clean Harbors Inc.
2. Daiseki Co. Ltd.
3. Waste Management Inc.
4. Suez Environment S.A.
5. Advanced Disposal Services
6. Veolia Environment S.A
7. Republic Services Inc.
8. Covanta
9. Remondis AG & Co. Kg
10.Biffa Group
11.Hitachi Zosen Corporation
12.Green Conversions
13.Amec Foster Wheeler
14.Xcel Energy, Recology
15.Keppel Segher
16.Plasco Conversions
17.Wheelabrator Technologies
18.Nexans
19.China Everbright International
20.Cleanaway
21.Sims Metal Management
22.Waste Management, Inc.
23.Veolia Environnement S.A.
24.Republic Services, Inc.
25.SUEZ Group
26.Clean Harbors, Inc.