
Utility Markers Market Size by Type, Application, Function, Region, Industry-Wide Analysis, Competitive Landscape Assessment & Long-Term Forecast to 2032
Overview
The Utility Markers Market size was valued at USD 348.15 Million in 2024 and the total Utility Markers revenue is expected to grow at a CAGR of 7.37% from 2025 to 2032, reaching nearly USD 614.97 Million.
Utility markers help those who work in the adjacent area to know what kind of utilities exist under the ground before digging. It serves as to highlight or distinguish certain critical information, factors, or events within the framework as well as a visual warning, indicating the presence of buried cables, pipes, or other infrastructure, reducing the risk of accidental hits during excavation or construction work. Utility markers are devices designed to mark, identify, and indicate the presence of underground utilities or specific points of interest. They typically consist of brightly colored flags, stakes, or physical indicators placed above or below ground level.
 To know about the Research Methodology :- Request Free Sample Report
Utility Markers Market are widely utilized in Construction and Excavation, Infrastructure Maintenance, Safety and Compliance, Emergency Response, Urban Planning and Development and Research and Data Management. As a result, they have widespread use in construction and engineering, utility markers are essential to prevent accidental damage to buried utility lines during excavation and construction activities as well as in civil engineering, utility markers play a crucial role in planning and executing infrastructure development projects.
The Utility Markers market is experiencing substantial growth due to various factors that are covered in the MMR global report. The increasing global urbanization and infrastructure development projects has increased the demand for utility markers. As well Utility Markers market is a safety regulations and standards in construction and excavation activities has mandated the use of utility markers. This market improved their durability, visibility, and accuracy in marking underground utilities because of a growing number of construction projects, including residential, commercial, and industrial developments.
Additionally, the popularity of Utility Markers market in the manufacturing sector such as, electrical lines, gas pipes, water mains, and telecommunication cables within their premises. These markers are often brightly colored flags, stakes, or physical indicators placed above or below ground level to identify and protect these utilities. Therefore, the utility markers utilized in manufacturing are tools or equipment used for safety and operational purposes.
Utility Markers Market Dynamics:
Evolution of Utility Markers Driving Precision and Safety
Increasing prevalence of programmable markers featuring electronic components for data storage and transmission. These markers enable precise tracking of buried pipes and cables, increasing accuracy and efficiency. Simultaneously, the rise in RFID technology's integration allows markers to be remotely read, expediting the process of locating underground utilities. Another shift is the surge in demand for sustainable markers crafted from recycled materials, meeting the call for environmentally friendly solutions. Additionaly, governments globally are emphasizing safety by mandating marker usage to avert accidents and prevent damage to underground infrastructure. This collective focus on innovation, sustainability, and safety underscores the industry's evolution, emphasizing precision, efficiency, environmental consciousness, and a commitment to minimizing risks in underground utility management.
Challenges and Restrain Prospects in Utility Markers Market:
In many underdeveloped and emerging economies, there exists a concerning lack of awareness regarding the importance of utility detection. This gap leads to unsafe excavation practices, risking damage to underground utilities and causing potential accidents. Also, the absence of standardized practices in these regions poses challenges for utility companies in tracking and maintaining their assets. Technical issues further compound these problems. Utility markers, commonly used for detection, suffer from reliability and maintenance issues, necessitating regular calibration. This has encourage the emergence of alternative solutions such as ground penetrating radar (GPR) and electromagnetic locating (EML), offering potentially superior accuracy despite being pricier.
In numerous underdeveloped economies, there exists a significant lack of awareness about the vital role of utility detection, leading to unsafe excavation practices that jeopardize underground utilities, causing potential accidents. Additionally, the absence of standardized practices in these regions poses challenges for utility companies in effectively tracking and maintaining their assets, contributing to further complications in infrastructure management and safety.
Utility markers pose reliability and maintenance challenges, requiring frequent calibration and lacking consistent dependability. Additionally, various technical hurdles hinder their efficacy. Alternatives such as ground penetrating radar (GPR) and electromagnetic locating (EML) provide more accurate utility detection despite their higher cost compared to markers. These solutions offer enhanced reliability, presenting viable options for users seeking precision in utility detection, thereby prompting a shift towards more accurate yet relatively expensive alternatives in the industry.
The utility markers market faces significant challenges due to the high installation and maintenance costs attributed to several factors. These encompass pricey materials, specialized equipment, and the necessity for permits. Regular upkeep and repairs add to the financial strain. Installation costs, vary based on marker type, location, and area size. Maintenance expenses, cover inspections, repairs, and replacements. These high expenses often hinder utility companies from justifying marker installation, potentially leading to safety risks in excavation. Mitigating measures involve employing cost-effective materials, strategic marker placement, efficient installation, and durable marker development to reduce overall expenses and promote better utility detection practices.
However, the utility marker market faces restraints such as high installation and maintenance costs, limited skilled labor, stringent government regulations, and environmental concerns. The market anticipates growth due to rising infrastructure demands, increased awareness of utility detection importance, and technological advancements in utility markers. The market's projected growth is expected to be driven significantly by the Asia Pacific region, primarily due to rapid infrastructure development from.
Infrastructure Development Rising Opportunities for Utility Marker Market:
The increasing demand for infrastructure development is fuelling the need for utility markers to precisely identify and safeguard underground assets amid expanding roads, bridges, and utility networks. This growth is especially prominent in regions grappling with aging infrastructure and higher accident risks, driving an upsurge in utility marker demand as safety and compliance take precedence. Technological advancements are revolutionizing utility markers, with smart markers equipped with sensors and communication capabilities improving accuracy and reducing damage risk by offering real-time data on buried utilities. Leveraging these innovations, utility marker companies are eyeing the increasing opportunities in emerging markets with rapid infrastructure growth, aiming to tap into new customer bases. Focusing on specialized applications tailored to specific industries such as telecommunications or water utilities enhances competitiveness, while bundled services combining utility marking with GPR surveys or excavation support rising revenue streams and customer appeal. Integration with existing utility management systems elevates efficiency and data management capabilities. Additionally, eco-friendly marker development and partnerships with stakeholders bolster sustainability and innovation, while ensuring regulatory compliance and certifications boost credibility and market competitiveness for utility marker companies.
Utility Markers Market Segment Analysis:
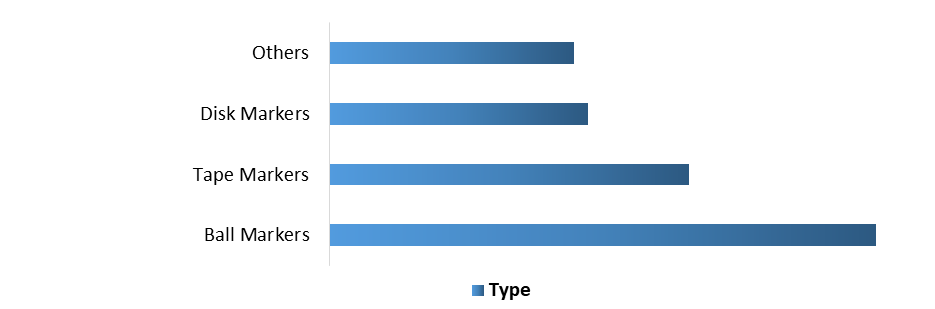
Based on type, the ball markers segment led the global Utility Markers market with the highest market share of more than 30% in 2024 and is expected to maintain its growth trend during the forecast period. Ball tape is a type of utility marking tape that is used to mark buried utilities, such as cables, pipes, and conduits. It is made of a durable plastic material that is resistant to water, UV rays, and other environmental factors. The growth of this market driven increasing demand for infrastructure maintenance and replacement, the growing adoption of smart grid technologies, and the increasing demand for safety and security in the utility industry. Ball tape is a versatile and durable utility marking tape. Tape markers is also known as utility marking tape.
It is used to identify and mark the location of underground utilities. They are made of a durable plastic material that is resistant to water, UV rays, and other environmental factors. Tape markers are available in a variety of colours, each of which corresponds to a different type of utility. The benefits of this marker is easy to install and maintain and relatively inexpensive. Also help to prevent accidents and injuries. The growth of this market is driven by Increasing demand for infrastructure maintenance and replacement, growing adoption of smart grid technologies and increasing demand for safety and security in the utility industry.
The disk markers segment is expected to grow at the highest growth rate and offer lucrative growth prospects for Utility Markers market players during the forecast period. They are typically made of a durable plastic material that is resistant to water, UV rays, and other environmental factors. The application of this markers is Cables, Pipes, Conduits, and Hydrants, Storm drains, Septic tanks and Underground storage tanks.
Global Utility Markers Market Share, by Type In (%), In 2024
Utility Markers Market Regional Insights:
North America held a market share of more than 30% in the global Utility Markers market in 2024 and is expected to grow during the forecast period. The rapidly expanding industrial sector and growing implementation of different manufacturing and electronics technologies in industrial sectors is expected to be the major driver driving the Utility Markers industry growth. Besides that, urbanization is increasing the demand for new infrastructure, such as roads, bridges, and buildings. This is leading to an increase in the demand for utility markers, The North America region has witnessed significant growth in increasing demand for utility markers in the construction and utility industries, the growing popularity of non-destructive excavation methods. Additionally, the construction sector extensively uses locate buried utilities, such as water pipes, gas lines, and electrical cables, during construction projects. This helps to prevent damage to these utilities and avoid accidents. Utility Markers play a vital role in telecommunication and are further expected to contribute significantly to market growth.
Government policies in North America that are impacting the utility markers market. These policies are designed to promote safety, protect the environment, and ensure the efficient and reliable operation of utility infrastructure. For example,
1. Occupational Safety and Health Administration (OSHA): This has regulations that require the use of utility markers to identify and locate buried utilities. These regulations are help to prevent accidents and protect workers from injury.
2. Department of Transportation (DOT): This has regulations that require the use of utility markers to identify and locate buried utilities in areas where transportation infrastructure is being constructed or repaired. These regulations are designed to prevent damage to buried utilities and avoid disruptions to transportation services.
3. Federal Emergency Management Agency (FEMA): This has a several number of programs that provide funding for the installation of utility markers in areas that are prone to natural disasters. These programs are designed to protect buried utilities from damage during natural disasters and avoid disruptions to utility services
Thus, these economies are expected to provide lucrative growth prospects for Utility Markers market players throughout the forecast period. The manufacturing sectors of these economies are undergoing significant transformations, with construction, telecommunications and transportation being particularly fast-growing businesses. The North America region as a whole is experiencing significant growth in ball markers as well as increasing demand for new infrastructure, the aging of existing infrastructure, and the growing awareness of the importance of safety and environmental protection.
Utility Markers Market Scope: Inquire Before Buying
| Global Utility Markers Market | |||
|---|---|---|---|
| Report Coverage | Details | ||
| Base Year: | 2024 | Forecast Period: | 2025-2032 |
| Historical Data: | 2019 to 2024 | Market Size in 2024: | USD 348.15 Mn. |
| Forecast Period 2025 to 2032 CAGR: | 7.37% | Market Size in 2032: | USD 614.94 Mn. |
| Segments Covered: | by Type | Ball Markers Tape Markers Disk Markers Others |
|
| by Application | Gas Telecommunication Water Power Waste Water |
||
| by Function | Passive Programmable |
||
Utility Markers Market, by Region:
North America (United States, Canada and Mexico)
Europe (UK, France, Germany, Italy, Spain, Sweden, Austria, Turkey, Russia and Rest of Europe)
Asia Pacific (China, India, Japan, South Korea, Australia, ASEAN and Rest of APAC)
Middle East and Africa (South Africa, GCC, Egypt, Nigeria and Rest of ME&A)
South America (Brazil, Argentina, Columbia and Rest of South America)
Utility Markers Market, Key Players:
1. 3M
2. Tempo Communications, Inc
3. Komplex
4. Hexatronic Group AB
5. Radiodetection Ltd.
6. Rycom Instruments, Inc.
7. Seton
8. Berntsen International, Inc.
9. Trident Solutions
10. Marking Services, Inc.,
11. Sparco Multiplast Pvt. Ltd.,
12. Shenzhen Eedeng Technology Co. Ltd.
13. Dura-Line Corporation,
14. Trident Solutions,
15. Tempo Communications, Inc.
16. Komplex
17. National Marker Company
18. Northtown Company
19. Omega Marking Company
20. Prosolve
21. Seton
22. Savitri Telecom Services
23. Trumbull Manufacturing
FAQs:
1. What are the growth drivers for the Utility Markers market?
Ans. The increasing industrialization in developing economies, coupled with rising demand for advanced safety and security solutions, is expected to be the major driver for the Utility Markers market.
2. What is the major restraint for the Utility Markers market growth?
Ans. The lack of regulatory standards is expected to be the major restraining factor for the Utility Markers market growth.
3. Which region is expected to lead the Global Utility Markers market during the forecast period?
Ans. North America is expected to lead the global Utility Markers market during the forecast period.
4. What is the projected market size & and growth rate of the Utility Markers Market?
Ans. The Utility Markers Market size was valued at USD 348.15 Million in 2024 and the total Utility Markers revenue is expected to grow at a CAGR of 7.37% from 2025 to 2032, reaching nearly USD 614.97 Million.
5. What segments are covered in the Utility Markers Market report?
Ans. The segments covered in the Utility Markers market report are Type, Applications, Function, and Region.