
North America Positive Material Identification Market by Offering, Technique, Form Factor, Industry, - Market Size Estimation, Industry-Wide Analysis, Competitive Landscape Assessment & Long-Term Forecast to 2026
Overview
North America Positive Material Identification Market is expected to grow at a CAGR of 4.26% during the forecast period and it is expected to reach US$ 16.42 Bn. by 2026.
To Know About The Research Methodology :- Request Free Sample Report
This is attributed to growing focus on improving oil & gas industries as well as the upsurge in stringent government regulations to curb pollution given by the industries are some of the key factors that are driving the North America market growth.
X-Ray Fluorescence (XRF) segment dominated the North America positive material identification market, with market size of US$ XX Mn. in 2019 and to reach US$ XX Mn. by 2027, with a CAGR of XX%. Thanks to increasing investments in infrastructural activities, coupled with the growing demand for X-ray fluorescence devices from the cement industry for cement quality check is major factor estimated to drive the growth of the North America X-ray fluorescence market over 2019-2027. X-Ray Fluorescence (XRF) is helpful in measuring the percentage of metals within inorganic matrices like cement and metal alloys. By form factor, portable analyzers segment was valued US$ XX Mn. in 2019 and is expected to reach US$ XX Mn.by 2027 at a CAGR of XX% over the forecast period. Portable/handheld PMI equipment types are usually XRF analyzers. These equipment types are among the widely used equipment in the USA because of their small size and lower costs.
The US Positive Material Identification Market is expected to grow at XX% CAGR to be valued at US$ XX Mn. by 2027 because of growing government spending on construction activities, and increasing consumption of cement in the U.S. is expected to support the growth of the North America market. In the U.S. industry segment, the oil & gas industry accounted for US$ XX Mn in 2019 and is expected to grow at a CAGR of XX % over the forecast period 2019-2027, to account for US$ XX Mn. in 2027. However, the automotive industry segment is projected to reach US$ XX Mn. by 2027.
As the world’s largest consumer market, the US continues to rely heavily on the automotive industry for the transports of people and goods. Major trends shaping the overall U.S. economy and automotive industry contains the ongoing uncertainty nearby US protectionism towards traditional trade partners Mexico and Canada, as well as the EU and China.
Canada Positive Material Identification Market is expected to grow at XX% CAGR to be valued at US$ XX million by 2027 thanks to a growing number of oil and gas refineries. In Canada, the oil and gas industry segment was valued US$ XX Mn. in 2019 and are expected to reach at US$ XX Mn. by 2027 at a CAGR of XX % over the forecast period. Between worldwide respondents supportive of Canadian imports, China and India estimate by the International Energy Agency (IEA) to see energy demand rise by 46 % and XX %, respectively, by 2040.
Some of the key players of the North America Positive Material Identification market include:
• Olympus
• Hitachi
• Thermo Fisher
• Ametek
• Bruker
• Shimadzu
• SGS
• Intertek
• Bureau Veritas
• TUV SUD
• Stanley Inspection
• InCon
• Buffalo Inspection Services Inc.
North America Positive Material Identification Market, Key Target Audience:
• PMI testing equipment rental providers
• Raw material and component providers
• Original equipment manufacturers (OEMs)
• End-users/enterprise-users
• Research institutes and organizations
• Government bodies, venture capitalists, and private equity firms
• Market research and consulting firms
• Enterprise data center professionals
The scope Of The North America Positive Material Identification Market: Inquire before buying
The research report segments North America Positive Material Identification market based on technique, offering, form factor, industry, and geography.
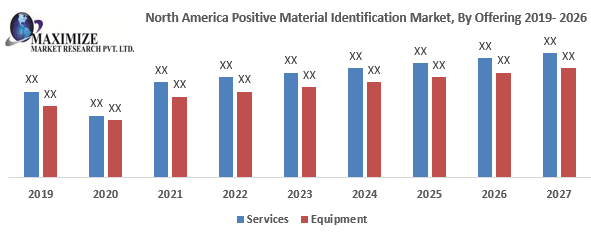
North America Positive Material Identification Market, By Offering:
• Services
• Equipment
North America Positive Material Identification Market, By Technique:
• Optical Emission Spectrometry (OES)
• X-Ray Fluorescence (XRF)
North America Positive Material Identification Market, By Form Factor:
• Benchtop Analyzers
• Portable Analyzers
North America Positive Material Identification Market, By Industry:
• Aerospace & Defense
• Oil & Gas
• Metals & Heavy Machinery
• Infrastructure
• Automotive
• Scrap Recycling
• Chemicals
• Power Generation
• Pharmaceutical
North America Positive Material Identification Market, By Geography:
• North America
• US
• Canada
North America Positive Material Identification Market, Geographic Analysis:
• Breakdown of US Positive Material Identification market
• Breakdown of Canada Positive Material Identification market
Available Customizations:
Maximize Market Research offers customizations of reports according to the specific requirement of our clients