
India Electric Motor Market - Industry Structure Evaluation, Demand Drivers Analysis, Growth Analysis and Identification, Competitive Positioning Review & Market Size Forecast to 2032
Overview
India Electric Motor Market was valued at US$ 1.35 Bn. in 2025. India Electric Motor Market size is estimated to grow at a CAGR of 17.45%.
India Electric Motor Market Overview:
Electro-mechanical devices like electric motors are operating on the principle of electromagnetic induction. They are highly efficient, long-lasting, low-maintenance, energy-efficient, and can endure strong voltage fluctuations. Furthermore, electric motors are substantially less expensive than fossil-fuel engines. There are 12 different types of electric motors are available in the market. Hysteresis motors, pancake or axial rotor motors, synchronous reluctance motors, and stepper motors are some of the types of the electric motors.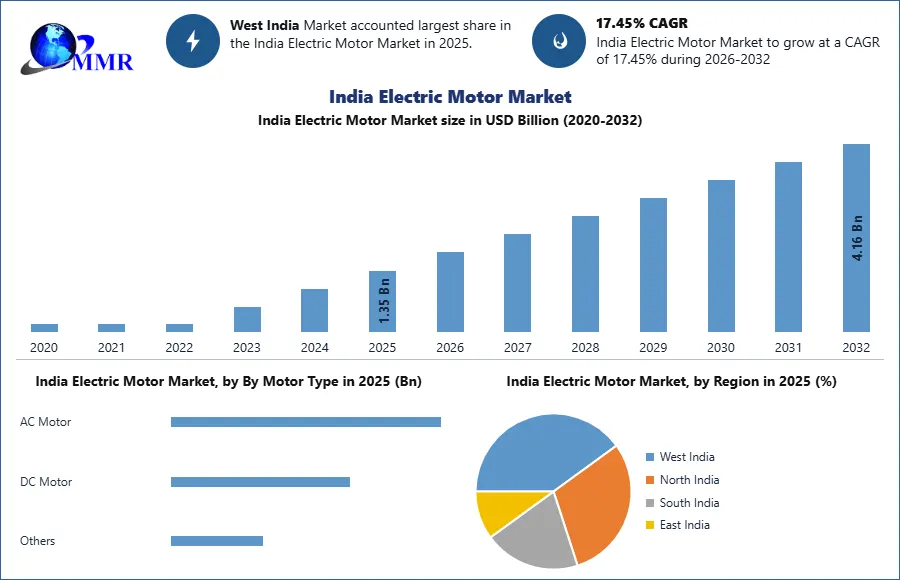 To know about the Research Methodology :- Request Free Sample Report
Electrical machines that consume electrical energy & convert it into mechanical energy are known as electric motors. The conversion process includes interaction between the magnetic fields set up in the windings of the stator & rotor. Wound-rotor synchronous motors, AC SCIM split-phase, and AC SCIM split-phase capacitor-run are also available in the market. AC induction shaded-pole motors, universal motors, switching reluctance motors, brushless DC motors, and brushed DC electric motors are also used in a wide range of applications, from aeroplanes to industrial handheld power tools.
The segments of the Electric Motor market are investigated in the report (Motor Type, Voltage, Power Capacity, Application, and Region). Market players and regions have given data (North America, Asia Pacific, Europe, Middle East & Africa, and South America). The Electric Motor market study gives a comprehensive overview of the present quick advancements in all industrial sectors. The essential data analysis for the historical era from 2020 to 2025 is presented using facts and figures, pictures, and presentations. The analysis looks at the market's drivers, constraints, prospects, and hurdles for Electric Motor. This MMR report contains investor suggestions based on a detailed study of the current competitive landscape in the Electric Motor industry sector.
India Electric Motor Market Dynamics:
Electric motor manufacturers are continuing to work around traditional challenges of noise, efficiency, and performance due to the ever-increasing end-user demands of the motors. According to the analysis, on the basis of the supply side, there is still a lot of demand for magnets manufactured of more common materials. The demand for electric motors in India has experienced a firm growth. Strict power consumption standards & resolution in the reduction of greenhouse gas (GHG) emissions are the key reasons for the growth in industrial production & the development of the electric motor market.
The India electric motor market growth is driven by the usage of the electric motor in the various end user industries. An increase in the construction activities across residential, commercial sector, government focus towards adopting energy-efficient motors, high growth in the population in the country and rapid urbanisation are some of the prominent factors, which are expected to drive the market growth in the near future. The Indian Currently, one of the most significant instruments, which is used in industrial sector is the electric motor. Steel mills, automobile accessories, treadmill exercisers, and paper manufacturing are all using brushed DC motors. Rigid disc drives, RC vehicles, electric cars, CD/DVD vehicles, and UAVs use brushless DC motors are some of the prominent application areas of the electric motors.
Furthermore, electric motors offer a momentous gain in energy efficiency for industrial usage. The current technology, the Internal Combustion Engine has an energy efficiency of less than 50%, whereas electric motors have an energy efficiency of above 95%. Electric motors are also less expensive to manufacture, small, and lightweight in usage and provide steady and instant torque for applications like as electric automobiles while using renewable energy. These are some factors, which are expected to drive the market growth.
The government of India plays a vital role in the expansion of Electric Motor market,
The government of India is playing a vital role in the expansion of the electric motor market by introducing some of the initiatives like Make in India, Smart City Mission, AMRUT, affordable housing, and others. The Industrial inclination towards the advancement of existing electrical infrastructure have positively influenced the industry outlook. In India, Governments are constantly in dialogue to identify new areas of collaboration with the goal to improve the energy supply for end user industries.
An acceptance of electric vehicles is expected to drive the electric motors market growth.
An increase in fuel prices and stringent regulations towards reducing the air pollution level are expected to increase the demand for electric motors in the coming years. The automotive sector in the country is also booming. Electric mobility will help to balance energy demand, storage, and environmental sustainability. Electric vehicles, by relying on a diverse range of primary energy sources for power generation is expected to help diversify the energy requirement to move people and commodities, significantly boosting energy security.
Currently the Electric Vehicle industry in India is far behind, with less than electrical vehicle sales. Despite the Indian roads are dominated by conventional vehicles, an adoption of the electrical vehicles are expected to increase in the near future. The government of India have undertaken multiple initiatives to encourage manufacturing and adoption of electric vehicles in India. With support of the government, electric vehicles have started piercing in the Indian market.
India Electric Motor Market Segment Analysis:
In 2025, the AC Motor segment dominates the India electric motor market due to its high efficiency, durability, and widespread use across electric vehicles. Among AC motors, Induction AC Motors hold a significant share owing to their cost-effectiveness and robust performance, while Synchronous AC Motors are gaining traction for their higher efficiency and precision control.
The DC Motor segment, particularly Brushless DC Motors (BLDC), is witnessing rapid growth due to its compact design, low maintenance requirements, and increasing adoption in electric two-wheelers. Brushed DC Motors continue to serve low-cost applications but show relatively slower growth.
Based on components, the Motor Stator segment accounts for the largest share in 2025, driven by its critical role in generating the magnetic field required for motor operation.
The Permanent Magnet segment is expanding at a strong pace due to its importance in improving motor efficiency and power density, especially in high-performance electric vehicles. Additionally, Rotor, Shaft, and Bearing components contribute significantly to overall system reliability and durability.
The Battery Electric Vehicle (BEV) segment leads the market in 2025, supported by increasing government incentives, rising fuel costs, and growing environmental awareness.
Hybrid Vehicles (HEV) and Plug-in Hybrid Vehicles (PHEV) maintain steady demand as transitional technologies, offering improved fuel efficiency and reduced emissions compared to conventional vehicles.
India Electric Motor Market Regional Insights:
The India electric motor market growth is driven by the rapid expansion of the end-user industries and construction activities in the country. Gujarat, Maharashtra, and Madhya Pradesh are the key markets for electric motor, which are playing a vital role in generating revenues in the market. An increase in government initiatives like Green Energy Corridor in Gujarat, Maharashtra, and Madhya Pradesh are expected to contribute significant share during the forecast period.
The Indian market for electric motors is fragmented because of the presence of a large number of players like major manufacturing companies and medium-sized enterprises. An innovation and technological advancement like energy-efficient motors with significant power saving capability are some of the key focus area of the key players operating int the India electric motor market. Automotive, manufacturing, HVAC equipment, and home appliance are some of the key application area in the country, which are expected to increase the adoption of electric motors in near future.
The objective of the report is to present a comprehensive analysis of the India Electric Motor Market to the stakeholders in the industry. The past and current status of the industry with the forecasted market size and trends are presented in the report with the analysis of complicated data in simple language. The report covers all the aspects of the industry with a dedicated study of key players that include market leaders, followers, and new entrants.
PORTER, PESTEL analysis with the potential impact of micro-economic factors of the market have been presented in the report. External as well as internal factors that are supposed to affect the business positively or negatively have been analyzed, which will give a clear futuristic view of the industry to the decision-makers.
The reports also help in understanding the Electric Motor Market dynamic, structure by analyzing the market segments and projecting the Electric Motor Market size. Clear representation of competitive analysis of key players by Application, price, financial position, product portfolio, growth strategies, and regional presence in the Electric Motor Market make the report investor’s guide.
India Electric Motor Market Scope: Inquiry Before Buying
| India Electric Motor Market | |||
|---|---|---|---|
| Report Coverage | Details | ||
| Base Year: | 2025 | Forecast Period: | 2026-2032 |
| Historical Data: | 2020 to 2025 | Market Size in 2025: | 1.35 USD Billion |
| Forecast Period 2026-2032 CAGR: | 17.45% | Market Size in 2032: | 4.16 USD Billion |
| Segments Covered: | By Motor Type | AC Motor Induction AC Motor Synchronous AC Motor DC Motor Brushed DC Motor Brushless DC Motor Others |
|
| By Component | Motor Stator Rotor, Shaft, and Bearing Permanent Magnet Casing Wiring & Connectors Others |
||
| By Propulsion Type | Battery Electric Vehicle Hybrid Vehicles Plug-in-Hybrid Vehicles |
||
| By Power Rating | Up to 20 kW 21 kW to 100 kW 101 kW to 250 kW Above 250 kW |
||
| By Powertrain Type | Single Motor Dual Motor Triple Motor Four Motor |
||
| By Application | Two-Wheelers Passenger Vehicles Commercial Vehicles Light Commercial Vehicle Medium & Heavy Commercial Vehicles |
||
| By Distribution Channel | OEM Aftermarket |
||
India Electric Motor Market Key Players
- Tata Motors Ltd.
- Mahindra Electric Mobility Ltd
- Rizel Automotive
- Sona BLW Precision Forgings Limited
- Varroc Group
- Napino Auto & Electronic
- SEG Automotive India
- Shakti EV Mobility Pvt. Ltd.
- Sterling E-Mobility Solution Ltd.
- Compage Automation
- EMF Innovations
- Physics Motors Technology
- Konmos Technologies
- C-Electric Automotive Drives
- Elecnovo
- Gremot Mobility
- Others