
Global Low Power Bridges Market by Type, Application, Region – Global Market Size Estimation, Industry-Wide Analysis, Competitive Landscape Assessment & Long-Term Forecast to 2032
Overview
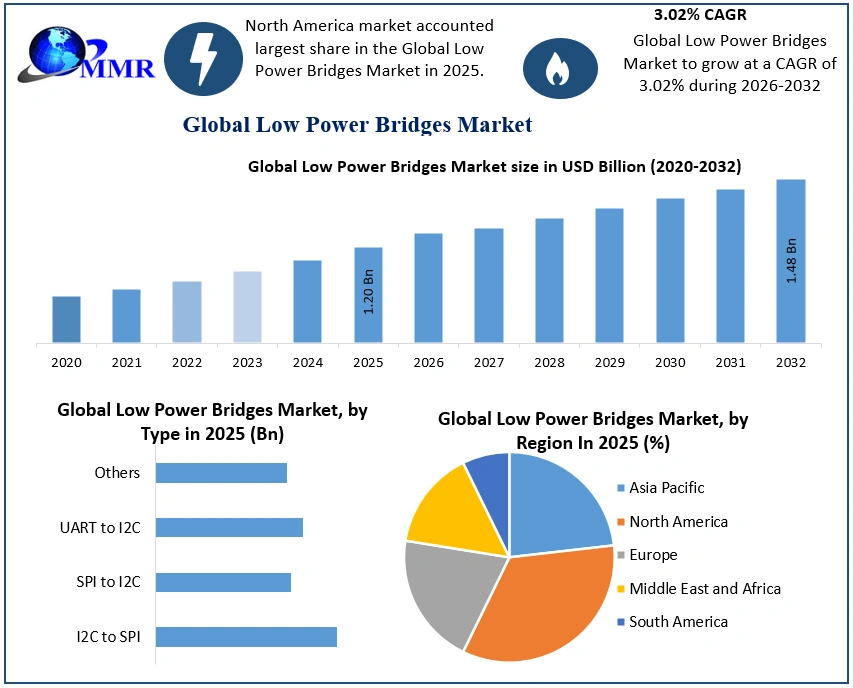
The Low Power Bridges Market size was valued at USD 1.20 Billion in 2025 and the total Low Power Bridges revenue is expected to grow at a CAGR of 3.02% from 2025 to 2032, reaching nearly USD 1.48 Billion by 2032.
Low Power Bridges Market Drivers and Restrains:
Low power bridge circuit is a topology of electrical circuitry, which was initially developed for laboratory measurement purposes. Currently, bridge circuits are used in several applications, both linear and non-linear, including instrumentation, filtering, and power conversion. In power supply design, a low power bridge circuit is an arrangement of similar devices refer to rectify an electric current i.e., to convert it from an alternating current polarity to a direct current polarity. Low-input voltage in devices offers power savings for consumers, which adds value to the newly introduced devices with an extended battery lifetime.
 To know about the Research Methodology:-Request Free Sample Report
Increase flexibility easily by providing built-in controls and growing adoption of IoT worldwide are anticipated to raise the need for low-power consumption and high performance, thereby boosting the demand for low-power bridges. However, high expenses involved in improving low-power bridges, a decline in the demand for consumer electronics and reduction in import duties led by government regulations are likely to hamper the global low-power bridges market during the forecast period.
Low power consumption of embedded systems is gaining widespread adoption in the automotive, consumer electronics, and home appliance sectors, which provide lucrative opportunities in the global low power bridge market. Similarly, cell phones contribute to the highest revenue in the low-power bridges market during the forecast period. The issue of stability in embedded systems are creating a challenge for manufacturers of the low power bridge market.
The report study has analyzed revenue impact of covid-19 pandemic on the sales revenue of market leaders, market followers and disrupters in the report and same is reflected in our analysis.
Low Power Bridges Market Segmentation Analysis:
Based on the type, the global market has been segmented into I2C to SPI, SPI to I2C, UART to I2C and Others. The I2C to SPI segments held the largest market share of xx% in 2025. I2C (inter-integrated circuits) and SPI (serial to peripheral interface) protocols deliver unique strengths and weaknesses for companies in the low-power bridges market. This type is being increasingly used in IC controllers and peripherals to communicate with each other and gaining increasing popularity as a standardized serial communication protocol. This protocol is being more used for communication between chips on a PCB (printed circuit board).
Regional Analysis:
Geographically, the market has been segmented into North America, Europe, Asia Pacific, Latin America, and Middle East & Africa. North America held the xx% share of the market in 2025 due to the high rate of infrastructure development and increasing advancements in the smartphone industry in the region. The low-power bridges market growth in the region can be accredited to significantly high investments in research & development activities by manufacturers operating in the region. Nations in the region are implementing low-power bridge technology by entering into several contracts and collaborations.
Therefore, the low-power bridges market in North America is witnessing consistent growth. Developing economies in the region are witnessing growth of the power industry. The market in Asia Pacific is expected to expand at a high CAGR of xx% during the forecast period owing to the presence of a large number of prominent players in the region, and continuous technological advancements. The rising adoption of low-power devices in developing economies in Asia Pacific led by technological advancements and cost efficiency of low-power bridges are driving the low-power bridges market in the region.
A report covers the recent development in market for the global market e.g., In February 2021 Nexperia is preparation to present new products with low-power bridge technology in the market, and rise its annual manufacturing ability to more than xx billion parts.
Low Power Bridges Market Competitive landscape
Major Key players operating in this market are NXP Semiconductors, Diodes Incorporated, Cypress Semiconductor Corporation, Texas Instrument, Maxim Integrated and STMicroelectronics. Manufacturers in the global low power bridges are focusing on competitive pricing as the strategy to capture significant market share. Moreover, strategic mergers and acquisitions and technological innovations are also the key focus areas of the manufacturers.
The objective of the report is to present a comprehensive analysis of Global market including all the stakeholders of the industry. The past and current status of the industry with forecasted market size and trends are presented in the report with the analysis of complicated data in simple language. The report covers all aspects of the industry with a dedicated study of key players that includes market leaders, followers and new entrants by region.
PORTER, SVOR, PESTEL analysis with the potential impact of micro-economic factors by region on the market are presented in the report. External as well as internal factors that are supposed to affect the business positively or negatively have been analyzed, which will give a clear futuristic view of the industry to the decision-makers. The report also helps in understanding Global market dynamics, structure by analyzing the market segments and project the Global market size. Clear representation of competitive analysis of key players By Type, Price, Financial position, Product portfolio, Growth strategies, and regional presence in the Global market make the report investor’s guide.
Low Power Bridges Market Scope: Inquire before buying
| Global Low Power Bridges Market | |||
|---|---|---|---|
| Report Coverage | Details | ||
| Base Year: | 2025 | Forecast Period: | 2026-2032 |
| Historical Data: | 2020 to 2025 | Market Size in 2025: | USD 1.20 Bn. |
| Forecast Period 2026 to 2032 CAGR: | 3.02% | Market Size in 2032: | USD 1.48 Bn. |
| Segments Covered: | by Type | I2C to SPI SPI to I2C UART to I2C Others |
|
| by Application | Cell Phones Home Appliances Cameras & Video Equipment Portable Game Devices Laptop & PCs Others |
||
Low Power Bridges Market, by Region
North America (United States, Canada, and Mexico)
Europe (UK, France, Germany, Italy, Spain, Sweden, Austria, and the Rest of Europe)
Asia Pacific (China, South Korea, Japan, India, Australia, ASEAN, Indonesia, Philippines, Malaysia, Vietnam, Thailand, ASEAN, Rest of Asia Pacific)
Middle East & Africa (South Africa, GCC, Nigeria, Rest of ME&A)
South America (Brazil, Argentina, Rest of South America)
Low Power Bridges Market, Key Players
1. NXP Semiconductors
2. Diodes Incorporated
3. Cypress Semiconductor Corporation
4. Texas Instrument
5. Maxim Integrated
6. STMicroelectronics
7. Microchip Technology Inc.
8. Toshiba Corporation
9. Nexperia
10. Maxlinear, Inc.
11. Lattice Semiconductor
12. On Semiconductor
13. Semtech Corp.
14. Silicon Laboratories
15. Analog Devices, Inc.
16. ROHM
17. Renesas Electronics
18. STMicroelectronics
Frequently Asked Questions:
1. Which region has the largest share in Global Low Power Bridges Market?
Ans: North America region held the highest share in 2025.
2. What is the growth rate of Global Low Power Bridges Market?
Ans: The Global Low Power Bridges Market is growing at a CAGR of 3.02% during forecasting period 2026-2032.
3. What is scope of the Global Low Power Bridges Market report?
Ans: Global Low Power Bridges Market report helps with the PESTEL, PORTER, COVID-19 Impact analysis, Recommendations for Investors & Leaders, and market estimation of the forecast period.
4. Who are the key players in Global Low Power Bridges Market?
Ans: The important key players in the Global Low Power Bridges Market are – NXP Semiconductors, Diodes Incorporated, Cypress Semiconductor Corporation, Texas Instrument, Maxim Integrated, STMicroelectronics, Microchip Technology Inc., Toshiba Corporation, Nexperia, Maxlinear, Inc., Lattice Semiconductor, On Semiconductor, Semtech Corp., Silicon Laboratories, Analog Devices, Inc., ROHM, Renesas Electronics, STMicroelectronics, and
5. What is the study period of this Market?
Ans: The Global Low Power Bridges Market is studied from 2025 to 2032.