Imaging Services Market: Global Industry Analysis and Forecast (2023-2029) Trends, Statistics, Dynamics, Segmentation by Imaging Modalities, Applications, End Users, and Region

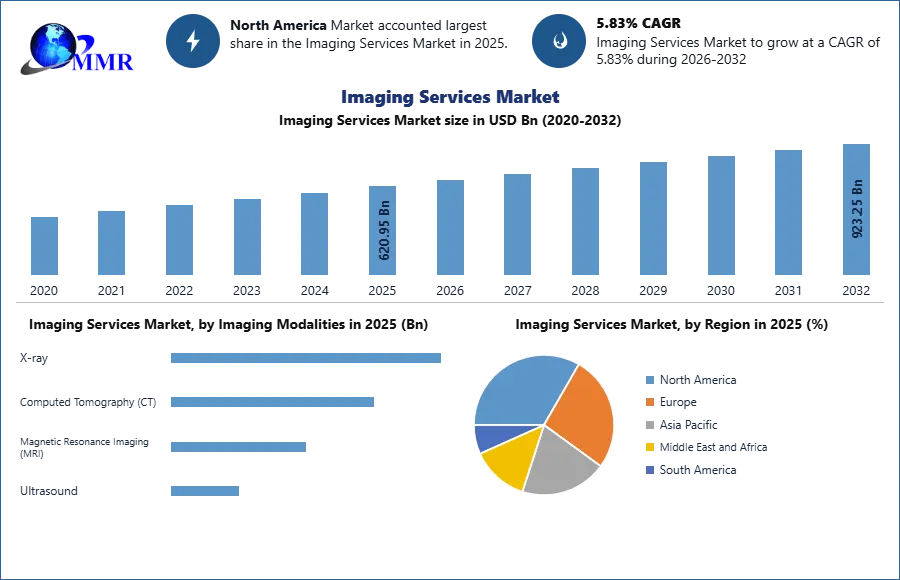
The Imaging Services Market size was valued at USD 563.3 Bn. in 2022 and the total Imaging Services Market revenue is expected to grow by 5.2% from 2023 to 2029, reaching nearly USD 803.24 Bn.

Imaging Services Market Overview:

The medical Imaging Services Market is growing at a steady pace as both demand and supply are well backed by the need and investment. Spending patterns show a positive outlook for medical imaging as more and more companies have started to make future R&D investments in hindsight of optimistic technological results. As technology continues to advance, allowing medical imaging to provide better care to patients. There are six important areas, which greatly improve the performance, workflow, accuracy, accessibility, remote maintenance, and diagnostic support of medical imaging, especially during challenging times like the COVID-19 pandemic. It is important to recognize that medical imaging is causing significant changes in the Imaging Services Market. Many people across the globe take benefit from these basic diagnostic imaging services. The World Health Organization (WHO) estimates that more than 50% of the world's population access imaging services. According to the MMR study a basic imaging department has one-X-ray machine, one operator, one darkroom or digital processor, and one ultrasound unit. This equipment serve a population of 10,000-50,000 people. It becomes a practical investment if it provides four or more examinations per day, although such a department with one operator make up to 15-20 examinations per day. With additional staff, the same equipment make at least 40 examinations per day. Imaging Services MarketTo know about the Research Methodology :- Request Free Sample Report

Imaging Services Market Dynamics:

Drivers Technological Advancements Boost Market Growth Technological advancements drive the demand for imaging services. Advances in imaging modalities improved the accuracy and resolution of diagnostic images. For example, the development of high-field strength magnets and advanced pulse sequences has enhanced the quality of MRI scans, allowing for better visualization of anatomical structures and pathological conditions. Similarly, improvements in CT scanner technology, such as multidetector row CT and dual-energy CT, have enabled faster and more detailed imaging with reduced radiation exposure. These advancements have increased the demand for imaging services as healthcare providers seek to leverage the benefits of these cutting-edge technologies. AI and machine learning algorithms have made significant contributions to the imaging services market. These technologies have the potential to assist radiologists in image interpretation, workflow optimization, and decision support. AI algorithms analyze large datasets, detect abnormalities, and provide quantitative measurements, thereby improving the efficiency and accuracy of diagnosis. AI-based tools have the potential to automate certain routine tasks, allowing radiologists to focus on complex cases and providing faster turnaround times for imaging reports. Therefore technological advancement accelerates market growth. Growing Investments in Healthcare Infrastructure Drive the Market Growth Governments investing in the development of healthcare infrastructure. This investment leads to the establishment of new imaging facilities and the upgrading of existing ones. This factor contributes to the growth of the imaging services market. Investments in healthcare infrastructure involve the modernization and upgrading of existing healthcare facilities. This includes replacing outdated imaging equipment with new one, more advanced technology. Upgrading imaging equipment helps healthcare providers offer better diagnostic capabilities and improve patient outcomes. The need for equipment replacement and upgrades contributes to the demand for imaging services. Additionally, Investments in healthcare infrastructure often focus on expanding healthcare services to underserved areas. This involves the establishment of healthcare facilities in rural regions that previously lacked access to advanced imaging services. By bringing imaging services closer to these communities, investments in healthcare infrastructure improve accessibility and ensure that a wider population benefits from diagnostic imaging. Growing investments in healthcare infrastructure contribute to the expansion, and modernization, of imaging services within the healthcare system. This leads to increased demand for imaging equipment and service provision, driving the growth of the imaging services market. Restrain High Costs of Imaging Services Hamper the Market Growth. Imaging services are expensive, both for healthcare providers as well as patients. The high costs associated with imaging equipment, and maintenance. Also, the need for skilled personas limits the accessibility and affordability of imaging services. This factor limits the market growth. The initial investment required to purchase and install imaging equipment, such as MRI machines, CT scanners, and ultrasound systems, can be substantial. These high costs create financial barriers for healthcare providers, particularly smaller clinics or facilities with limited budgets. The capital investment needed to establish or upgrade imaging facilities delay the availability of imaging services in certain areas or limits the expansion of existing services. Also, it includes maintenance and service contracts for the imaging equipment, costs associated with the procurement of contrast agents and other consumables, as well as expenses related to staffing and training qualified personnel. Therefore, the high cost of imaging services is a burden for patients, especially those without adequate insurance coverage. This results in delayed diagnoses compromised patient care, and potentially poorer health outcomes. Those all factors hinder the Imaging Market Growth. Opportunity Rising Demand for Advanced Imaging Modalities creates Lucrative Growth Opportunities for the Market. The demand for advanced imaging modalities, such as MRI, CT, and PET, is growing due to their ability to provide detailed and accurate diagnostic information. These advanced techniques provide clearer and more detailed images of the body structures and functions compared to traditional methods. Healthcare providers use these images to make more precise diagnoses. Medical conditions become complicated and varied. So, higher demand for advanced imaging services to ensure accurate and thorough diagnoses. Chronic diseases like heart disease, cancer, and neurological disorders are becoming more common worldwide, which adds to the need for advanced imaging. Advanced imaging modalities provide valuable insights into the progression and management of these conditions. They facilitate the monitoring of disease response to treatment, aid in the evaluation of disease recurrence, and assist in therapy planning. The rising prevalence of chronic diseases contributes to the growing demand for advanced imaging services.

Competitive Landscape:

The imaging services market is highly competitive. There are various competitors are driving the global Imaging Services Market. The report provides a comprehensive study of the key players such as RadNet Inc., Sonic Healthcare Limited, Quest Diagnostics Incorporated, LabCorp, Siemens Healthineers AG, GE Healthcare, Koninklijke Philips N.V., Fujifilm Holdings Corporation, Canon Medical Systems Corporation, and Hitachi, Ltd., Carestream Health, Inc., Agfa-Gevaert Group, Hologic, Inc., Esaote S.p.A., Varian Medical Systems, Inc., Mindray Medical International Limited. RadNet Inc.: Through Artificial intelligence and advanced technology the company provides the very best in patient care from 35 years of expertise, RadNet is Leading Radiology Forward. The company is a national leader in providing high-quality, cost-effective, fixed-site outpatient diagnostic imaging services. In October 2020 the company did partnership with CommonSpirit Health to expand the business. The key players of the Global Imaging Services Market ARE major focuses on product advancement and company expansion. Also through partnerships and acquisitions, the key players try to expand their market shares in the healthcare industry.

Imaging Services Market Segment Analysis:

Based on Imaging Modalities, the X-ray segment dominates the Imaging Services Market in the year 2021. X-ray imaging remains a widely used modality due to its accessibility, cost-effectiveness, and ability to provide quick results. It is commonly employed for diagnosing bone fractures, lung conditions, and dental examinations. X-ray systems are available in various settings, ranging from hospitals to smaller clinics, and even portable devices for field use. Nowadays AI and ML-based X-ray machines demand is increasing. For example, recent years have been showing a promising trend in the approval of AI/ML both in the EU & USA. The number of AI/ML medical devices that are approved each year is increasing and in 2021 the biggest portion of it is coming from radiology devices. Imaging Services Market2Ultrasound Imaging is the fastest-growing segment of the global Imaging Services Market. With high-frequency sound waves to produce real-time images of organs the adoption of ultrasound imaging is increasing. It is largely used in cardiology and other medical specialties. Ultrasound systems are relatively portable and cost-effective compared to other modalities. Therefore, the adoption of Ultrasound Imaging is rising. Imaging Services Market3

Regional Insight:

North America region dominates the global Imaging Services Market in the year 2022. North America is one of the leading regions in the imaging services market. The United States has a well-established healthcare infrastructure and high adoption rates of advanced imaging technologies. The large patient population, favorable reimbursement policies, and continuous technological advancements boost the market growth in this region. The market is growing due to a strong healthcare system, increasing awareness about early disease detection, and a growing elderly population there are several notable trends shaping the North America Imaging Services Market. These include a shift towards outpatient imaging centers, increased adoption of teleimaging and teleradiology, growing demand for personalized medicine, and the integration of artificial intelligence (AI) and machine learning in imaging analysis.

Imaging Services Market4

Imaging Services Market Scope: Inquire before buying

Imaging Services Market
Report Coverage Details
Base Year: 2022 Forecast Period: 2023-2029
Historical Data: 2017 to 2022 Market Size in 2022: US$ 563.3 Bn.
Forecast Period 2023 to 2029 CAGR: 5.2 % Market Size in 2029: US$ 803.24 Bn.
Segments Covered: by Imaging Modalities X-ray Computed Tomography (CT) Magnetic Resonance Imaging (MRI) Ultrasound
by Application Oncology Cardiology Neurology Orthopaedics Gastroenterology Others
by End User Hospitals and Clinics Diagnostic Imaging Centers Research and Academic Institutes Others

Imaging Services Market by Region

North America (United States, Canada, and Mexico) Europe (UK, France, Germany, Italy, Spain, Sweden, Austria, and the Rest of Europe) Asia Pacific (China, South Korea, Japan, India, Australia, Indonesia, Malaysia, Vietnam, Taiwan, Bangladesh, Pakistan, and the Rest of APAC) Middle East and Africa (South Africa, GCC, Egypt, Nigeria, and the Rest of ME&A) South America (Brazil, Argentina Rest of South America)

Key Players

1. RadNet, Inc. 2. Sonic Healthcare Limited 3. Quest Diagnostics Incorporated 4. LabCorp 5. Siemens Healthineers AG 6. GE Healthcare 7. Koninklijke Philips N.V. 8. Fujifilm Holdings Corporation 9. Canon Medical Systems Corporation 10. Hitachi, Ltd. 11. Carestream Health, Inc. 12. Agfa-Gevaert Group 13. Hologic, Inc. 14. Esaote S.p.A. 15. Varian Medical Systems, Inc. 16. Mindray Medical International Limited Frequently Asked Questions: 1] What segments are covered in the Global Imaging Services Market report? Ans. The segments covered in the Imaging Services Market report are based on Imaging Modalities, Applications, End Users, and Regions. 2] Which region is expected to hold the highest share in the Global Imaging Services Market? Ans. The North American region is expected to hold the highest share of the Imaging Services Market. 3] What is the market size of the Global Imaging Services Market by 2029? Ans. The market size of the Imaging Services Market by 2029 is expected to reach US$ 803.24Bn. 4] What is the forecast period for the Global Imaging Services Market? Ans. The forecast period for the Imaging Services Market is 2023-2029. 5] What was the market size of the Global Imaging Services Market in 2022? Ans. The market size of the Imaging Services Market in 2022 was valued at US$ 563.3 Bn.
1. Imaging Services Market Introduction 1.1. Study Assumption and Market Definition 1.2. Scope of the Study 1.3. Executive Summary 2. Imaging Services Market: Dynamics 2.1. Imaging Services Market Trends by Region 2.1.1. North America Imaging Services Market Trends 2.1.2. Europe Imaging Services Market Trends 2.1.3. Asia Pacific Imaging Services Market Trends 2.1.4. Middle East and Africa Imaging Services Market Trends 2.1.5. South America Imaging Services Market Trends 2.2. Imaging Services Market Dynamics by Region 2.2.1. North America 2.2.1.1. North America Imaging Services Market Drivers 2.2.1.2. North America Imaging Services Market Restraints 2.2.1.3. North America Imaging Services Market Opportunities 2.2.1.4. North America Imaging Services Market Challenges 2.2.2. Europe 2.2.2.1. Europe Imaging Services Market Drivers 2.2.2.2. Europe Imaging Services Market Restraints 2.2.2.3. Europe Imaging Services Market Opportunities 2.2.2.4. Europe Imaging Services Market Challenges 2.2.3. Asia Pacific 2.2.3.1. Asia Pacific Imaging Services Market Drivers 2.2.3.2. Asia Pacific Imaging Services Market Restraints 2.2.3.3. Asia Pacific Imaging Services Market Opportunities 2.2.3.4. Asia Pacific Imaging Services Market Challenges 2.2.4. Middle East and Africa 2.2.4.1. Middle East and Africa Imaging Services Market Drivers 2.2.4.2. Middle East and Africa Imaging Services Market Restraints 2.2.4.3. Middle East and Africa Imaging Services Market Opportunities 2.2.4.4. Middle East and Africa Imaging Services Market Challenges 2.2.5. South America 2.2.5.1. South America Imaging Services Market Drivers 2.2.5.2. South America Imaging Services Market Restraints 2.2.5.3. South America Imaging Services Market Opportunities 2.2.5.4. South America Imaging Services Market Challenges 2.3. PORTER’s Five Forces Analysis 2.4. PESTLE Analysis 2.5. Technology Roadmap 2.6. Regulatory Landscape by Region 2.6.1. North America 2.6.2. Europe 2.6.3. Asia Pacific 2.6.4. Middle East and Africa 2.6.5. South America 2.7. Key Opinion Leader Analysis For Imaging Services Industry 2.8. Analysis of Government Schemes and Initiatives For Imaging Services Industry 2.9. Imaging Services Market Trade Analysis 2.10. The Global Pandemic Impact on Imaging Services Market 3. Imaging Services Market: Global Market Size and Forecast by Segmentation by Demand and Supply Side (by Value in USD Million) 2022-2029 3.1. Imaging Services Market Size and Forecast, by Imaging Modalities (2022-2029) 3.1.1. X-ray 3.1.2. Computed Tomography (CT) 3.1.3. Magnetic Resonance Imaging (MRI) 3.1.4. Ultrasound 3.2. Imaging Services Market Size and Forecast, by Application (2022-2029) 3.2.1. Oncology 3.2.2. Cardiology 3.2.3. Neurology 3.2.4. Orthopaedics 3.2.5. Gastroenterology 3.2.6. Others 3.3. Imaging Services Market Size and Forecast, by End-user (2022-2029) 3.3.1. Hospitals and Clinics 3.3.2. Diagnostic Imaging Centers 3.3.3. Research and Academic Institutes 3.3.4. Others 3.4. Imaging Services Market Size and Forecast, by Region (2022-2029) 3.4.1. North America 3.4.2. Europe 3.4.3. Asia Pacific 3.4.4. Middle East and Africa 3.4.5. South America 4. North America Imaging Services Market Size and Forecast by Segmentation (by Value in USD Million) 2022-2029 4.1. North America Imaging Services Market Size and Forecast, by Imaging Modalities (2022-2029) 4.1.1. X-ray 4.1.2. Computed Tomography (CT) 4.1.3. Magnetic Resonance Imaging (MRI) 4.1.4. Ultrasound 4.2. North America Imaging Services Market Size and Forecast, by Application (2022-2029) 4.2.1. Oncology 4.2.2. Cardiology 4.2.3. Neurology 4.2.4. Orthopaedics 4.2.5. Gastroenterology 4.2.6. Others 4.3. North America Imaging Services Market Size and Forecast, by End-user (2022-2029) 4.3.1. Hospitals and Clinics 4.3.2. Diagnostic Imaging Centers 4.3.3. Research and Academic Institutes 4.3.4. Others 4.4. North America Imaging Services Market Size and Forecast, by Country (2022-2029) 4.4.1. United States 4.4.1.1. United States Imaging Services Market Size and Forecast, by Imaging Modalities (2022-2029) 4.4.1.1.1. X-ray 4.4.1.1.2. Computed Tomography (CT) 4.4.1.1.3. Magnetic Resonance Imaging (MRI) 4.4.1.1.4. Ultrasound 4.4.1.2. United States Imaging Services Market Size and Forecast, by Application (2022-2029) 4.4.1.2.1. Oncology 4.4.1.2.2. Cardiology 4.4.1.2.3. Neurology 4.4.1.2.4. Orthopaedics 4.4.1.2.5. Gastroenterology 4.4.1.2.6. Others 4.4.1.3. United States Imaging Services Market Size and Forecast, by End-user (2022-2029) 4.4.1.3.1. Hospitals and Clinics 4.4.1.3.2. Diagnostic Imaging Centers 4.4.1.3.3. Research and Academic Institutes 4.4.1.3.4. Others 4.4.2. Canada 4.4.2.1. Canada Imaging Services Market Size and Forecast, by Imaging Modalities (2022-2029) 4.4.2.1.1. X-ray 4.4.2.1.2. Computed Tomography (CT) 4.4.2.1.3. Magnetic Resonance Imaging (MRI) 4.4.2.1.4. Ultrasound 4.4.2.2. Canada Imaging Services Market Size and Forecast, by Application (2022-2029) 4.4.2.2.1. Oncology 4.4.2.2.2. Cardiology 4.4.2.2.3. Neurology 4.4.2.2.4. Orthopaedics 4.4.2.2.5. Gastroenterology 4.4.2.2.6. Others 4.4.2.3. Canada Imaging Services Market Size and Forecast, by End-user (2022-2029) 4.4.2.3.1. Hospitals and Clinics 4.4.2.3.2. Diagnostic Imaging Centers 4.4.2.3.3. Research and Academic Institutes 4.4.2.3.4. Others 4.4.3. Mexico 4.4.3.1. Mexico Imaging Services Market Size and Forecast, by Imaging Modalities (2022-2029) 4.4.3.1.1. X-ray 4.4.3.1.2. Computed Tomography (CT) 4.4.3.1.3. Magnetic Resonance Imaging (MRI) 4.4.3.1.4. Ultrasound 4.4.3.2. Mexico Imaging Services Market Size and Forecast, by Application (2022-2029) 4.4.3.2.1. Oncology 4.4.3.2.2. Cardiology 4.4.3.2.3. Neurology 4.4.3.2.4. Orthopaedics 4.4.3.2.5. Gastroenterology 4.4.3.2.6. Others 4.4.3.3. Mexico Imaging Services Market Size and Forecast, by End-user (2022-2029) 4.4.3.3.1. Hospitals and Clinics 4.4.3.3.2. Diagnostic Imaging Centers 4.4.3.3.3. Research and Academic Institutes 4.4.3.3.4. Others 5. Europe Imaging Services Market Size and Forecast by Segmentation (by Value in USD Million) 2022-2029 5.1. Europe Imaging Services Market Size and Forecast, by Imaging Modalities (2022-2029) 5.1. Europe Imaging Services Market Size and Forecast, by Application (2022-2029) 5.1. Europe Imaging Services Market Size and Forecast, by End-user (2022-2029) 5.4. Europe Imaging Services Market Size and Forecast, by Country (2022-2029) 5.4.1. United Kingdom 5.4.1.1. United Kingdom Imaging Services Market Size and Forecast, by Imaging Modalities (2022-2029) 5.4.1.2. United Kingdom Imaging Services Market Size and Forecast, by Application (2022-2029) 5.4.1.3. United Kingdom Imaging Services Market Size and Forecast, by End-user (2022-2029) 5.4.2. France 5.4.2.1. France Imaging Services Market Size and Forecast, by Imaging Modalities (2022-2029) 5.4.2.2. France Imaging Services Market Size and Forecast, by Application (2022-2029) 5.4.2.3. France Imaging Services Market Size and Forecast, by End-user (2022-2029) 5.4.3. Germany 5.4.3.1. Germany Imaging Services Market Size and Forecast, by Imaging Modalities (2022-2029) 5.4.3.2. Germany Imaging Services Market Size and Forecast, by Application (2022-2029) 5.4.3.3. Germany Imaging Services Market Size and Forecast, by End-user (2022-2029) 5.4.4. Italy 5.4.4.1. Italy Imaging Services Market Size and Forecast, by Imaging Modalities (2022-2029) 5.4.4.2. Italy Imaging Services Market Size and Forecast, by Application (2022-2029) 5.4.4.3. Italy Imaging Services Market Size and Forecast, by End-user (2022-2029) 5.4.5. Spain 5.4.5.1. Spain Imaging Services Market Size and Forecast, by Imaging Modalities (2022-2029) 5.4.5.2. Spain Imaging Services Market Size and Forecast, by Application (2022-2029) 5.4.5.3. Spain Imaging Services Market Size and Forecast, by End-user (2022-2029) 5.4.6. Sweden 5.4.6.1. Sweden Imaging Services Market Size and Forecast, by Imaging Modalities (2022-2029) 5.4.6.2. Sweden Imaging Services Market Size and Forecast, by Application (2022-2029) 5.4.6.3. Sweden Imaging Services Market Size and Forecast, by End-user (2022-2029) 5.4.7. Austria 5.4.7.1. Austria Imaging Services Market Size and Forecast, by Imaging Modalities (2022-2029) 5.4.7.2. Austria Imaging Services Market Size and Forecast, by Application (2022-2029) 5.4.7.3. Austria Imaging Services Market Size and Forecast, by End-user (2022-2029) 5.4.8. Rest of Europe 5.4.8.1. Rest of Europe Imaging Services Market Size and Forecast, by Imaging Modalities (2022-2029) 5.4.8.2. Rest of Europe Imaging Services Market Size and Forecast, by Application (2022-2029) 5.4.8.3. Rest of Europe Imaging Services Market Size and Forecast, by End-user (2022-2029) 6. Asia Pacific Imaging Services Market Size and Forecast by Segmentation (by Value in USD Million) 2022-2029 6.1. Asia Pacific Imaging Services Market Size and Forecast, by Imaging Modalities (2022-2029) 6.2. Asia Pacific Imaging Services Market Size and Forecast, by Application (2022-2029) 6.3. Asia Pacific Imaging Services Market Size and Forecast, by End-user (2022-2029) 6.4. Asia Pacific Imaging Services Market Size and Forecast, by Country (2022-2029) 6.4.1. China 6.4.1.1. China Imaging Services Market Size and Forecast, by Imaging Modalities (2022-2029) 6.4.1.2. China Imaging Services Market Size and Forecast, by Application (2022-2029) 6.4.1.3. China Imaging Services Market Size and Forecast, by End-user (2022-2029) 6.4.2. S Korea 6.4.2.1. S Korea Imaging Services Market Size and Forecast, by Imaging Modalities (2022-2029) 6.4.2.2. S Korea Imaging Services Market Size and Forecast, by Application (2022-2029) 6.4.2.3. S Korea Imaging Services Market Size and Forecast, by End-user (2022-2029) 6.4.3. Japan 6.4.3.1. Japan Imaging Services Market Size and Forecast, by Imaging Modalities (2022-2029) 6.4.3.2. Japan Imaging Services Market Size and Forecast, by Application (2022-2029) 6.4.3.3. Japan Imaging Services Market Size and Forecast, by End-user (2022-2029) 6.4.4. India 6.4.4.1. India Imaging Services Market Size and Forecast, by Imaging Modalities (2022-2029) 6.4.4.2. India Imaging Services Market Size and Forecast, by Application (2022-2029) 6.4.4.3. India Imaging Services Market Size and Forecast, by End-user (2022-2029) 6.4.5. Australia 6.4.5.1. Australia Imaging Services Market Size and Forecast, by Imaging Modalities (2022-2029) 6.4.5.2. Australia Imaging Services Market Size and Forecast, by Application (2022-2029) 6.4.5.3. Australia Imaging Services Market Size and Forecast, by End-user (2022-2029) 6.4.6. Indonesia 6.4.6.1. Indonesia Imaging Services Market Size and Forecast, by Imaging Modalities (2022-2029) 6.4.6.2. Indonesia Imaging Services Market Size and Forecast, by Application (2022-2029) 6.4.6.3. Indonesia Imaging Services Market Size and Forecast, by End-user (2022-2029) 6.4.7. Malaysia 6.4.7.1. Malaysia Imaging Services Market Size and Forecast, by Imaging Modalities (2022-2029) 6.4.7.2. Malaysia Imaging Services Market Size and Forecast, by Application (2022-2029) 6.4.7.3. Malaysia Imaging Services Market Size and Forecast, by End-user (2022-2029) 6.4.8. Vietnam 6.4.8.1. Vietnam Imaging Services Market Size and Forecast, by Imaging Modalities (2022-2029) 6.4.8.2. Vietnam Imaging Services Market Size and Forecast, by Application (2022-2029) 6.4.8.3. Vietnam Imaging Services Market Size and Forecast, by End-user (2022-2029) 6.4.9. Taiwan 6.4.9.1. Taiwan Imaging Services Market Size and Forecast, by Imaging Modalities (2022-2029) 6.4.9.2. Taiwan Imaging Services Market Size and Forecast, by Application (2022-2029) 6.4.9.3. Taiwan Imaging Services Market Size and Forecast, by End-user (2022-2029) 6.4.10. Rest of Asia Pacific 6.4.10.1. Rest of Asia Pacific Imaging Services Market Size and Forecast, by Imaging Modalities (2022-2029) 6.4.10.2. Rest of Asia Pacific Imaging Services Market Size and Forecast, by Application (2022-2029) 6.4.10.3. Rest of Asia Pacific Imaging Services Market Size and Forecast, by End-user (2022-2029) 7. Middle East and Africa Imaging Services Market Size and Forecast by Segmentation (by Value in USD Million) 2022-2029 7.1. Middle East and Africa Imaging Services Market Size and Forecast, by Imaging Modalities (2022-2029) 7.2. Middle East and Africa Imaging Services Market Size and Forecast, by Application (2022-2029) 7.3. Middle East and Africa Imaging Services Market Size and Forecast, by End-user (2022-2029) 7.4. Middle East and Africa Imaging Services Market Size and Forecast, by Country (2022-2029) 7.4.1. South Africa 7.4.1.1. South Africa Imaging Services Market Size and Forecast, by Imaging Modalities (2022-2029) 7.4.1.2. South Africa Imaging Services Market Size and Forecast, by Application (2022-2029) 7.4.1.3. South Africa Imaging Services Market Size and Forecast, by End-user (2022-2029) 7.4.2. GCC 7.4.2.1. GCC Imaging Services Market Size and Forecast, by Imaging Modalities (2022-2029) 7.4.2.2. GCC Imaging Services Market Size and Forecast, by Application (2022-2029) 7.4.2.3. GCC Imaging Services Market Size and Forecast, by End-user (2022-2029) 7.4.3. Nigeria 7.4.3.1. Nigeria Imaging Services Market Size and Forecast, by Imaging Modalities (2022-2029) 7.4.3.2. Nigeria Imaging Services Market Size and Forecast, by Application (2022-2029) 7.4.3.3. Nigeria Imaging Services Market Size and Forecast, by End-user (2022-2029) 7.4.4. Rest of ME&A 7.4.4.1. Rest of ME&A Imaging Services Market Size and Forecast, by Imaging Modalities (2022-2029) 7.4.4.2. Rest of ME&A Imaging Services Market Size and Forecast, by Application (2022-2029) 7.4.4.3. Rest of ME&A Imaging Services Market Size and Forecast, by End-user (2022-2029) 8. South America Imaging Services Market Size and Forecast by Segmentation (by Value in USD Million) 2022-2029 8.1. South America Imaging Services Market Size and Forecast, by Imaging Modalities (2022-2029) 8.2. South America Imaging Services Market Size and Forecast, by Application (2022-2029) 8.3. South America Imaging Services Market Size and Forecast, by End-user(2022-2029) 8.4. South America Imaging Services Market Size and Forecast, by Country (2022-2029) 8.4.1. Brazil 8.4.1.1. Brazil Imaging Services Market Size and Forecast, by Imaging Modalities (2022-2029) 8.4.1.2. Brazil Imaging Services Market Size and Forecast, by Application (2022-2029) 8.4.1.3. Brazil Imaging Services Market Size and Forecast, by End-user (2022-2029) 8.4.2. Argentina 8.4.2.1. Argentina Imaging Services Market Size and Forecast, by Imaging Modalities (2022-2029) 8.4.2.2. Argentina Imaging Services Market Size and Forecast, by Application (2022-2029) 8.4.2.3. Argentina Imaging Services Market Size and Forecast, by End-user (2022-2029) 8.4.3. Rest Of South America 8.4.3.1. Rest Of South America Imaging Services Market Size and Forecast, by Imaging Modalities (2022-2029) 8.4.3.2. Rest Of South America Imaging Services Market Size and Forecast, by Application (2022-2029) 8.4.3.3. Rest Of South America Imaging Services Market Size and Forecast, by End-user (2022-2029) 9. Global Imaging Services Market: Competitive Landscape 9.1. MMR Competition Matrix 9.2. Competitive Landscape 9.3. Key Players Benchmarking 9.3.1. Company Name 9.3.2. Business Segment 9.3.3. End-user Segment 9.3.4. Revenue (2022) 9.3.5. Company Locations 9.4. Leading Imaging Services Market Companies, by market capitalization 9.5. Market Structure 9.5.1. Market Leaders 9.5.2. Market Followers 9.5.3. Emerging Players 9.6. Mergers and Acquisitions Details 10. Company Profile: Key Players 10.1. RadNet, Inc. 10.1.1. Company Overview 10.1.2. Business Portfolio 10.1.3. Financial Overview 10.1.4. SWOT Analysis 10.1.5. Strategic Analysis 10.1.6. Scale of Operation (small, medium, and large) 10.1.7. Details on Partnership 10.1.8. Regulatory Accreditations and Certifications Received by Them 10.1.9. Awards Received by the Firm 10.1.10. Recent Developments 10.2. Sonic Healthcare Limited 10.3. Quest Diagnostics Incorporated 10.4. LabCorp 10.5. Siemens Healthineers AG 10.6. GE Healthcare 10.7. Koninklijke Philips N.V. 10.8. Fujifilm Holdings Corporation 10.9. Canon Medical Systems Corporation 10.10. Hitachi, Ltd. 10.11. Carestream Health, Inc. 10.12. Agfa-Gevaert Group 10.13. Hologic, Inc. 10.14. Esaote S.p.A. 10.15. Varian Medical Systems, Inc. 10.16. Mindray Medical International Limited 11. Key Findings 12. Industry Recommendations 13. Imaging Services Market: Research Methodology 14. Terms and Glossary
  • INQUIRE BEFORE BUYING