
Solar Energy Market Size by Technology, Solar Module, End-user, Application, Product Type, Service Provided, Region – Segment-Level Market Assessment, Growth Opportunity Analysis, Competitive Mapping & Forecast to 2032
Overview
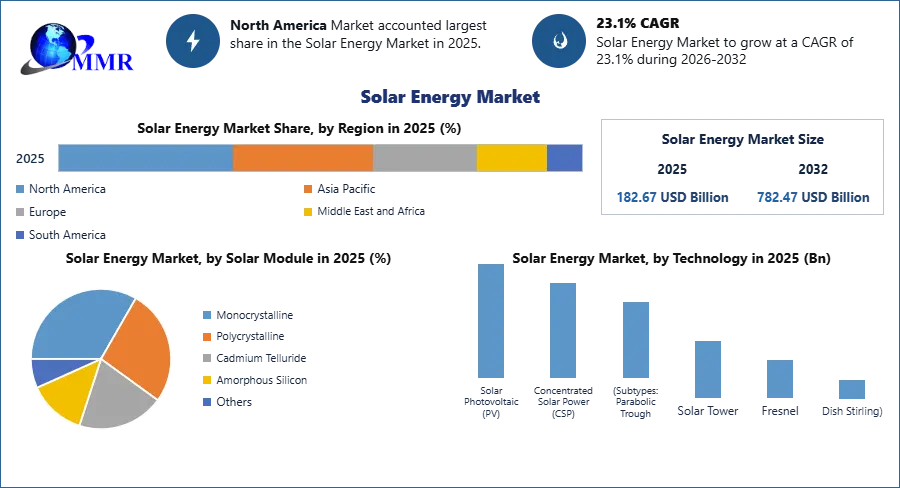
The Solar Energy Market size was valued at USD 182.67 Billion in 2025 and the total Solar Energy revenue is expected to grow at a CAGR of 23.1% from 2026 to 2032, reaching nearly USD 782.47 Billion.
Solar Energy Market Overview:
Solar is one of the renewable energy sources that has grown significantly over the last four years, with nearly 100 gigawatts (GW) of solar power addition each year. In 2025, the solar energy installed capacity grew by almost 20.6% compared to the previous year. Solar photovoltaic and Concentrated Solar Power (CSP) are the key technologies available in the market to absorb solar energy and to utilize it for different purposes. Factors, such as favorable government policies and increasing adoption of solar process, with the declining price of solar panels and installation cost, are likely to support the global solar energy market.
 To know about the Research Methodology :- Request Free Sample Report
Solar Energy Market Dynamics:
Concerning the increasing carbon emission, governments worldwide have launched various policies regarding the development of renewable energy. The policies have been providing a significant boost to the growth of the solar energy market globally. Though global investments in the solar energy sector dropped by 3% in 2025 (lowest since 2013), the market continued to witness growth in terms of installed capacity due to favourable government policies in countries like South Africa, Spain, and Vietnam.
China is a significant contributor to the global solar PV market. Any changes in its policies significantly impact the global solar PV market. With a lack of clarity on its FiT policy and reduced subsidy in solar projects, China witnessed a significant drop in investment during 2025. However, with the launch of the revised FiT policy, effective from July 2021, the market is expected to regain the momentum for solar project development during the forecast period.
Moreover, according to estimations of Asia Europe Clean Energy (Solar) Advisory Co. Ltd, the demand for utility-scale solar projects is expected to reach 60-75 GW capacity in China during 2025. In 2021, China planned to install 41 GW (including 3.5 GW of residential PV) of solar projects, but on account of delay in policy release, unavailability of land, challenges to mobilize financing, and grid connection issues, only 17.5 GW was installed by October 2021. Globally, the demand for a peak power source is increasing due to the surging usage of electrical equipment. The high rate of electrical equipment usage leads to a sudden increase in electricity demand at particular times of the day. Utilities need to upscale their power supply to meet the increased demand for electricity. In such a scenario, the power generation infrastructure must be capable of rapidly ramping up electricity generation.
Gas-fired power plants can be synchronized with the grid, unlike renewable power sources, making them peak load power plants. Thus, gas power plants may become the preferred choice for the utilities than any other power generation type, including solar power. Moreover, the increasing investments in wind power projects are providing a significant boost to the growth of the wind power market globally. According to the Global Wind Energy Council (GWEC), globally, 93 GW of new wind energy installations were added in 2025. Such an increase in the number of installations, despite the pandemic, was because of the installation rush in countries such as China.
Solar Energy Market Segment Analysis:
On the basis of technology, Solar Energy market is segmented into solar photovoltaic (PV) and Concentrated solar power (CSP). Solar photovoltaic (PV) is expected to account for the largest annual capacity additions for renewables, well above wind and hydro, for the next five years. According to IEA, solar PV generation increased by 22% in 2025, reaching 720 TWh, representing the second-largest absolute generation growth of all renewable technologies, slightly behind wind. With this increase, the solar PV share in global electricity generation is now almost 3%.
The continuous technology cost reductions and the increasing growth in China, India, and other Asia-Pacific and European countries, owing to policy changes and growing focus on achieving various capacity targets, are expected to contribute to the increase in the growth of the solar PV market the forecast period. The solar PV market cut costs dramatically during the past six years through economies of scale. As the market was flooded with equipment, prices plummeted, the cost of solar panels dropped exponentially, resulting in the increasing adoption of solar PV systems.
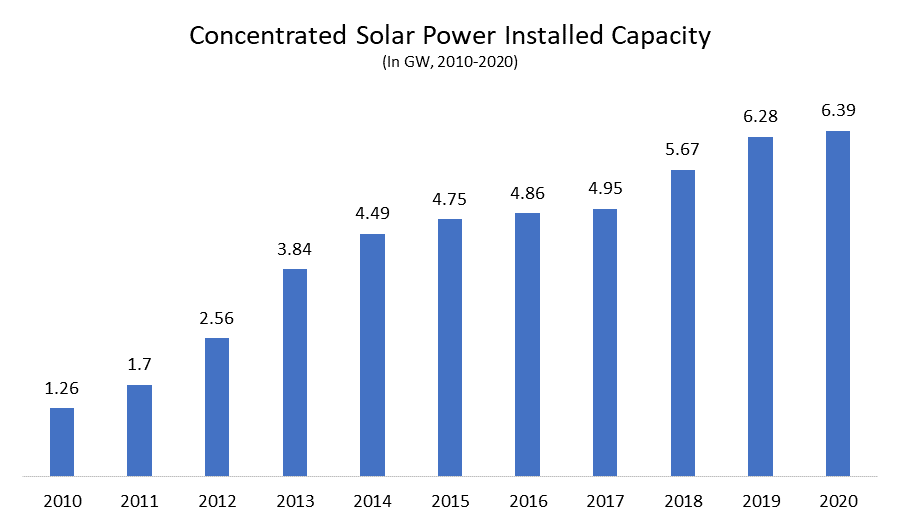
Concentrated solar power (CSP) technology uses different mirror configurations to concentrate energy from sunlight onto a receiver and convert it into heat. The heat is then used to create steam to drive turbine, in order to produce electrical power, or as an industrial process heat. CSP plants can integrate thermal energy storage systems to generate electricity during cloudy spells or for hours after sunset and before sunrise. These features make concentrated solar power the most attractive renewable energy option in the world’s Sunbelt regions. CSP plants with thermal energy storage involve higher installation costs. However, they allow high-capacity factor, leading to a lower levelized cost of electricity (LCOE).
The CSP industry is gaining importance in the developing as well as developed nations, due to high solar irradiation, supported by its ability to store energy after daylight. Moreover, the CSP industry has become increasingly diverse geographically, in terms of the location of commercial plants as well as the origins of developers, investors and contractors involved in project implementation.
Regional Insights:
The Solar Energy market is studied for North America, Europe, APAC, MEA and South America region. Solar power has become more accessible, and prevalent in the United States than ever before. According to Solar Energy Industries Association (SEIA), in 2021, solar energy accounted for 43% of all new electricity generating capacity added to the grid. Since 2011, solar installations in the country have grown 30-fold and total installed capacity in the United States reached 97.70 GW in 2021, representing an increase of over 24.45% compared to the previous year’s value. Markets for solar energy are maturing rapidly around the country, and solar electricity is now economically-competitive with conventional energy sources in several states, including California, Hawaii, and Minnesota.
In addition to the solar PV market, concentrating solar power (CSP) is another method for capturing energy from the sun, and seven southwestern states have the technical potential and land area to site enough CSP to supply more than four times the current annual electricity demand in the United States. However, CSP accounts for only 1.8% of total solar energy installed capacity in the country and the development of CSP projects stalled since 2021 due to a high competition for solar PV technology.
In Germany, the coalition agreement of March 2021 provides for an interim goal to increase the share of renewable energies (RE) to 65% of gross electricity consumption by 2030. For this, an average annual PV addition of at least 5-10 GW is necessary, depending on the development of electricity demand and the expansion of wind power. The federal government's draft climate protection program of October 9, 2021 provides for a total expansion target of 98 GWp photovoltaics by 2030. This would require an average of 4.5 GW/annum of additional PV systems.
At the end of 2025, the country had a total cumulative photovoltaic capacity of 54 GW. According to Fraunhofer ISE, approximately two million solar power systems provided around 10.4% of net electricity generation in Germany. The major driver for the country's solar energy market has been the FiT scheme, which has made it lucrative for homeowners as well as small businesses to opt for solar power.
Depending on the system size, the feed-in tariff for small roof systems put into operation until January 2021 can be up to EUR 9.87 /kWh and is guaranteed to the operator over the next ltwenty years. For medium-size systems from 750 kW up to 10 MW, the licensing agreement sets the feed-in tariff. Globally, solar photovoltaic (PV) installations started booming since 2010 and had an annual growth rate of 40%. China has been leading growth momentum since then. In 2021, the country ranked number one for the first time, both in terms of the installed capacity and power generation. Two years down the line, in 2021, China reached the capacity of 130 GW solar PV, which was nearly six times the capacity of the three largest hydroelectric plants in the world. In terms of concentrated solar power, a total capacity of 381.6 MW solar thermal projects were newly built up across the world in 2025, making an increase rate of 6.29%.
Further, in 2021, the country added around 48.2 GW capacity, and the country remains one of the largest markets for the third time in a row followed. The country’s solar capacity addition increased from 30.05 GW in 2021 to 48.2 GW in 2021 due to the government effort in controlling the pandemic, which very few of the other countries across the world were able to do.
The country has already achieved its solar energy goal for 2025, two years ahead of schedule. In China, most of the solar PV projects are concentrated in the eastern and southern parts of the country. In these two regions, the economy is the most prosperous and has the maximum demand for solar power. Further, the province of Guangdong added the newest PV capacity, with 600 MW to the end of March 2025, followed by Inner Mongolia, with 470 MW, Zhejiang 360 MW, Shanxi 290 MW, and Shandong 280 MW.
China has also secured the position of the largest solar panel technology manufacturer in the world. As of 2025, the country manufactures more than 60% of the solar panels globally. China’s dominance in solar panel manufacturing is evident from the fact that out of the top ten solar panel manufacturers globally, seven are Chinese firms.
The objective of the report is to present a comprehensive analysis of the global Solar Energy market to the stakeholders in the industry. The past and current status of the industry with the forecasted market size and trends are presented in the report with the analysis of complicated data in simple language. The report covers all the aspects of the industry with a dedicated study of key players that include market leaders, followers, and new entrants.
PORTER, PESTEL analysis with the potential impact of micro-economic factors of the market have been presented in the report. External as well as internal factors that are supposed to affect the business positively or negatively have been analyzed, which will give a clear futuristic view of the industry to the decision-makers.
The report also helps in understanding the global Solar Energy market dynamics, structure by analyzing the market segments and project the global Solar Energy market size. Clear representation of competitive analysis of key players by product, price, financial position, product portfolio, growth strategies, and regional presence in the global Solar Energy market make the report investor’s guide.
Recent Industry Developments
| Exact Date | Company | Development | Impact |
|---|---|---|---|
| 10 April 2026 | Ministry of New and Renewable Energy | India officially recorded its highest-ever annual solar capacity addition of approximately 45 GW for the financial year 2025-26. | This milestone solidifies India's position as a top-tier global market for rapid solar infrastructure deployment and energy transition. |
| 07 April 2026 | Government of India | Announced the opening of bids for grid-scale battery storage manufacturing to support the stabilization of massive solar inputs. | The move is critical for reducing curtailment and ensuring the reliability of solar-heavy power grids during peak demand. |
| 19 November 2025 | KPI Green Energy Ltd | Signed a Memorandum of Understanding with Inox Solar Ltd to jointly develop 2.5 GW of solar and hybrid renewable projects. | This strategic collaboration enhances regional project execution capabilities and targets the growing demand for large-scale hybrid utility assets. |
| 22 October 2025 | Coal India Limited | Established a partnership with IIT Madras to create a "Centre for Sustainable Energy" focused on repurposing coal mines for solar installations. | This initiative promotes land-use efficiency by converting legacy industrial sites into clean energy generation hubs. |
| 29 April 2025 | Avaada Group | Signed an agreement with the Maharashtra government to develop two pumped storage projects totaling 3,600 MW to complement solar farms. | Integrating large-scale storage allows for the firming of solar power, transforming intermittent energy into a baseload-style supply. |
Solar Energy Market Scope: Inquire before buying
| Solar Energy Market | |||
|---|---|---|---|
| Report Coverage | Details | ||
| Base Year: | 2025 | Forecast Period: | 2026-2032 |
| Historical Data: | 2020 to 2025 | Market Size in 2025: | 182.67 USD Billion |
| Forecast Period 2026-2032 CAGR: | 23.1% | Market Size in 2032: | 782.47 USD Billion |
| Segments Covered: | by Technology | Solar Photovoltaic (PV) Concentrated Solar Power (CSP) (Subtypes: Parabolic Trough, Solar Tower, Fresnel, Dish Stirling) |
|
| by Solar Module | Monocrystalline Polycrystalline Cadmium Telluride Amorphous Silicon Others |
||
| by End-user | Residential Commercial Industrial |
||
| by Application | Power Generation Heating Off-grid Applications |
||
| by Product Type | Solar Panels Inverters Batteries Charge Controllers Others |
||
| by Service | Installation Operation & Maintenance (O&M) |
||
Solar Energy Market, by Region
North America (United States, Canada and Mexico)
Europe (UK, France, Germany, Italy, Spain, Sweden, Austria and Rest of Europe)
Asia Pacific (China, South Korea, Japan, India, Australia, Indonesia, Malaysia, Vietnam, Taiwan, Bangladesh, Pakistan and Rest of APAC)
Middle East and Africa (South Africa, GCC, Egypt, Nigeria and Rest of ME&A)
South America (Brazil, Argentina Rest of South America)
Key Players / Competitors Profiles Covered in Brief in Global Solar Energy Market Report in Strategic Perspective:
- First Solar, Inc.
- SunPower Corporation
- Canadian Solar Inc.
- JinkoSolar Holding Co., Ltd.
- Trina Solar Co., Ltd.
- LONGi Green Energy Technology Co., Ltd.
- Enphase Energy, Inc.
- SMA Solar Technology AG
- REC Group
- Hanwha Q CELLS Co., Ltd.
- Sunrun Inc.
- Vivint Solar, Inc.
- NextEra Energy
- JA SOLAR Technology Co., Ltd.
- Risen Energy Co., Ltd.
- Sungrow Power Supply Co., Ltd.
- SolarEdge Technologies Inc.
- Huawei Technologies Co., Ltd.
- Fimer Group
- Delta Electronics, Inc.
- Tesla Energy
- BYD Company Ltd.
- Tata Power Solar Systems
- Acciona S.A.
- Adani Green Energy Ltd