Waste to Energy Market: Global Industry Analysis and Forecast (2024-2030)

The Waste To Energy Market size was valued at USD 35.23 Billion in 2023 and the total Waste To Energy Market revenue is expected to grow at a CAGR of 8.68% from 2024 to 2030, reaching nearly USD 63.11 Billion.

Waste To Energy Market Overview:

Waste-to-Energy (WtE) is a transformative process that converts solid waste into viable energy sources, such as electricity or heat. This method presents an ecologically sound solution by reducing waste volume, curbing greenhouse gas emissions, and lessening dependence on fossil fuels. Specialized facilities incinerate waste, generating heat that propels turbines to produce electricity through steam. Advanced technologies ensure efficient energy recovery and rigorous emission control, contributing to a circular economy by safely managing residual ash. WtE plays a pivotal role in effective waste management, diminishing reliance on landfills and unlocking the energy potential inherent in waste materials. The waste to energy market is poised for growth, driven by the increasing adoption of government policies and regulations encouraging proper waste disposal and energy generation. The rising demand for energy across diverse industries is expected to significantly propel the waste to energy market. Given the escalating global population, waste generation has surged. According to the United Nations projections, the global population is expected to exceed 9 billion by 2050 and surpass 11 billion by 2100. Accordingly, the growth of waste is projected to rise exponentially in the foreseeable future. Major users of WTE in the US
State Number of Plants Capacity (short US tons/day)
New York 10 11,100
Connecticut 6 6500
New Jersey 5 6200
Florida 13 19,300
In 2002, the European waste-to-energy (WTE) sector generated more than 40 million tonnes of energy annually. The Brescia WTE facility in Italy stands out as an exemplary model of cogeneration, producing both thermal and electric energies. This facility supplies an amount of energy at least equivalent to the requirements for district heating, particularly crucial during the colder winter months. Meanwhile, the United States contributes approximately 23% of the global capacity of waste to energy market, with 66% of this capacity concentrated in seven states along the East Coast.Waste to Energy MarketTo know about the Research Methodology :- Request Free Sample Report

Waste to Energy Market Dynamics:

The development of reusable energy from waste is attracting a lot of attention across the world. The rising trend toward energy security around the globe is the most important factor driving the growth of the global waste to energy market over the forecast period. Furthermore, the depletion of conventional energy resources, rising municipal waste generation, rising energy demand, and decreasing landfill space availability all boosting to the growth of the waste to energy market across the globe. The governments from developed and developing countries are focusing on commercializing alternative energy sources such as waste to energy market technologies as the fast depletion of conventional energy sources is taking place across the globe. Furthermore, the introduction of environmental rules targeted at decreasing carbon emissions from the use of fossil fuels is predicted to enhance industry growth. According to the US Environmental Protection Agency, every tonne of solid waste processed in waste to energy facilities reduces greenhouse gas emissions by one tonne. For instance, Covanta Holding Corporation in the United States recycles 500 kilotons of metal and converts around 21.0 million tonnes of waste into useful energy through its waste to energy facilities. The Waste to energy plants reduces a considerable number of harmful emissions by several variables, such as the recovery of metals for recycling, the offset of carbon dioxide from fossil fuel power generation, and the avoidance of methane from landfills. In addition, limited landfill space and increasing landfilling costs are likely to boost waste to energy market technology's growth as a reliable waste management solution. New challenges have emerged in the waste to energy market as waste-to-energy technologies have become more widely adopted. The market's growth is expected to be hampered by established commercial technologies like solar power, hydropower, and wind power, as well as technological and economic barriers. The market's major players face obstacles such as lowering the high initial setup costs of waste-to-energy plants, as well as a shortage of infrastructure and skilled labor.

Waste to Energy Market Segment Analysis:

By Technology, the waste to energy market is segmented into Physical, Thermal, and Biological. The Thermal Technology segment held the largest waste to energy market share accounting for ~ 80% in 2023. The growth factor for thermal conversion techniques is a comparatively simple procedure combined with ease of operation. Thermal waste treatment is an environmentally friendly solution for modern cities since it allows for the complete burning of waste gases. The thermal technology has various advantages, including reduced greenhouse gas emissions, energy conservation, and waste volume reduction. Incineration reduces waste to 10% of its original volume, making it a viable alternative to conventional energy by generating renewable energy for uses such as district heating. These are factors are fuelling the waste to energy market growth for this segment. The Biological Technology segment is expected to witness rapid growth at a CAGR of 9.31% in waste to energy market during the forecast period. The segment growth is attributed to the growing advancement of decomposition technology. Governments across developed and developing countries are conducting research and development (R&D) to improve the economic viability of anaerobic digestion plants. The development of biological conversion of gases to fuels and co-products depends on several essential aspects, including advances in reactor design and genetic engineering of organisms. 
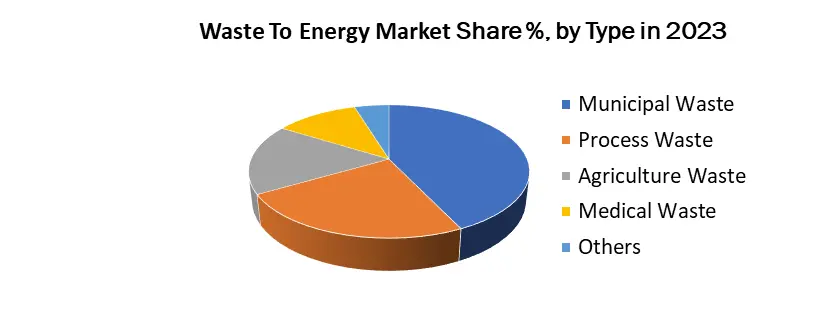
Based on the Waste type, the waste to energy market is segmented into Municipal Waste, Process Waste, Agriculture Waste, Medical Waste, and Others. The Municipal Waste segment held the largest waste to energy market share, accounting for 52% in 2023. Municipal Waste is made up of a variety of energy-dense items such as paper, plastics, yard waste, and wood-based products. Currently, the world generates 1.3 billion tonnes of Municipal Waste annually. For instance, in the United States, around 85 pounds of Municipal Waste is burned as fuel to generate power. Waste-to-energy plants convert 2,000 pounds of garbage into ash weighing between 300 and 600 pounds, reducing waste volume by roughly 87%.

Waste to Energy Market1Waste to Energy Market Regional Analysis:

Europe region held the largest waste to energy market share accounted for 43.8% in 2023, The region's growth is attributed to the presence of major market players such as Suez, Veolia, Ramboll Group A/S, and EQT AB. The encouraging regulatory policies such as landfill charges, carbon taxes, and direct subsidies to waste-to-energy plants are likely to boost the regional market waste to energy market growth during the forecast period. North America waste to energy market is expected to witness significant growth at a CAGR of 9.12% during the forecast period. This region's growth is attributed to the significant growth of the growing consumer awareness about environment protection and climate change. The deployment rate of waste to energy systems in the area is expected to increase as the government places a greater emphasis on integration and increased use of clean electricity generation sources. According to the Energy Information Administration, 68 waste-to-energy plants in the United States consumed 29.5 million tonnes of municipal waste in 2018, generating roughly 14.0 billion kWh of power. The Asia Pacific waste to energy market is expected to witness the highest growth at a CAGR of 8.71% during 2022. Increased government investment for municipal waste management, as well as increased awareness about waste to energy facilities in countries like India, Singapore, Indonesia, and Thailand, are expected to fuel regional waste to energy market growth.

Waste To Energy Market Competitive Landscape:

In April 2023, Egypt entered into a USD 120 million agreement to establish, own, and operate its inaugural solid waste-to-electricity facility. The contract, signed by the Giza governorate, involves a partnership between Renergy Egypt, and the National Authority for Military Production, aligning with Egypt Vision 2030. Located in Abou Rawash, Giza, the plant aims to convert 1,200 metric tons of household solid waste daily into power. In January 2023, the Lostock Sustainable Energy Plant awarded a USD 65 million contract to Babcock & Wilcox for the power train of a waste-to-energy plant near Manchester, United Kingdom. Projected to generate over 60 MW of energy for both individuals and businesses, the facility is expected to process approximately 600,000 metric tons of waste annually. The objective of the report is to present a comprehensive analysis of the Waste to Energy Market to the stakeholders in the industry. The past and current status of the industry with the forecasted market size and trends are presented in the report with the analysis of complicated data in simple language. The report covers all the aspects of the industry with a dedicated study of key players that include market leaders, followers, and new entrants. PORTER, PESTEL analysis with the potential impact of micro-economic factors of the market have been presented in the report. External as well as internal factors that are supposed to affect the business positively or negatively have been analyzed, which will give a clear futuristic view of the industry to the decision-makers. The reports also help in understanding the Waste to Energy Market dynamic, structure by analyzing the market segments and projecting the Waste to Energy Market size. Clear representation of competitive analysis of key players by Technology, price, financial position, product portfolio, growth strategies, and regional presence in the Waste to Energy Market make the MMR report investor’s guide.

Waste to Energy Market Scope: Inquire before buying

Global Waste to Energy Market
Report Coverage Details
Base Year: 2023 Forecast Period: 2024-2030
Historical Data: 2018 to 2023 Market Size in 2023: US $ 35.23 Bn.
Forecast Period 2024 to 2030 CAGR: 8.68% Market Size in 2030: US $ 63.11 Bn.
Segments Covered: By Technology Physical Thermal Biological
by Type Municipal Waste Process Waste Agriculture Waste Medical Waste Others
by Application Electricity Heat

Global Waste to Energy Market, by Region

North America (United States, Canada and Mexico) Europe (UK, France, Germany, Italy, Spain, Sweden, Austria and Rest of Europe) Asia Pacific (China, South Korea, Japan, India, Australia, Indonesia, Malaysia, Vietnam, Taiwan, Bangladesh, Pakistan and Rest of APAC) Middle East and Africa (South Africa, GCC, Egypt, Nigeria and Rest of ME&A) South America (Brazil, Argentina Rest of South America)

Waste To Energy Market Key Players:

North America Waste To Energy Market Top Players: 1. Waste Management Inc. - United States 2. Babcock & Wilcox Enterprises Inc. - United States 3. Enerkem – Canada 4. Covanta Holding Corporation - United States 5. Green Conversion Systems - United States 6. Wheelabrator Technologies Inc - United States 7. Xcel Energy Inc. - United States 8. Babcock & Wilcox Enterprises, Inc. - United States Europe Waste To Energy Market Top Players: 1. Suez Environment S.A. – France 2. Construction Industrielles de la Mediterranean (CNIM) - France 3. Veolia Environment SA - France 4. Martin GmbH - Germany 5. Hitachi Zosen Inova - Switzerland 6. Advanced Plasma Power - United Kingdom 7. Bioelektra Group – Poland 8. Ramboll Group A/S - Denmark 9. Keppel Seghers - Belgium 10. Viridor - United Kingdom 11. EEW Energy from Waste - Germany APAC Waste To Energy Market Top Players: 1. Mitsubishi Heavy Industries Ltd - Japan 2. C&G Environmental Protection Holdings - China 3. Hitachi Zosen Corp - Japan 4. China Everbright International Limited - China 5. China Jinjiang Environment Holding Company Limited - China 6. Abu Dhabi National Energy Company PJSC - United Arab Emirates

FAQs:

1. What are the growth drivers for the Waste To Energy market? Ans. Supportive government policies, regulations, and financial incentives play a crucial role in driving the waste to energy market. 2. What is the major restraint for the Waste To Energy market growth? Ans. Stringent environmental regulations and permitting is expected to be the major restraining factor for the Waste To Energy market growth. 3. Which region is expected to lead the global Waste To Energy market during the forecast period? Ans. North America is expected to lead the global Waste To Energy market during the forecast period. 4. What is the projected market size & and growth rate of the Waste To Energy Market? Ans. The Waste To Energy Market size was valued at USD 35.23 Billion in 2023 and the total Waste To Energy Market revenue is expected to grow at a CAGR of 8.68% from 2024 to 2030, reaching nearly USD 63.11 Billion. 5. What segments are covered in the Waste To Energy Market report? Ans. The segments covered in the Waste To Energy market report are Type, Technology, Application and Region.
1. Waste To Energy Market: Research Methodology 2. Waste To Energy Market Introduction 2.1. Study Assumption and Market Definition 2.2. Scope of the Study 2.3. Executive Summary 3. Waste To Energy Market: Dynamics 3.1. Waste To Energy Market Trends by Region 3.2. Waste To Energy Market Dynamics by Region 3.2.1. Waste To Energy Market Drivers 3.2.2. Waste To Energy Market Restraints 3.2.3. Waste To Energy Market Opportunities 3.2.4. Waste To Energy Market Challenges 3.3. PORTER’s Five Forces Analysis 3.4. PESTLE Analysis 3.5. Regulatory Landscape by Region 3.5.1. Global 3.5.2. North America 3.5.3. Europe 3.5.4. Asia Pacific 3.5.5. Middle East and Africa 3.5.6. South America 3.6. The Global Pandemic Impact on Waste To Energy Market 4. Waste To Energy Market: Global Market Size and Forecast by Segmentation by Demand and Supply Side (by Value in USD Million) (2023-2030) 4.1. Waste To Energy Market Size and Forecast, By Technology (2023-2030) 4.1.1. Physical 4.1.2. Thermal 4.1.3. Biological 4.2. Waste To Energy Market Size and Forecast, By Type (2023-2030) 4.2.1. Municipal Waste 4.2.2. Process Waste 4.2.3. Agriculture Waste 4.2.4. Medical Waste 4.2.5. Others 4.3. Waste To Energy Market Size and Forecast, by Application (2023-2030) 4.3.1. Electricity 4.3.2. Heat 4.4. Waste To Energy Market Size and Forecast, by Region (2023-2030) 4.4.1. North America 4.4.2. Europe 4.4.3. Asia Pacific 4.4.4. Middle East and Africa 4.4.5. South America 5. North America Waste To Energy Market Size and Forecast by Segmentation by Demand and Supply Side (by Value in USD Million) (2023-2030) 5.1. North America Waste To Energy Market Size and Forecast, By Technology (2023-2030) 5.1.1. Physical 5.1.2. Thermal 5.1.3. Biological 5.2. North America Waste To Energy Market Size and Forecast, By Type (2023-2030) 5.2.1. Municipal Waste 5.2.2. Process Waste 5.2.3. Agriculture Waste 5.2.4. Medical Waste 5.2.5. Others 5.3. North America Waste To Energy Market Size and Forecast, by Application (2023-2030) 5.3.1. Electricity 5.3.2. Heat 5.4. Waste To Energy Market Size and Forecast, by Country (2023-2030) 5.4.1. United States 5.4.1.1. United States Waste To Energy Market Size and Forecast, By Technology (2023-2030) 5.4.1.1.1. Physical 5.4.1.1.2. Thermal 5.4.1.1.3. Biological 5.4.1.2. United States Waste To Energy Market Size and Forecast, By Type (2023-2030) 5.4.1.2.1. Municipal Waste 5.4.1.2.2. Process Waste 5.4.1.2.3. Agriculture Waste 5.4.1.2.4. Medical Waste 5.4.1.2.5. Others 5.4.1.3. United States Waste To Energy Market Size and Forecast, by Application (2023-2030) 5.4.1.3.1. Electricity 5.4.1.3.2. Heat Canada 5.4.1.4. Canada Waste To Energy Market Size and Forecast, By Technology (2023-2030) 5.4.1.4.1. Physical 5.4.1.4.2. Thermal 5.4.1.4.3. Biological 5.4.1.5. Canada Waste To Energy Market Size and Forecast, By Type (2023-2030) 5.4.1.5.1. Municipal Waste 5.4.1.5.2. Process Waste 5.4.1.5.3. Agriculture Waste 5.4.1.5.4. Medical Waste 5.4.1.5.5. Others 5.4.1.6. Canada Waste To Energy Market Size and Forecast, by Application (2023-2030) 5.4.1.6.1. Electricity 5.4.1.6.2. Heat 5.4.2. Mexico 5.4.2.1. Mexico Waste To Energy Market Size and Forecast, By Technology (2023-2030) 5.4.2.1.1. Physical 5.4.2.1.2. Thermal 5.4.2.1.3. Biological 5.4.2.2. Mexico Waste To Energy Market Size and Forecast, By Type (2023-2030) 5.4.2.2.1. Municipal Waste 5.4.2.2.2. Process Waste 5.4.2.2.3. Agriculture Waste 5.4.2.2.4. Medical Waste 5.4.2.2.5. Others 5.4.2.3. Mexico Waste To Energy Market Size and Forecast, by Application (2023-2030) 5.4.2.3.1. Electricity 5.4.2.3.2. Heat 6. Europe Waste To Energy Market Size and Forecast by Segmentation by Demand and Supply Side (by Value in USD Million) (2023-2030) 6.1. Europe Waste To Energy Market Size and Forecast, By Technology (2023-2030) 6.2. Europe Waste To Energy Market Size and Forecast, By Type (2023-2030) 6.3. Europe Waste To Energy Market Size and Forecast, by Application (2023-2030) 6.4. Europe Waste To Energy Market Size and Forecast, by Country (2023-2030) 6.4.1. United Kingdom 6.4.1.1. United Kingdom Waste To Energy Market Size and Forecast, By Technology (2023-2030) 6.4.1.2. United Kingdom Waste To Energy Market Size and Forecast, By Type (2023-2030) 6.4.1.3. United Kingdom Waste To Energy Market Size and Forecast, by Application (2023-2030) 6.4.2. France 6.4.2.1. France Waste To Energy Market Size and Forecast, By Technology (2023-2030) 6.4.2.2. France Waste To Energy Market Size and Forecast, By Type (2023-2030) 6.4.2.3. France Waste To Energy Market Size and Forecast, by Application (2023-2030) 6.4.3. Germany 6.4.3.1. Germany Waste To Energy Market Size and Forecast, By Technology (2023-2030) 6.4.3.2. Germany Waste To Energy Market Size and Forecast, By Type (2023-2030) 6.4.3.3. Germany Waste To Energy Market Size and Forecast, by Application (2023-2030) 6.4.4. Italy 6.4.4.1. Italy Waste To Energy Market Size and Forecast, By Technology (2023-2030) 6.4.4.2. Italy Waste To Energy Market Size and Forecast, By Type (2023-2030) 6.4.4.3. Italy Waste To Energy Market Size and Forecast, by Application (2023-2030) 6.4.5. Spain 6.4.5.1. Spain Waste To Energy Market Size and Forecast, By Technology (2023-2030) 6.4.5.2. Spain Waste To Energy Market Size and Forecast, By Type (2023-2030) 6.4.5.3. Spain Waste To Energy Market Size and Forecast, by Application (2023-2030) 6.4.6. Sweden 6.4.6.1. Sweden Waste To Energy Market Size and Forecast, By Technology (2023-2030) 6.4.6.2. Sweden Waste To Energy Market Size and Forecast, By Type (2023-2030) 6.4.6.3. Sweden Waste To Energy Market Size and Forecast, by Application (2023-2030) 6.4.7. Austria 6.4.7.1. Austria Waste To Energy Market Size and Forecast, By Technology (2023-2030) 6.4.7.2. Austria Waste To Energy Market Size and Forecast, By Type (2023-2030) 6.4.7.3. Austria Waste To Energy Market Size and Forecast, by Application (2023-2030) 6.4.8. Rest of Europe 6.4.8.1. Rest of Europe Waste To Energy Market Size and Forecast, By Technology (2023-2030) 6.4.8.2. Rest of Europe Waste To Energy Market Size and Forecast, By Type (2023-2030) 6.4.8.3. Rest of Europe Waste To Energy Market Size and Forecast, by Application (2023-2030) 7. Asia Pacific Waste To Energy Market Size and Forecast by Segmentation by Demand and Supply Side (by Value in USD Million) (2023-2030) 7.1. Asia Pacific Waste To Energy Market Size and Forecast, By Technology (2023-2030) 7.2. Asia Pacific Waste To Energy Market Size and Forecast, By Type (2023-2030) 7.3. Asia Pacific Waste To Energy Market Size and Forecast, by Application(2023-2030) 7.4. Asia Pacific Waste To Energy Market Size and Forecast, by Country (2023-2030) 7.4.1. China 7.4.1.1. China Waste To Energy Market Size and Forecast, By Technology (2023-2030) 7.4.1.2. China Waste To Energy Market Size and Forecast, By Type (2023-2030) 7.4.1.3. China Waste To Energy Market Size and Forecast, by Application (2023-2030) 7.4.1.4. China Waste To Energy Market Size and Forecast, By Technology (2023-2030) 7.4.1.5. China Waste To Energy Market Size and Forecast, By Type (2023-2030) 7.4.1.6. China Waste To Energy Market Size and Forecast, by Application (2023-2030) 7.4.2. Japan 7.4.2.1. Japan Waste To Energy Market Size and Forecast, By Technology (2023-2030) 7.4.2.2. Japan Waste To Energy Market Size and Forecast, By Type (2023-2030) 7.4.2.3. Japan Waste To Energy Market Size and Forecast, by Application (2023-2030) 7.4.3. India 7.4.3.1. India Waste To Energy Market Size and Forecast, By Technology (2023-2030) 7.4.3.2. India Waste To Energy Market Size and Forecast, By Type (2023-2030) 7.4.3.3. India Waste To Energy Market Size and Forecast, by Application (2023-2030) 7.4.4. Australia 7.4.4.1. Australia Waste To Energy Market Size and Forecast, By Technology (2023-2030) 7.4.4.2. Australia Waste To Energy Market Size and Forecast, By Type (2023-2030) 7.4.4.3. Australia Waste To Energy Market Size and Forecast, by Application (2023-2030) 7.4.5. Indonesia 7.4.5.1. Indonesia Waste To Energy Market Size and Forecast, By Technology (2023-2030) 7.4.5.2. Indonesia Waste To Energy Market Size and Forecast, By Type (2023-2030) 7.4.5.3. Indonesia Waste To Energy Market Size and Forecast, by Application (2023-2030) 7.4.6. Malaysia 7.4.6.1. Malaysia Waste To Energy Market Size and Forecast, By Technology (2023-2030) 7.4.6.2. Malaysia Waste To Energy Market Size and Forecast, By Type (2023-2030) 7.4.6.3. Malaysia Waste To Energy Market Size and Forecast, by Application (2023-2030) 7.4.7. Vietnam 7.4.7.1. Vietnam Waste To Energy Market Size and Forecast, By Technology (2023-2030) 7.4.7.2. Vietnam Waste To Energy Market Size and Forecast, By Type (2023-2030) 7.4.7.3. Vietnam Waste To Energy Market Size and Forecast, by Application (2023-2030) 7.4.8. Taiwan 7.4.8.1. Taiwan Waste To Energy Market Size and Forecast, By Technology (2023-2030) 7.4.8.2. Taiwan Waste To Energy Market Size and Forecast, By Type (2023-2030) 7.4.8.3. Taiwan Waste To Energy Market Size and Forecast, by Application (2023-2030) 7.4.9. Rest of Asia Pacific 7.4.9.1. Rest of Asia Pacific Waste To Energy Market Size and Forecast, By Technology (2023-2030) 7.4.9.2. Rest of Asia Pacific Waste To Energy Market Size and Forecast, By Type (2023-2030) 7.4.9.3. Rest of Asia Pacific Waste To Energy Market Size and Forecast, by Application (2023-2030) 8. Middle East and Africa Waste To Energy Market Size and Forecast by Segmentation by Demand and Supply Side (by Value in USD Million) (2023-2030 8.1. Middle East and Africa Waste To Energy Market Size and Forecast, By Technology (2023-2030) 8.2. Middle East and Africa Waste To Energy Market Size and Forecast, By Type (2023-2030) 8.3. Middle East and Africa Waste To Energy Market Size and Forecast, by Application (2023-2030) 8.4. Middle East and Africa Waste To Energy Market Size and Forecast, by Country (2023-2030) 8.4.1. South Africa 8.4.1.1. South Africa Waste To Energy Market Size and Forecast, By Technology (2023-2030) 8.4.1.2. South Africa Waste To Energy Market Size and Forecast, By Type (2023-2030) 8.4.1.3. South Africa Waste To Energy Market Size and Forecast, by Application (2023-2030) 8.4.2. GCC 8.4.2.1. GCC Waste To Energy Market Size and Forecast, By Technology (2023-2030) 8.4.2.2. GCC Waste To Energy Market Size and Forecast, By Type (2023-2030) 8.4.2.3. GCC Waste To Energy Market Size and Forecast, by Application (2023-2030) 8.4.3. Nigeria 8.4.3.1. Nigeria Waste To Energy Market Size and Forecast, By Technology (2023-2030) 8.4.3.2. Nigeria Waste To Energy Market Size and Forecast, By Type (2023-2030) 8.4.3.3. Nigeria Waste To Energy Market Size and Forecast, by Application (2023-2030) 8.4.3.4. 8.4.4. Rest of ME&A 8.4.4.1. Rest of ME&A Waste To Energy Market Size and Forecast, By Technology (2023-2030) 8.4.4.2. Rest of ME&A Waste To Energy Market Size and Forecast, By Type (2023-2030) 8.4.4.3. Rest of ME&A Waste To Energy Market Size and Forecast, by Application (2023-2030) 9. South America Waste To Energy Market Size and Forecast by Segmentation by Demand and Supply Side (by Value in USD Million) (2023-2030 9.1. South America Waste To Energy Market Size and Forecast, By Technology (2023-2030) 9.2. South America Waste To Energy Market Size and Forecast, By Type (2023-2030) 9.3. South America Waste To Energy Market Size and Forecast, by Application (2023-2030) 9.4. South America Waste To Energy Market Size and Forecast, by Country (2023-2030) 9.4.1. Brazil 9.4.1.1. Brazil Waste To Energy Market Size and Forecast, By Technology (2023-2030) 9.4.1.2. Brazil Waste To Energy Market Size and Forecast, By Type (2023-2030) 9.4.1.3. Brazil Waste To Energy Market Size and Forecast, by Application (2023-2030) 9.4.2. Argentina 9.4.2.1. Argentina Waste To Energy Market Size and Forecast, By Technology (2023-2030) 9.4.2.2. Argentina Waste To Energy Market Size and Forecast, By Type (2023-2030) 9.4.2.3. Argentina Waste To Energy Market Size and Forecast, by Application (2023-2030) 9.4.3. Argentina 9.4.4. Rest Of South America 9.4.4.1. Rest Of South America Waste To Energy Market Size and Forecast, By Technology (2023-2030) 9.4.4.2. Rest Of South America Waste To Energy Market Size and Forecast, By Type (2023-2030) 9.4.4.3. Rest Of South America Waste To Energy Market Size and Forecast, by Application (2023-2030) 10. Global Waste To Energy Market: Competitive Landscape 10.1. MMR Competition Matrix 10.2. Competitive Landscape 10.3. Key Players Benchmarking 10.3.1. Company Name 10.3.2. End-User 10.3.3. Revenue (2023) 10.3.4. Company Locations 10.4. Leading Waste To Energy Market Companies, by market capitalization 10.5. Market Structure 10.5.1. Market Leaders 10.5.2. Market Followers 10.5.3. Emerging Players 10.6. Mergers and Acquisitions Details 11. Company Profile: Key Players 11.1. Suez Environment S.A. - France 11.1.1. Company Overview 11.1.2. Business Portfolio 11.1.3. Financial Overview 11.1.4. SWOT Analysis 11.1.5. Strategic Analysis 11.1.6. Scale of Operation (small, medium, and large) 11.1.7. Details on Partnership 11.1.8. Regulatory Accreditations and Certifications Received by Them 11.1.9. Awards Received by the Firm 11.1.10. Recent Developments 11.2. Mitsubishi Heavy Industries Ltd - Japan 11.3. C&G Environmental Protection Holdings - China 11.4. Construction Industrielles de la Mediterranee (CNIM) - France 11.5. Waste Management Inc. - United States 11.6. Babcock & Wilcox Enterprises Inc. - United States 11.7. Veolia Environnement SA - France 11.8. Hitachi Zosen Corp - Japan 11.9. China Everbright International Limited - China 11.10. China Jinjiang Environment Holding Company Limited - China 11.11. Covanta Holding Corporation - United States 11.12. Abu Dhabi National Energy Company PJSC - United Arab Emirates 11.13. Ramboll Group A/S - Denmark 11.14. Babcock & Wilcox Enterprises, Inc. - United States 11.15. Wheelabrator Technologies Inc - United States 11.16. Xcel Energy Inc. - United States 11.17. Keppel Seghers - Belgium 11.18. Viridor - United Kingdom 11.19. EEW Energy from Waste - Germany 11.20. Green Conversion Systems - United States 11.21. Martin GmbH - Germany 11.22. Hitachi Zosen Inova - Switzerland 11.23. Advanced Plasma Power - United Kingdom 11.24. Bioelektra Group - Poland 11.25. Enerkem - Canada 12. Waste To Energy Market Key Findings 13. Industry Recommendations 14. Terms and Glossary
  • INQUIRE BEFORE BUYING