Quick Service Restaurants (QSR) IT Market – Global Industry Analysis and Forecast (2022-2029)

Quick Service Restaurants (QSR) IT Market size is expected to grow at 4.9% throughout the forecast period, reaching nearly US$ 402.88 Bn by 2029.

Global Quick Service Restaurants (QSR) IT Market Overview:

Worldwide the culture of dining out is getting popular exponentially. This leading to the tremendous rise in number of restaurants and each one is finding new ways to be competitive in the market. Every established and newly launched restaurant is searching for new ways to make its business effective and efficient. A number of new ways are being explored to recognize latest medium of revenue generation and improve resource utilization. These identified ways mainly focus on inventory management, customer relationship management, supply chain management and others. In order to meet these optimizations, technology plays an important role. Therefore, numerous quick service restaurants (QSR) are focusing their support on technology to find best of the solutions. Currently, QSR IT market is experiencing high adoption of technological innovation such as several digital devices, wireless handheld devices, digital menu cards, point of sales (POS), signage systems, and kiosks. Since recent years, QSR IT is witnessing a major transformation due to wide spread use of mobile devices, along with continuously changing consumer behavior and transition of hardware systems to cloud networking. Digital solutions are creating thrust in a QSR ecosystem as they offer improved productivity, efficient ways of revenue generation, effective customer service, more table turnaround and value-added accuracy.Quick Service Restaurants (QSR) IT Market
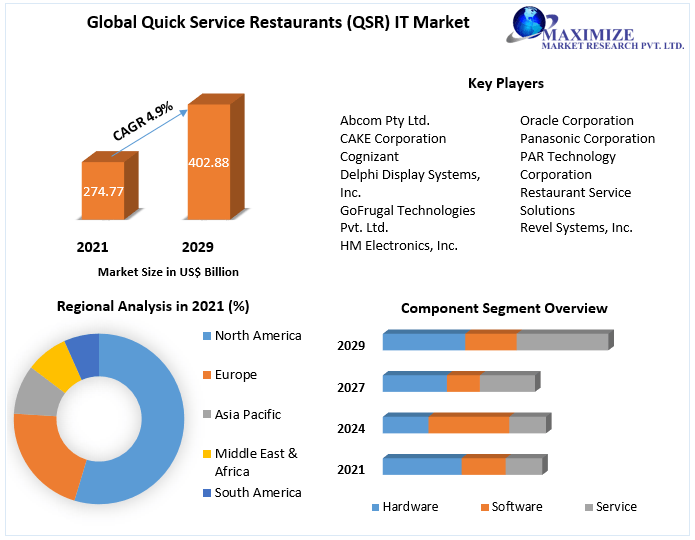
To know about the Research Methodology :- Request Free Sample Report

Global Quick Service Restaurants (QSR) IT Market Dynamics:

Today, every restaurant player is striving to implement latest technology. These innovative technology like, smartphone or tablets are standard consumer service provider that allow customers to post social network reviews, check price & menu comparisons, ambiance, online booking and several other information. Increasing usage of such devices is expected to bring rapid transformation in restaurant business. The most attractive facility it provides to customers is the provision to pay for food items through their smartphone in a most convenient way, which is expected to offer the new ways for the growth of QSR IT market. Moreover, increasing trend of hourly wages in QSR industry is generating the demand for QSR automation which in turn is supplementing the QSR IT industry. With rising demand for automation and advanced technology in quick service restaurants, the market is likely to experience high growth in forecasted period. The QSR automation on the account of integration of hardware, software and cloud network offers high profitability by eliminating excess manpower, their access working duration and improving service quality. Conversely, security concerns relating to data breaches and challenges affecting to network connectivity are hampering the growth of QSR IT market.

Global Quick Service Restaurants (QSR) IT Market Segmentation Analysis:

The global quick service restaurant IT market can be segmented on the basis of component and region. In terms of component, QSR IT market can be classified into hardware, software and service. In 2021, demand for software segment was growing, owing to noticeable rising trend for automation which is mostly provided through QSR software. Therefore, software segment is expected to grow at a faster CAGR of xx% during the forecast period. The software segment is further classified into inventory management, labor management, HR software, data analytics, marketing, restaurant operation, franchise management and some others. Among all data analytics marketing and labor management segments are expected to grow at healthy CAGR xx% and xx% respectively. The growth is attributed to the rising need of advancement for these activities. The hardware segment can be further classified into digital signage, kiosks, drive thru terminals, and point of sales, handheld devices and digital menu cards. Among all point of sales segment is experiencing huge popularity which is expected to lead the growth at highest CAGR xx% during forecasted period. Geographically, North America is expected to hold largest share of US$ xx Mn by 2029, growing with CAGR xx% during forecast period in global QSR IT market. This growth is attributed to the rising demand of innovative solutions and quick adoption of latest technology in this region. Asia-Pacific is expected to witness highest CAGR of xx% during the forecast period due to rising demand for advanced technology in the emerging economies such as China and India in the quick service restaurants. Similarly, other regions like, Europe, Latin America, and Middle East & Africa as well as all the segments and their sub segments with their current market share, expected growth percentage, factors boosting & hampering the growth and region wise anticipated market share during the each year in forecast period along with their graphical representation are illustrated in the report.

Global Quick Service Restaurants (QSR) IT Market Objective:

The objective of the report is to present a comprehensive analysis of the Global Quick Service Restaurants (QSR) IT Market including all the stakeholders of the industry. The past and current status of the industry with forecasted market size and trends are presented in the report with the analysis of complicated data in simple language. The report covers all the aspects of the industry with a dedicated study of key players that includes market leaders, followers and new entrants. PORTER, SVOR, PESTEL analysis with the potential impact of micro-economic factors of the market have been presented in the report. External as well as internal factors that are supposed to affect the business positively or negatively have been analyzed, which will give a clear futuristic view of the industry to the decision-makers. The report also helps in understanding Global Quick Service Restaurants (QSR) IT Market dynamics, structure by analyzing the market segments and projects the Global Quick Service Restaurants (QSR) IT Market size. Clear representation of competitive analysis of key players by Application, price, financial position, Product portfolio, growth strategies, and regional presence in the Global Quick Service Restaurants (QSR) IT Market make the report investor’s guide.

Global Quick Service Restaurants (QSR) IT Market Scope: Inquire before buying

Global Quick Service Restaurants (QSR) IT Market
Report Coverage Details
Base Year: 2021 Forecast Period: 2022-2029
Historical Data: 2017 to 2021 Market Size in 2021: US $ 274.77 Bn.
Forecast Period 2022 to 2029 CAGR: 4.9% Market Size in 2029: US $ 402.88 Bn.
Segments Covered: by Component • Hardware o Digital Signage o Kiosks o Drive through terminals o Point of Sales o Handheld devices o Digital menu cards • Software o Front of House o Inventory Management o Reconciliation o Labor Management o HR Software o Data Analytics o Marketing o Restaurant Operation o Support Operation o Franchise Management • Service

Global Quick Service Restaurants (QSR) IT Market, by Region

• North America • Europe • Asia Pacific • Middle East & Africa • South America

Global Quick Service Restaurants IT Market, Key players

• Abcom Pty Ltd. • CAKE Corporation • Cognizant • Delphi Display Systems, Inc. • GoFrugal Technologies Pvt. Ltd. • HM Electronics, Inc. • Imagine Print Solutions • LG Display Co. Ltd. • Microsoft Corporation • NCR Corporation • NEC Display Solutions of America, Inc. • Oracle Corporation • Panasonic Corporation • PAR Technology Corporation • Restaurant Service Solutions • Revel Systems, Inc. • Verifone Systems, Inc. Frequently Asked Questions: 1. Which region has the largest share in Global Quick Service Restaurants (QSR) IT Market? Ans: North America region holds the highest share in 2021. 2. What is the growth rate of Global Quick Service Restaurants (QSR) IT Market? Ans: The Global Quick Service Restaurants (QSR) IT Market is growing at a CAGR of 4.9% during forecasting period 2022-2029. 3. What is scope of the Global Quick Service Restaurants (QSR) IT market report? Ans: Global Quick Service Restaurants (QSR) IT Market report helps with the PESTEL, PORTER, COVID-19 Impact analysis, Recommendations for Investors & Leaders, and market estimation of the forecast period. 4. Who are the key players in Global Quick Service Restaurants (QSR) IT market? Ans: The important key players in the Global Quick Service Restaurants (QSR) IT Market are – Abcom Pty Ltd., CAKE Corporation, Cognizant, Delphi Display Systems, Inc., GoFrugal Technologies Pvt. Ltd., HM Electronics, Inc., Imagine Print Solutions, LG Display Co. Ltd., Microsoft Corporation, NCR Corporation, NEC Display Solutions of America, Inc., Oracle Corporation, Panasonic Corporation, PAR Technology Corporation, Restaurant Service Solutions, Revel Systems, Inc., Verifone Systems, and Inc. 5. What is the study period of this market? Ans: The Global Quick Service Restaurants (QSR) IT Market is studied from 2021 to 2029.
Global Quick Service Restaurants (QSR) IT Market 1. Preface 1.1. Report Scope and Market Segmentation 1.2. Research Highlights 1.3. Research Objectives 2. Assumptions and Research Methodology 2.1. Report Assumptions 2.2. Abbreviations 2.3. Research Methodology 2.3.1. Secondary Research 2.3.1.1. Secondary data 2.3.1.2. Secondary Sources 2.3.2. Primary Research 2.3.2.1. Data from Primary Sources 2.3.2.2. Breakdown of Primary Sources 3. Executive Summary: Global Quick Service Restaurants (QSR) IT Market Size, by Market Value (US$ Mn) 4. Market Overview 4.1. Introduction 4.2. Market Indicator 4.2.1. Drivers 4.2.2. Restraints 4.2.3. Opportunities 4.2.4. Challenges 4.3. Porter’s Analysis 4.4. Value Chain Analysis 4.5. Market Risk Analysis 4.6. SWOT Analysis 4.7. Industry Trends and Emerging Technologies 5. Supply Side and Demand Side Indicators 6. Global Quick Service Restaurants (QSR) IT Market Analysis and Forecast 6.1. Global Quick Service Restaurants (QSR) IT Market Size & Y-o-Y Growth Analysis 6.1.1. North America 6.1.2. Europe 6.1.3. Asia Pacific 6.1.4. Middle East & Africa 6.1.5. South America 7. Global Quick Service Restaurants (QSR) IT Market Analysis and Forecast, by Component 7.1. Introduction and Definition 7.2. Key Findings 7.3. Global Quick Service Restaurants (QSR) IT Market Value Share Analysis, by Component 7.4. Global Quick Service Restaurants (QSR) IT Market Size (US$ Mn) Forecast, by Component 7.5. Global Quick Service Restaurants (QSR) IT Market Analysis, by Component 7.6. Global Quick Service Restaurants (QSR) IT Market Attractiveness Analysis, by Component 8. Global Quick Service Restaurants (QSR) IT Market Analysis, by Region 8.1. Global Quick Service Restaurants (QSR) IT Market Value Share Analysis, by Region 8.2. Global Quick Service Restaurants (QSR) IT Market Size (US$ Mn) Forecast, by Region 8.3. Global Quick Service Restaurants (QSR) IT Market Attractiveness Analysis, by Region 9. North America Quick Service Restaurants (QSR) IT Market Analysis 9.1. Key Findings 9.2. North America Quick Service Restaurants (QSR) IT Market Overview 9.3. North America Quick Service Restaurants (QSR) IT Market Value Share Analysis, by Component 9.4. North America Quick Service Restaurants (QSR) IT Market Forecast, by Component 9.4.1. Hardware 9.4.1.1. Digital Signage 9.4.1.2. Kiosks 9.4.1.3. Drive through terminals 9.4.1.4. Point of Sales 9.4.1.5. Handheld devices 9.4.1.6. Digital menu cards 9.4.2. Software 9.4.2.1. Front of House 9.4.2.2. Inventory Management 9.4.2.3. Reconciliation 9.4.2.4. Labor Management 9.4.2.5. HR Software 9.4.2.6. Data Analytics 9.4.2.7. Marketing 9.4.2.8. Restaurant Operation 9.4.2.9. Support Operation 9.4.2.10. Franchise Management 9.4.3. Service 9.5. North America Quick Service Restaurants (QSR) IT Market Value Share Analysis, by Country 9.6. North America Quick Service Restaurants (QSR) IT Market Forecast, by Country 9.6.1. U.S. 9.6.2. Canada 9.7. North America Quick Service Restaurants (QSR) IT Market Analysis, by Country 9.8. U.S. Quick Service Restaurants (QSR) IT Market Forecast, by Component 9.8.1. Hardware 9.8.1.1. Digital Signage 9.8.1.2. Kiosks 9.8.1.3. Drive through terminals 9.8.1.4. Point of Sales 9.8.1.5. Handheld devices 9.8.1.6. Digital menu cards 9.8.2. Software 9.8.2.1. Front of House 9.8.2.2. Inventory Management 9.8.2.3. Reconciliation 9.8.2.4. Labor Management 9.8.2.5. HR Software 9.8.2.6. Data Analytics 9.8.2.7. Marketing 9.8.2.8. Restaurant Operation 9.8.2.9. Support Operation 9.8.2.10. Franchise Management 9.8.3. Service 9.9. Canada Quick Service Restaurants (QSR) IT Market Forecast, by Component 9.9.1. Hardware 9.9.1.1. Digital Signage 9.9.1.2. Kiosks 9.9.1.3. Drive through terminals 9.9.1.4. Point of Sales 9.9.1.5. Handheld devices 9.9.1.6. Digital menu cards 9.9.2. Software 9.9.2.1. Front of House 9.9.2.2. Inventory Management 9.9.2.3. Reconciliation 9.9.2.4. Labor Management 9.9.2.5. HR Software 9.9.2.6. Data Analytics 9.9.2.7. Marketing 9.9.2.8. Restaurant Operation 9.9.2.9. Support Operation 9.9.2.10. Franchise Management 9.9.3. Service 9.10. North America Quick Service Restaurants (QSR) IT Market Attractiveness Analysis 9.10.1. By Component 9.11. PEST Analysis 9.12. Key Trends 9.13. Key Developments 10. Europe Quick Service Restaurants (QSR) IT Market Analysis 10.1. Key Findings 10.2. Europe Quick Service Restaurants (QSR) IT Market Overview 10.3. Europe Quick Service Restaurants (QSR) IT Market Value Share Analysis, by Component 10.4. Europe Quick Service Restaurants (QSR) IT Market Forecast, by Component 10.4.1. Hardware 10.4.1.1. Digital Signage 10.4.1.2. Kiosks 10.4.1.3. Drive through terminals 10.4.1.4. Point of Sales 10.4.1.5. Handheld devices 10.4.1.6. Digital menu cards 10.4.2. Software 10.4.2.1. Front of House 10.4.2.2. Inventory Management 10.4.2.3. Reconciliation 10.4.2.4. Labor Management 10.4.2.5. HR Software 10.4.2.6. Data Analytics 10.4.2.7. Marketing 10.4.2.8. Restaurant Operation 10.4.2.9. Support Operation 10.4.2.10. Franchise Management 10.4.3. Service 10.5. Europe Quick Service Restaurants (QSR) IT Market Value Share Analysis, by Country 10.6. Europe Quick Service Restaurants (QSR) IT Market Forecast, by Country 10.6.1. Germany 10.6.2. U.K. 10.6.3. France 10.6.4. Italy 10.6.5. Spain 10.6.6. Rest of Europe 10.7. Europe Quick Service Restaurants (QSR) IT Market Analysis, by Country 10.8. Germany Quick Service Restaurants (QSR) IT Market Forecast, by Component 10.8.1. Hardware 10.8.1.1. Digital Signage 10.8.1.2. Kiosks 10.8.1.3. Drive through terminals 10.8.1.4. Point of Sales 10.8.1.5. Handheld devices 10.8.1.6. Digital menu cards 10.8.2. Software 10.8.2.1. Front of House 10.8.2.2. Inventory Management 10.8.2.3. Reconciliation 10.8.2.4. Labor Management 10.8.2.5. HR Software 10.8.2.6. Data Analytics 10.8.2.7. Marketing 10.8.2.8. Restaurant Operation 10.8.2.9. Support Operation 10.8.2.10. Franchise Management 10.8.3. Service 10.9. U.K. Quick Service Restaurants (QSR) IT Market Forecast, by Component 10.9.1. Hardware 10.9.1.1. Digital Signage 10.9.1.2. Kiosks 10.9.1.3. Drive through terminals 10.9.1.4. Point of Sales 10.9.1.5. Handheld devices 10.9.1.6. Digital menu cards 10.9.2. Software 10.9.2.1. Front of House 10.9.2.2. Inventory Management 10.9.2.3. Reconciliation 10.9.2.4. Labor Management 10.9.2.5. HR Software 10.9.2.6. Data Analytics 10.9.2.7. Marketing 10.9.2.8. Restaurant Operation 10.9.2.9. Support Operation 10.9.2.10. Franchise Management 10.9.3. Service 10.10. France Quick Service Restaurants (QSR) IT Market Forecast, by Component 10.10.1. Hardware 10.10.1.1. Digital Signage 10.10.1.2. Kiosks 10.10.1.3. Drive through terminals 10.10.1.4. Point of Sales 10.10.1.5. Handheld devices 10.10.1.6. Digital menu cards 10.10.2. Software 10.10.2.1. Front of House 10.10.2.2. Inventory Management 10.10.2.3. Reconciliation 10.10.2.4. Labor Management 10.10.2.5. HR Software 10.10.2.6. Data Analytics 10.10.2.7. Marketing 10.10.2.8. Restaurant Operation 10.10.2.9. Support Operation 10.10.2.10. Franchise Management 10.10.3. Service 10.11. Italy Quick Service Restaurants (QSR) IT Market Forecast, by Component 10.11.1. Hardware 10.11.1.1. Digital Signage 10.11.1.2. Kiosks 10.11.1.3. Drive through terminals 10.11.1.4. Point of Sales 10.11.1.5. Handheld devices 10.11.1.6. Digital menu cards 10.11.2. Software 10.11.2.1. Front of House 10.11.2.2. Inventory Management 10.11.2.3. Reconciliation 10.11.2.4. Labor Management 10.11.2.5. HR Software 10.11.2.6. Data Analytics 10.11.2.7. Marketing 10.11.2.8. Restaurant Operation 10.11.2.9. Support Operation 10.11.2.10. Franchise Management 10.11.3. Service 10.12. Spain Quick Service Restaurants (QSR) IT Market Forecast, by Component 10.12.1. Hardware 10.12.1.1. Digital Signage 10.12.1.2. Kiosks 10.12.1.3. Drive through terminals 10.12.1.4. Point of Sales 10.12.1.5. Handheld devices 10.12.1.6. Digital menu cards 10.12.2. Software 10.12.2.1. Front of House 10.12.2.2. Inventory Management 10.12.2.3. Reconciliation 10.12.2.4. Labor Management 10.12.2.5. HR Software 10.12.2.6. Data Analytics 10.12.2.7. Marketing 10.12.2.8. Restaurant Operation 10.12.2.9. Support Operation 10.12.2.10. Franchise Management 10.12.3. Service 10.13. Rest of Europe Quick Service Restaurants (QSR) IT Market Forecast, by Component 10.13.1. Hardware 10.13.1.1. Digital Signage 10.13.1.2. Kiosks 10.13.1.3. Drive through terminals 10.13.1.4. Point of Sales 10.13.1.5. Handheld devices 10.13.1.6. Digital menu cards 10.13.2. Software 10.13.2.1. Front of House 10.13.2.2. Inventory Management 10.13.2.3. Reconciliation 10.13.2.4. Labor Management 10.13.2.5. HR Software 10.13.2.6. Data Analytics 10.13.2.7. Marketing 10.13.2.8. Restaurant Operation 10.13.2.9. Support Operation 10.13.2.10. Franchise Management 10.13.3. Service 10.14. Europe Quick Service Restaurants (QSR) IT Market Attractiveness Analysis 10.14.1. By Component 10.15. PEST Analysis 10.16. Key Trends 10.17. Key Developments 11. Asia Pacific Quick Service Restaurants (QSR) IT Market Analysis 11.1. Key Findings 11.2. Asia Pacific Quick Service Restaurants (QSR) IT Market Overview 11.3. Asia Pacific Quick Service Restaurants (QSR) IT Market Value Share Analysis, by Component 11.4. Asia Pacific Quick Service Restaurants (QSR) IT Market Forecast, by Component 11.4.1. Hardware 11.4.1.1. Digital Signage 11.4.1.2. Kiosks 11.4.1.3. Drive through terminals 11.4.1.4. Point of Sales 11.4.1.5. Handheld devices 11.4.1.6. Digital menu cards 11.4.2. Software 11.4.2.1. Front of House 11.4.2.2. Inventory Management 11.4.2.3. Reconciliation 11.4.2.4. Labor Management 11.4.2.5. HR Software 11.4.2.6. Data Analytics 11.4.2.7. Marketing 11.4.2.8. Restaurant Operation 11.4.2.9. Support Operation 11.4.2.10. Franchise Management 11.4.3. Service 11.5. Asia Pacific Quick Service Restaurants (QSR) IT Market Value Share Analysis, by Country 11.6. Asia Pacific Quick Service Restaurants (QSR) IT Market Forecast, by Country 11.6.1. China 11.6.2. India 11.6.3. Japan 11.6.4. ASEAN 11.6.5. Rest of Asia Pacific 11.7. Asia Pacific Quick Service Restaurants (QSR) IT Market Analysis, by Country 11.8. China Quick Service Restaurants (QSR) IT Market Forecast, by Component 11.8.1. Hardware 11.8.1.1. Digital Signage 11.8.1.2. Kiosks 11.8.1.3. Drive through terminals 11.8.1.4. Point of Sales 11.8.1.5. Handheld devices 11.8.1.6. Digital menu cards 11.8.2. Software 11.8.2.1. Front of House 11.8.2.2. Inventory Management 11.8.2.3. Reconciliation 11.8.2.4. Labor Management 11.8.2.5. HR Software 11.8.2.6. Data Analytics 11.8.2.7. Marketing 11.8.2.8. Restaurant Operation 11.8.2.9. Support Operation 11.8.2.10. Franchise Management 11.8.3. Service 11.9. India Quick Service Restaurants (QSR) IT Market Forecast, by Component 11.9.1. Hardware 11.9.1.1. Digital Signage 11.9.1.2. Kiosks 11.9.1.3. Drive through terminals 11.9.1.4. Point of Sales 11.9.1.5. Handheld devices 11.9.1.6. Digital menu cards 11.9.2. Software 11.9.2.1. Front of House 11.9.2.2. Inventory Management 11.9.2.3. Reconciliation 11.9.2.4. Labor Management 11.9.2.5. HR Software 11.9.2.6. Data Analytics 11.9.2.7. Marketing 11.9.2.8. Restaurant Operation 11.9.2.9. Support Operation 11.9.2.10. Franchise Management 11.9.3. Service 11.10. Japan Quick Service Restaurants (QSR) IT Market Forecast, by Component 11.10.1. Hardware 11.10.1.1. Digital Signage 11.10.1.2. Kiosks 11.10.1.3. Drive through terminals 11.10.1.4. Point of Sales 11.10.1.5. Handheld devices 11.10.1.6. Digital menu cards 11.10.2. Software 11.10.2.1. Front of House 11.10.2.2. Inventory Management 11.10.2.3. Reconciliation 11.10.2.4. Labor Management 11.10.2.5. HR Software 11.10.2.6. Data Analytics 11.10.2.7. Marketing 11.10.2.8. Restaurant Operation 11.10.2.9. Support Operation 11.10.2.10. Franchise Management 11.10.3. Service 11.11. ASEAN Quick Service Restaurants (QSR) IT Market Forecast, by Component 11.11.1. Hardware 11.11.1.1. Digital Signage 11.11.1.2. Kiosks 11.11.1.3. Drive through terminals 11.11.1.4. Point of Sales 11.11.1.5. Handheld devices 11.11.1.6. Digital menu cards 11.11.2. Software 11.11.2.1. Front of House 11.11.2.2. Inventory Management 11.11.2.3. Reconciliation 11.11.2.4. Labor Management 11.11.2.5. HR Software 11.11.2.6. Data Analytics 11.11.2.7. Marketing 11.11.2.8. Restaurant Operation 11.11.2.9. Support Operation 11.11.2.10. Franchise Management 11.11.3. Service 11.12. Rest of Asia Pacific Quick Service Restaurants (QSR) IT Market Forecast, by Component 11.12.1. Hardware 11.12.1.1. Digital Signage 11.12.1.2. Kiosks 11.12.1.3. Drive through terminals 11.12.1.4. Point of Sales 11.12.1.5. Handheld devices 11.12.1.6. Digital menu cards 11.12.2. Software 11.12.2.1. Front of House 11.12.2.2. Inventory Management 11.12.2.3. Reconciliation 11.12.2.4. Labor Management 11.12.2.5. HR Software 11.12.2.6. Data Analytics 11.12.2.7. Marketing 11.12.2.8. Restaurant Operation 11.12.2.9. Support Operation 11.12.2.10. Franchise Management 11.12.3. Service 11.13. Asia Pacific Quick Service Restaurants (QSR) IT Market Attractiveness Analysis 11.13.1. By Component 11.14. PEST Analysis 11.15. Key Trends 11.16. Key Developments 12. Middle East & Africa Quick Service Restaurants (QSR) IT Market Analysis 12.1. Key Findings 12.2. Middle East & Africa Quick Service Restaurants (QSR) IT Market Overview 12.3. Middle East & Africa Quick Service Restaurants (QSR) IT Market Value Share Analysis, by Component 12.4. Middle East & Africa Quick Service Restaurants (QSR) IT Market Forecast, by Component 12.4.1. Hardware 12.4.1.1. Digital Signage 12.4.1.2. Kiosks 12.4.1.3. Drive through terminals 12.4.1.4. Point of Sales 12.4.1.5. Handheld devices 12.4.1.6. Digital menu cards 12.4.2. Software 12.4.2.1. Front of House 12.4.2.2. Inventory Management 12.4.2.3. Reconciliation 12.4.2.4. Labor Management 12.4.2.5. HR Software 12.4.2.6. Data Analytics 12.4.2.7. Marketing 12.4.2.8. Restaurant Operation 12.4.2.9. Support Operation 12.4.2.10. Franchise Management 12.4.3. Service 12.5. Middle East & Africa Quick Service Restaurants (QSR) IT Market Value Share Analysis, by Country 12.6. Middle East & Africa Quick Service Restaurants (QSR) IT Market Forecast, by Country 12.6.1. GCC 12.6.2. South Africa 12.6.3. Rest of Middle East & Africa 12.7. Middle East & Africa Quick Service Restaurants (QSR) IT Market Analysis, by Country 12.8. GCC Quick Service Restaurants (QSR) IT Market Forecast, by Component 12.8.1. Hardware 12.8.1.1. Digital Signage 12.8.1.2. Kiosks 12.8.1.3. Drive through terminals 12.8.1.4. Point of Sales 12.8.1.5. Handheld devices 12.8.1.6. Digital menu cards 12.8.2. Software 12.8.2.1. Front of House 12.8.2.2. Inventory Management 12.8.2.3. Reconciliation 12.8.2.4. Labor Management 12.8.2.5. HR Software 12.8.2.6. Data Analytics 12.8.2.7. Marketing 12.8.2.8. Restaurant Operation 12.8.2.9. Support Operation 12.8.2.10. Franchise Management 12.8.3. Service 12.9. South Africa Quick Service Restaurants (QSR) IT Market Forecast, by Component 12.9.1. Hardware 12.9.1.1. Digital Signage 12.9.1.2. Kiosks 12.9.1.3. Drive through terminals 12.9.1.4. Point of Sales 12.9.1.5. Handheld devices 12.9.1.6. Digital menu cards 12.9.2. Software 12.9.2.1. Front of House 12.9.2.2. Inventory Management 12.9.2.3. Reconciliation 12.9.2.4. Labor Management 12.9.2.5. HR Software 12.9.2.6. Data Analytics 12.9.2.7. Marketing 12.9.2.8. Restaurant Operation 12.9.2.9. Support Operation 12.9.2.10. Franchise Management 12.9.3. Service 12.10. Rest of Middle East & Africa Quick Service Restaurants (QSR) IT Market Forecast, by Component 12.10.1. Hardware 12.10.1.1. Digital Signage 12.10.1.2. Kiosks 12.10.1.3. Drive through terminals 12.10.1.4. Point of Sales 12.10.1.5. Handheld devices 12.10.1.6. Digital menu cards 12.10.2. Software 12.10.2.1. Front of House 12.10.2.2. Inventory Management 12.10.2.3. Reconciliation 12.10.2.4. Labor Management 12.10.2.5. HR Software 12.10.2.6. Data Analytics 12.10.2.7. Marketing 12.10.2.8. Restaurant Operation 12.10.2.9. Support Operation 12.10.2.10. Franchise Management 12.10.3. Service 12.11. Middle East & Africa Quick Service Restaurants (QSR) IT Market Attractiveness Analysis 12.11.1. By Component 12.12. PEST Analysis 12.13. Key Trends 12.14. Key Developments 13. South America Quick Service Restaurants (QSR) IT Market Analysis 13.1. Key Findings 13.2. South America Quick Service Restaurants (QSR) IT Market Overview 13.3. South America Quick Service Restaurants (QSR) IT Market Value Share Analysis, by Component 13.4. South America Quick Service Restaurants (QSR) IT Market Forecast, by Component 13.4.1. Hardware 13.4.1.1. Digital Signage 13.4.1.2. Kiosks 13.4.1.3. Drive through terminals 13.4.1.4. Point of Sales 13.4.1.5. Handheld devices 13.4.1.6. Digital menu cards 13.4.2. Software 13.4.2.1. Front of House 13.4.2.2. Inventory Management 13.4.2.3. Reconciliation 13.4.2.4. Labor Management 13.4.2.5. HR Software 13.4.2.6. Data Analytics 13.4.2.7. Marketing 13.4.2.8. Restaurant Operation 13.4.2.9. Support Operation 13.4.2.10. Franchise Management 13.4.3. Service 13.5. South America Quick Service Restaurants (QSR) IT Market Value Share Analysis, by Country 13.6. South America Quick Service Restaurants (QSR) IT Market Forecast, by Country 13.6.1. Brazil 13.6.2. Mexico 13.6.3. Rest of South America 13.7. South America Quick Service Restaurants (QSR) IT Market Analysis, by Country 13.8. Brazil Quick Service Restaurants (QSR) IT Market Forecast, by Component 13.8.1. Hardware 13.8.1.1. Digital Signage 13.8.1.2. Kiosks 13.8.1.3. Drive through terminals 13.8.1.4. Point of Sales 13.8.1.5. Handheld devices 13.8.1.6. Digital menu cards 13.8.2. Software 13.8.2.1. Front of House 13.8.2.2. Inventory Management 13.8.2.3. Reconciliation 13.8.2.4. Labor Management 13.8.2.5. HR Software 13.8.2.6. Data Analytics 13.8.2.7. Marketing 13.8.2.8. Restaurant Operation 13.8.2.9. Support Operation 13.8.2.10. Franchise Management 13.8.3. Service 13.9. Mexico Quick Service Restaurants (QSR) IT Market Forecast, by Component 13.9.1. Hardware 13.9.1.1. Digital Signage 13.9.1.2. Kiosks 13.9.1.3. Drive through terminals 13.9.1.4. Point of Sales 13.9.1.5. Handheld devices 13.9.1.6. Digital menu cards 13.9.2. Software 13.9.2.1. Front of House 13.9.2.2. Inventory Management 13.9.2.3. Reconciliation 13.9.2.4. Labor Management 13.9.2.5. HR Software 13.9.2.6. Data Analytics 13.9.2.7. Marketing 13.9.2.8. Restaurant Operation 13.9.2.9. Support Operation 13.9.2.10. Franchise Management 13.9.3. Service 13.10. Rest of South America Quick Service Restaurants (QSR) IT Market Forecast, by Component 13.10.1. Hardware 13.10.1.1. Digital Signage 13.10.1.2. Kiosks 13.10.1.3. Drive through terminals 13.10.1.4. Point of Sales 13.10.1.5. Handheld devices 13.10.1.6. Digital menu cards 13.10.2. Software 13.10.2.1. Front of House 13.10.2.2. Inventory Management 13.10.2.3. Reconciliation 13.10.2.4. Labor Management 13.10.2.5. HR Software 13.10.2.6. Data Analytics 13.10.2.7. Marketing 13.10.2.8. Restaurant Operation 13.10.2.9. Support Operation 13.10.2.10. Franchise Management 13.10.3. Service 13.11. South America Quick Service Restaurants (QSR) IT Market Attractiveness Analysis 13.11.1. By Component 13.12. PEST Analysis 13.13. Key Trends 13.14. Key Developments 14. Company Profiles 14.1. Market Share Analysis, by Company 14.2. Competition Matrix 14.2.1. Competitive Benchmarking of key players by price, presence, market share, Applications and R&D investment 14.2.2. Market Consolidation 14.2.2.1. M&A by Regions, Investment and Applications 14.2.2.2. M&A Key Players, Forward Integration and Backward Integration 14.3. Company Profiles: Key Players 14.3.1. Microsoft Corporation 14.3.1.1. Company Overview 14.3.1.2. Financial Overview 14.3.1.3. Product Portfolio 14.3.1.4. Business Strategy 14.3.1.5. Recent Developments 14.3.1.6. Development Footprint 14.3.2. Abcom Pty Ltd. 14.3.3. CAKE Corporation 14.3.4. Cognizant 14.3.5. Delphi Display Systems, Inc. 14.3.6. GoFrugal Technologies Pvt. Ltd. 14.3.7. HM Electronics, Inc. 14.3.8. Imagine Print Solutions 14.3.9. LG Display Co. Ltd. 14.3.10. NCR Corporation 14.3.11. NEC Display Solutions of America, Inc. 14.3.12. Oracle Corporation 14.3.13. Panasonic Corporation 14.3.14. PAR Technology Corporation 14.3.15. Restaurant Service Solutions 14.3.16. Revel Systems, Inc. 14.3.17. Verifone Systems, Inc. 15. Primary Key Insights
  • INQUIRE BEFORE BUYING