Mobile Value Added Services Market: Global Industry Analysis and Forecast (2024-2030) by Solution, End User, Vertical and Region

Global Mobile Value Added Services Market size was valued at USD 997.57 Bn in 2023 and is expected to reach USD 2026.4 Bn by 2030, at a CAGR of 15.2%.

Mobile Value Added Services Market Overview

Mobile Value Added Services (MVAS) integrate a range of non-core services offered in conjunction with basic mobile communication functions. These services, designed to enhance user experience and offer additional functionalities beyond standard voice calls and messaging, include offerings including mobile banking, entertainment, mobile gaming, location-based services, and m-commerce MVAS leverages the capabilities of mobile networks to provide diverse functionalities that provide to user demands, preferences and convenience. They often involve third-party collaborations, enabling telecom operators to deliver a broader spectrum of services and create added value for users. The Mobile Value Added Services Market has evolved significantly, integrating cutting-edge solutions like IoT applications, augmented reality services, and personalized content delivery. This transformation in MVAS is pivotal in diversifying revenue streams within the telecom sector, extending beyond conventional voice and data services. MVAS provides to the dynamic needs of mobile users, fostering customer loyalty and driving revenue growth within the market landscape. The Mobile Value Added Services Market is driven significantly by the increasing global penetration of smartphones. As more users access the internet through smartphones, there's a heightened demand for diverse MVAS like mobile entertainment, banking, and e-commerce. This surge in smartphone usage increases the MVAS potential user base, providing service providers with a substantial opportunity to innovate and provide to a larger audience. The advent of 5G technology serves as an essential for MVAS growth, enabling faster speeds and lower latency, ideal for supporting sophisticated MVAS such as augmented reality (AR) and IoT applications. A prevailing trend influencing MVAS is the emphasis on personalized and location-specific services, allowing providers to offer customized content and experiences tailored to user preferences and geographic locations. The Mobile Value Added Services (MVAS) sector's growth is catalysed by strategic collaborations among telecom operators, content providers, and technology firms. These partnerships foster innovation, facilitating the development of novel MVAS solutions. By expanding service portfolios and enhancing customer engagement strategies, these collaborations significantly contribute to bolstering revenue streams within the dynamic Mobile Value Added Services Market.Mobile Value Added Services 
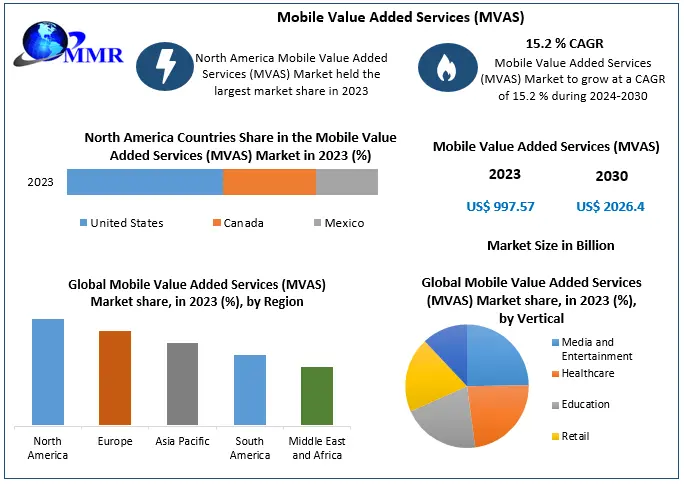
To know about the Research Methodology :- Request Free Sample Report

Mobile Value Added Services Market Trend

Increasing Focus on Cybersecurity and Data Privacy With the exponential growth in mobile device usage for various services including banking, e-commerce, and communication, the volume of sensitive data being transmitted and stored has surged. This increase in data usage and transmission makes mobile platforms lucrative targets for cyber threats, raising concerns about data breaches, identity theft, and unauthorized access. The evolving nature of cyber threats poses significant risks to both users and service providers. Malware, phishing attacks, and other sophisticated cyber threats specifically targeting mobile platforms have become more prevalent. As a result, there's a heightened awareness among MVAS providers and users about the importance of safeguarding data against these evolving threats which boost Mobile Value Added Services Market. Trust is foundational in the digital space. Users are increasingly concerned about the security of their personal information. MVAS providers recognize that ensuring strong cybersecurity measures and respecting data privacy not only protects users but also builds trust and credibility. It becomes a differentiating factor for users when choosing between several service providers. The introduction and enforcement of stringent data protection regulations (e.g., GDPR, CCPA) have compelled MVAS providers to prioritize data privacy. Compliance with these regulations is vital to avoid penalties and maintain consumer trust. The regulatory landscape continues to evolve, necessitating constant adaptation and adherence by service providers.

Mobile Value Added Services Market Dynamics

Driver Evolution Of Consumer Behavior and Preferences to Boost Market Growth With an increasingly fast-paced lifestyle, consumers seek convenience, speed and accessibility. Mobile devices have become integral to daily routines, serving as not just communication tools but also as gateways to entertainment, information and commerce. within the Mobile Value Added Services Market, the growing reliance on smartphones has fuelled heightened consumer expectations for on-the-go, comprehensive services. There's a rising demand for personalized experiences, including tailored content recommendations, targeted advertising, and adaptive services aligning with individual behaviors and usage patterns. This evolution reflects the MVAS market's pivot towards providing to diverse consumer needs in a more personalized, customer-centric manner. The desire for customization drives MVAS providers to develop offerings that dynamically adapt and cater to specific user needs. The preference for on-demand services is a significant factor. Consumers increasingly seek instant access to a wide range of services such as entertainment, banking, shopping and healthcare through their mobile devices. This demand fuels the creation of MVAS which offers quick and seamless access to these services. Consumers prioritize a superior user experience. They expect smooth interfaces, intuitive designs and minimal hassle when using mobile services. Within the Mobile Value Added Services Market, providers are dedicated to enhancing user interfaces, optimizing performance, and streamlining user journeys to meet evolving expectations. These MVAS providers diligently monitor and flexibly adapt to emerging trends in consumer behavior, ensuring their services remain aligned with the dynamic preferences of the market. For instance, the growth of social media usage has led to MVAS integrating social features into their offerings, enabling users to connect and share experiences seamlessly. Opportunity Incorporation of 5G, AI, and Edge Computing The fusion of 5G and edge computing signifies a transformative opportunity within the Mobile Value Added Services Market. 5G's tenfold increase in speeds over 4G, paired with edge computing's latency reduction, presents unparalleled potential. Achieving the stringent 1ms network latency relies on standards yet to be unveiled in 3GPP's Release 16, where edge computing is expected to play an essential role. Operators globally adopt varied approaches to 5G deployment. Enthusiastic investment in 5G by US, Chinese, Korean, and Japanese operators contrast with a more measured stance initially seen in Europe. European operators invest significantly in their LTE networks while gradually transitioning toward 5G, particularly with recent early deployments in major cities. Edge computing holds the potential to seed a 5G market before widespread coverage, enabling diverse applications. While some regions express reservations about rapid broad coverage, acknowledging 5G's cost advantages in urban and select suburban areas, challenges persist in expanding beyond isolated "5G islands" to catalyze new services including ultra-low latency and massive machine-to-machine communication. Unlocking the full potential of 5G for new use cases, demanded by enterprises, pivots on establishing consensus on later release standards. This convergence underscores an opportunity for MVAS, contingent on overcoming coverage limitations and fostering an ecosystem conducive to innovative 5G-driven services. In 2022, Asia Pacific led in global 5G subscriptions, accounting for over half due to rapid adoption in countries like China and South Korea. The region's rapid tech adoption, rising smartphone users, and demand for diverse Mobile Value Added Services fuelled its position as the fastest-growing Mobile Value Added Services Market globally.Mobile Value Added Services (MVAS)1 Restraint Regulatory Compliance and Data Privacy. Laws such as GDPR and CCPA impose strict guidelines on data collection, storage, and usage. Compliance needs comprehensive measures to protect user data, impacting the way MVAS providers offer personalized services. Compliance often restricts the extent to which companies leverage user data for tailoring services. This limitation affects the depth and breadth of personalization in MVAS offerings, potentially reducing their appeal to consumers. Ensuring compliance demands substantial investment in technology, staff training, and legal expertise. Compliance is intricate and costly, particularly for smaller companies or startups entering the MVAS market. Increasing awareness about data privacy among users influences their perception of MVAS. Concerns regarding data misuse or breaches erode trust and deter consumers from engaging with MVAS, impacting Mobile Value Added Services Market market adoption. The need to adhere to stringent regulations sometimes limits the scope for innovative uses of data, hindering MVAS providers' ability to create groundbreaking services or fully leverage data-driven insights.

Mobile Value Added Services Market Segment Analysis

Based on the Solution, the market is segmented into Short Messaging Service (SMS), Multimedia Messaging Service (MMS), Mobile Money, Mobile Infotainment and Others. Mobile Money is expected to dominate the Mobile Value Added Services Market during the forecast period.  Mobile Money stands as the prevailing force in the Mobile Value Added Services (VAS) Market, revolutionizing financial transactions through digital exchange and value storage, all facilitated via mobile money accounts. Offered by mobile network operators or partnering entities, this service operates independently of traditional banking networks, eliminating the requirement for a bank account and solely requiring a basic mobile phone. Unlike mobile banking, which involves accessing banking services via mobile applications, Mobile Money enables diverse financial transactions directly through a mobile device. It transcends the mere top-up of mobile credit, evolving to incorporate functionalities such as managing credit cards and loyalty programs, accessing bank accounts, and facilitating payments akin to an everyday wallet. The landscape of Mobile Money innovations is driving a substantial shift in how people engage in transactions, promising substantial transformations in payment methodologies for goods and services. One facet of this innovation centers on NFC contactless mobile payments, poised to shape future standardization endeavors. The emphasis lies on mobile money transfer and mobile banking services, crucial components that facilitate financial inclusion in which Mobile Value Added Services Market growth. Mobile Money's versatile functionalities and its profound impact on reshaping financial ecosystems mark it as the predominant solution within the realm of Mobile Value Added Services. Its capability to transcend traditional banking structures while leveraging mobile devices positions it at the forefront of a transformative shift in global financial landscapes, promising greater accessibility, convenience, and inclusivity in financial services.America Mobile Value Added Services (MVAS)2

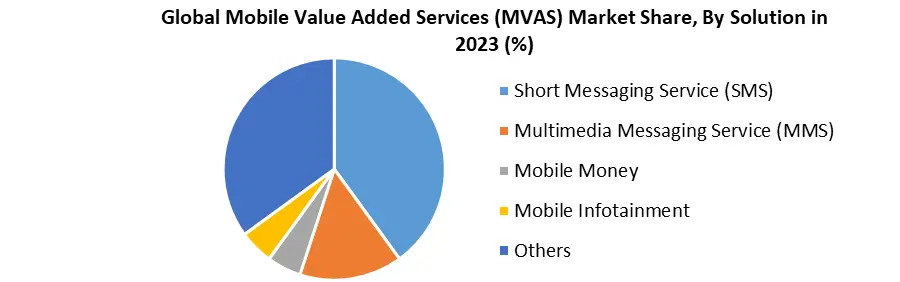
Mobile Value Added Services Market Regional Insights

North America dominated the Mobile Value Added Services Market share in 2022 and is expected to continue its dominance over the forecast period.  The region is home to numerous tech giants and innovative startups, fostering an environment conducive to technological advancements. This innovation culture drives the development of cutting-edge MVAS offerings. North America boasts rapid mobile networks and infrastructure, facilitating the widespread adoption of MVAS. High-speed connectivity and extensive network coverage create a favorable environment for MVAS deployment and usage. Historically, North American consumers have shown an early affinity for new technologies. The willingness to embrace and adopt new digital services and innovations has accelerated the growth of MVAS in the region. The population in North America is tech-savvy, with a high level of digital literacy. This consumer base is open to trying new digital services, encouraging MVAS providers to introduce innovative offerings. North America, particularly the United States, possesses a strong economy and high disposable income levels. This financial capacity allows consumers to invest in premium MVAS, contributing to market growth. The region hosts a vibrant startup ecosystem, fostering entrepreneurship and the development of new MVAS solutions. Access to funding, resources, and a supportive business environment encourages MVAS innovation. In North America, the Mobile Value Added Services Market has witnessed strong growth, with unique mobile subscribers exceeding 300 million in 2017 and expected to reach 328 million by 2025, covering 86% of the population. This surge extends to around 420 million mobile connections and an expected 515 million licensed cellular IoT connections by 2025. This escalation, coupled with high subscriber penetration and substantial consumer spending on mobile services, positions North America as a dominant force in VAS, valuing $260 billion in 2017, surpassing key global markets. The region's swift transition to next-gen devices and networks, particularly in the US, drives its leadership in mobile internet penetration, broadband, and smartphone adoption. By 2022, the VAS market is expected to contribute $1.1 trillion to the economy, constituting 4.9% of GDP, fostering job creation (nearly 2.5 million jobs) and significantly contributing to public sector funding via various taxation avenues, including spectrum auctions.

Mobile Value Added Services Market Scope: Inquire before buying

Global Mobile Value Added Services Market
Report Coverage Details
Base Year: 2023 Forecast Period: 2024-2030
Historical Data: 2018 to 2023 Market Size in 2023: US $ 997.57 Bn.
Forecast Period 2024 to 2030 CAGR: 15.2% Market Size in 2030: US $ 2026.4 Bn.
Segments Covered: By Solution Short Messaging Service (SMS) Multimedia Messaging Service (MMS) Mobile Money Mobile Infotainment Others
By End User SMBs Enterprises
By Vertical Media and Entertainment Healthcare Education Retail Others

Global Mobile Value Added Services Market, by Region

North America (United States, Canada and Mexico) Europe (UK, France, Germany, Italy, Spain, Sweden, Austria and Rest of Europe) Asia Pacific (China, South Korea, Japan, India, Australia, Indonesia, Malaysia, Vietnam, Taiwan, Bangladesh, Pakistan and Rest of APAC) Middle East and Africa (South Africa, GCC, Egypt, Nigeria and Rest of ME&A) South America (Brazil, Argentina Rest of South America)

Mobile Value Added Services Key players

Global 1. Google (Alphabet Inc.) (Mountain View, California, USA) 2. Apple Inc. ( Cupertino, California, USA) 3. Samsung Electronics ( Suwon, South Korea) 4. Facebook, Inc. ( Menlo Park, California, USA) 5. Amazon.com, Inc. ( Seattle, Washington, USA) North America 1. Twitter, Inc. (San Francisco, California, USA) 2. Microsoft Corporation ( Redmond, Washington, USA) 3. Snap Inc. (Santa Monica, California, USA) 4. AT&T Inc. ( Dallas, Texas, USA) 5. Verizon Communications Inc. ( New York City, New York, USA) 6. LinkedIn Corporation ( Sunnyvale, California, USA) 7. IBM Corporation ( Armonk, New York, USA) 8. Qualcomm Incorporated ( San Diego, California, USA) 9. PayPal Holdings, Inc. ( San Jose, California, USA) 10. Mastercard Incorporated (Purchase, New York, USA) Europe 1. Nokia Corporation ( Espoo, Finland) 2. Telefonaktiebolaget LM Ericsson (Ericsson) ( Stockholm, Sweden) 3. Vodafone Group Plc (London, United Kingdom) 4. Orange S.A( France) 5. Docomo Digital ( London, United Kingdom) Asia Pacific 1. Samsung Electronics ( Suwon, South Korea) 2. Tencent Holdings Limited ( Shenzhen, China) 3. Alibaba Group ( Hangzhou, China) 4. Huawei Technologies Co., Ltd. ( Shenzhen, China) 5. SoftBank Group Corp. ( Tokyo, Japan)

Frequently Asked Questions:

1] What is the growth rate of the Global Mobile Value Added Services Market? Ans. The Global Mobile Value Added Services Market is growing at a significant rate of 15.2 % during the forecast period. 2] Which region is expected to dominate the Global Mobile Value Added Services Market? Ans. North America is expected to dominate the Mobile Value Added Services Market during the forecast period. 3] What is the expected Global Mobile Value Added Services Market size by 2030? Ans. The Mobile Value Added Services Market size is expected to reach USD 2026.4 Billion by 2030 4] Which are the top players in the Global Mobile Value Added Services Market? Ans. The major top players in the Global Mobile Value Added Services Market are Google (Alphabet Inc.) (Mountain View, California, USA),Apple Inc. ( Cupertino, California, USA), Samsung Electronics ( Suwon, South Korea),Facebook, Inc. ( Menlo Park, California, USA),Amazon.com, Inc. ( Seattle, Washington, USA),Twitter, Inc. (San Francisco, California, USA) and Others. 5] What are the factors driving the Global Mobile Value Added Services Market growth? Ans. Increased Smartphone Penetration and increasing Demand for Personalized Services are expected to drive market growth during the forecast period.
1. Mobile Value Added Services Market: Research Methodology 2. Mobile Value Added Services Market Introduction 2.1. Study Assumption and Market Definition 2.2. Scope of the Study 2.3. Executive Summary 3. Mobile Value Added Services Market: Dynamics 3.1. Mobile Value Added Services Market Trends by Region 3.1.1. North America Mobile Value Added Services Market Trends 3.1.2. Europe Mobile Value Added Services Market Trends 3.1.3. Asia Pacific Mobile Value Added Services Market Trends 3.1.4. Middle East and Africa Mobile Value Added Services Market Trends 3.1.5. South America Mobile Value Added Services Market Trends 3.2. Mobile Value Added Services Market Dynamics by Region 3.2.1. North America 3.2.1.1. North America Mobile Value Added Services Market Drivers 3.2.1.2. North America Mobile Value Added Services Market Restraints 3.2.1.3. North America Mobile Value Added Services Market Opportunities 3.2.1.4. North America Mobile Value Added Services Market Challenges 3.2.2. Europe 3.2.2.1. Europe Mobile Value Added Services Market Drivers 3.2.2.2. Europe Mobile Value Added Services Market Restraints 3.2.2.3. Europe Mobile Value Added Services Market Opportunities 3.2.2.4. Europe Mobile Value Added Services Market Challenges 3.2.3. Asia Pacific 3.2.3.1. Asia Pacific Mobile Value Added Services Market Drivers 3.2.3.2. Asia Pacific Mobile Value Added Services Market Restraints 3.2.3.3. Asia Pacific Mobile Value Added Services Market Opportunities 3.2.3.4. Asia Pacific Mobile Value Added Services Market Challenges 3.2.4. Middle East and Africa 3.2.4.1. Middle East and Africa Mobile Value Added Services Market Drivers 3.2.4.2. Middle East and Africa Mobile Value Added Services Market Restraints 3.2.4.3. Middle East and Africa Mobile Value Added Services Market Opportunities 3.2.4.4. Middle East and Africa Mobile Value Added Services Market Challenges 3.2.5. South America 3.2.5.1. South America Mobile Value Added Services Market Drivers 3.2.5.2. South America Mobile Value Added Services Market Restraints 3.2.5.3. South America Mobile Value Added Services Market Opportunities 3.2.5.4. South America Mobile Value Added Services Market Challenges 3.3. PORTER’s Five Forces Analysis 3.4. PESTLE Analysis 3.5. Technology Roadmap 3.6. Regulatory Landscape by Region 3.6.1. North America 3.6.2. Europe 3.6.3. Asia Pacific 3.6.4. Middle East and Africa 3.6.5. South America 3.7. Key Opinion Leader Analysis For Mobile Value Added Services Market 3.8. Analysis of Government Schemes and Initiatives For Mobile Value Added Services Market 3.9. The Global Pandemic Impact on Mobile Value Added Services Market 4. Mobile Value Added Services Market: Global Market Size and Forecast by Segmentation (by Value in USD Million) (2023-2030) 4.1. Mobile Value Added Services Market Size and Forecast, by Solution (2023-2030) 4.1.1. Short Messaging Service (SMS) 4.1.2. Multimedia Messaging Service (MMS) 4.1.3. Mobile Money 4.1.4. Mobile Infotainment 4.1.5. Others 4.2. Mobile Value Added Services Market Size and Forecast, by End User (2023-2030) 4.2.1. SMBs 4.2.2. Enterprises 4.3. Mobile Value Added Services Market Size and Forecast, by Vertical (2023-2030) 4.3.1. Media and Entertainment 4.3.2. Healthcare 4.3.3. Education 4.3.4. Retail 4.3.5. Others 4.4. Mobile Value Added Services Market Size and Forecast, by Region (2023-2030) 4.4.1. North America 4.4.2. Europe 4.4.3. Asia Pacific 4.4.4. Middle East and Africa 4.4.5. South America 5. North America Mobile Value Added Services Market Size and Forecast by Segmentation (by Value in USD Million) (2023-2030) 5.1. North America Mobile Value Added Services Market Size and Forecast, by Solution (2023-2030) 5.1.1. Short Messaging Service (SMS) 5.1.2. Multimedia Messaging Service (MMS) 5.1.3. Mobile Money 5.1.4. Mobile Infotainment 5.1.5. Others 5.2. North America Mobile Value Added Services Market Size and Forecast, by End User (2023-2030) 5.2.1. SMBs 5.2.2. Enterprises 5.3. North America Mobile Value Added Services Market Size and Forecast, by Vertical (2023-2030) 5.3.1. Apparel and Fashion 5.3.2. Home Furnishing 5.3.3. Healthcare and Medical 5.3.4. Automotive 5.3.5. Sports and Outdoor 5.3.6. Agriculture and Farming 5.3.7. Others 5.4. North America Mobile Value Added Services Market Size and Forecast, by Country (2023-2030) 5.4.1. United States 5.4.1.1. United States Mobile Value Added Services Market Size and Forecast, by Solution (2023-2030) 5.4.1.1.1. Short Messaging Service (SMS) 5.4.1.1.2. Multimedia Messaging Service (MMS) 5.4.1.1.3. Mobile Money 5.4.1.1.4. Mobile Infotainment 5.4.1.1.5. Others 5.4.1.2. United States Mobile Value Added Services Market Size and Forecast, by End User (2023-2030) 5.4.1.2.1. SMBs 5.4.1.2.2. Enterprises 5.4.1.3. United States Mobile Value Added Services Market Size and Forecast, by Vertical (2023-2030) 5.4.1.3.1. Media and Entertainment 5.4.1.3.2. Healthcare 5.4.1.3.3. Education 5.4.1.3.4. Retail 5.4.1.3.5. Others 5.4.1.3.6. 5.4.2. Canada 5.4.2.1. Canada Mobile Value Added Services Market Size and Forecast, by Solution (2023-2030) 5.4.2.1.1. Short Messaging Service (SMS) 5.4.2.1.2. Multimedia Messaging Service (MMS) 5.4.2.1.3. Mobile Money 5.4.2.1.4. Mobile Infotainment 5.4.2.1.5. Others 5.4.2.1.6. 5.4.2.2. Canada Mobile Value Added Services Market Size and Forecast, by End User (2023-2030) 5.4.2.2.1. SMBs 5.4.2.2.2. Enterprises 5.4.2.3. Canada Mobile Value Added Services Market Size and Forecast, by Vertical (2023-2030) 5.4.2.3.1. Media and Entertainment 5.4.2.3.2. Healthcare 5.4.2.3.3. Education 5.4.2.3.4. Retail 5.4.2.3.5. Others 5.4.3. Mexico 5.4.3.1. Mexico Mobile Value Added Services Market Size and Forecast, by Solution (2023-2030) 5.4.3.1.1. Short Messaging Service (SMS) 5.4.3.1.2. Multimedia Messaging Service (MMS) 5.4.3.1.3. Mobile Money 5.4.3.1.4. Mobile Infotainment 5.4.3.1.5. Others 5.4.3.2. Mexico Mobile Value Added Services Market Size and Forecast, by End User (2023-2030) 5.4.3.2.1. SMBs 5.4.3.2.2. Enterprises 5.4.3.3. Mexico Mobile Value Added Services Market Size and Forecast, by Vertical (2023-2030) 5.4.3.3.1. Media and Entertainment 5.4.3.3.2. Healthcare 5.4.3.3.3. Education 5.4.3.3.4. Retail 5.4.3.3.5. Others 5.4.3.3.6. 6. Europe Mobile Value Added Services Market Size and Forecast by Segmentation (by Value in USD Million) (2023-2030) 6.1. Europe Mobile Value Added Services Market Size and Forecast, by Solution (2023-2030) 6.2. Europe Mobile Value Added Services Market Size and Forecast, by End User (2023-2030) 6.3. Europe Mobile Value Added Services Market Size and Forecast, by Vertical (2023-2030) 6.4. Europe Mobile Value Added Services Market Size and Forecast, by Country (2023-2030) 6.4.1. United Kingdom 6.4.1.1. United Kingdom Mobile Value Added Services Market Size and Forecast, by Solution (2023-2030) 6.4.1.2. United Kingdom Mobile Value Added Services Market Size and Forecast, by End User (2023-2030) 6.4.1.3. United Kingdom Mobile Value Added Services Market Size and Forecast, by Vertical (2023-2030) 6.4.2. France 6.4.2.1. France Mobile Value Added Services Market Size and Forecast, by Solution (2023-2030) 6.4.2.2. France Mobile Value Added Services Market Size and Forecast, by End User (2023-2030) 6.4.2.3. France Mobile Value Added Services Market Size and Forecast, by Vertical (2023-2030) 6.4.3. Germany 6.4.3.1. Germany Mobile Value Added Services Market Size and Forecast, by Solution (2023-2030) 6.4.3.2. Germany Mobile Value Added Services Market Size and Forecast, by End User (2023-2030) 6.4.3.3. Germany Mobile Value Added Services Market Size and Forecast, by Vertical (2023-2030) 6.4.4. Italy 6.4.4.1. Italy Mobile Value Added Services Market Size and Forecast, by Solution (2023-2030) 6.4.4.2. Italy Mobile Value Added Services Market Size and Forecast, by End User (2023-2030) 6.4.4.3. Italy Mobile Value Added Services Market Size and Forecast, by Vertical (2023-2030) 6.4.5. Spain 6.4.5.1. Spain Mobile Value Added Services Market Size and Forecast, by Solution (2023-2030) 6.4.5.2. Spain Mobile Value Added Services Market Size and Forecast, by End User (2023-2030) 6.4.5.3. Spain Mobile Value Added Services Market Size and Forecast, by Vertical (2023-2030) 6.4.6. Sweden 6.4.6.1. Sweden Mobile Value Added Services Market Size and Forecast, by Solution (2023-2030) 6.4.6.2. Sweden Mobile Value Added Services Market Size and Forecast, by End User (2023-2030) 6.4.6.3. Sweden Mobile Value Added Services Market Size and Forecast, by Vertical (2023-2030) 6.4.7. Austria 6.4.7.1. Austria Mobile Value Added Services Market Size and Forecast, by Solution (2023-2030) 6.4.7.2. Austria Mobile Value Added Services Market Size and Forecast, by End User (2023-2030) 6.4.7.3. Austria Mobile Value Added Services Market Size and Forecast, by Vertical (2023-2030) 6.4.8. Rest of Europe 6.4.8.1. Rest of Europe Mobile Value Added Services Market Size and Forecast, by Solution (2023-2030) 6.4.8.2. Rest of Europe Mobile Value Added Services Market Size and Forecast, by End User (2023-2030) 6.4.8.3. Rest of Europe Mobile Value Added Services Market Size and Forecast, by Vertical (2023-2030) 7. Asia Pacific Mobile Value Added Services Market Size and Forecast by Segmentation (by Value in USD Million) (2023-2030) 7.1. Asia Pacific Mobile Value Added Services Market Size and Forecast, by Solution (2023-2030) 7.2. Asia Pacific Mobile Value Added Services Market Size and Forecast, by End User (2023-2030) 7.3. Asia Pacific Mobile Value Added Services Market Size and Forecast, by Vertical (2023-2030) 7.4. Asia Pacific Mobile Value Added Services Market Size and Forecast, by Country (2023-2030) 7.4.1. China 7.4.1.1. China Mobile Value Added Services Market Size and Forecast, by Solution (2023-2030) 7.4.1.2. China Mobile Value Added Services Market Size and Forecast, by End User (2023-2030) 7.4.1.3. China Mobile Value Added Services Market Size and Forecast, by Vertical (2023-2030) 7.4.2. S Korea 7.4.2.1. S Korea Mobile Value Added Services Market Size and Forecast, by Solution (2023-2030) 7.4.2.2. S Korea Mobile Value Added Services Market Size and Forecast, by End User (2023-2030) 7.4.2.3. S Korea Mobile Value Added Services Market Size and Forecast, by Vertical (2023-2030) 7.4.3. Japan 7.4.3.1. Japan Mobile Value Added Services Market Size and Forecast, by Solution (2023-2030) 7.4.3.2. Japan Mobile Value Added Services Market Size and Forecast, by End User (2023-2030) 7.4.3.3. Japan Mobile Value Added Services Market Size and Forecast, by Vertical (2023-2030) 7.4.4. India 7.4.4.1. India Mobile Value Added Services Market Size and Forecast, by Solution (2023-2030) 7.4.4.2. India Mobile Value Added Services Market Size and Forecast, by End User (2023-2030) 7.4.4.3. India Mobile Value Added Services Market Size and Forecast, by Vertical (2023-2030) 7.4.5. Australia 7.4.5.1. Australia Mobile Value Added Services Market Size and Forecast, by Solution (2023-2030) 7.4.5.2. Australia Mobile Value Added Services Market Size and Forecast, by End User (2023-2030) 7.4.5.3. Australia Mobile Value Added Services Market Size and Forecast, by Vertical (2023-2030) 7.4.6. Indonesia 7.4.6.1. Indonesia Mobile Value Added Services Market Size and Forecast, by Solution (2023-2030) 7.4.6.2. Indonesia Mobile Value Added Services Market Size and Forecast, by End User (2023-2030) 7.4.6.3. Indonesia Mobile Value Added Services Market Size and Forecast, by Vertical (2023-2030) 7.4.7. Malaysia 7.4.7.1. Malaysia Mobile Value Added Services Market Size and Forecast, by Solution (2023-2030) 7.4.7.2. Malaysia Mobile Value Added Services Market Size and Forecast, by End User (2023-2030) 7.4.7.3. Malaysia Mobile Value Added Services Market Size and Forecast, by Vertical (2023-2030) 7.4.8. Vietnam 7.4.8.1. Vietnam Mobile Value Added Services Market Size and Forecast, by Solution (2023-2030) 7.4.8.2. Vietnam Mobile Value Added Services Market Size and Forecast, by End User (2023-2030) 7.4.8.3. Vietnam Mobile Value Added Services Market Size and Forecast, by Vertical (2023-2030) 7.4.9. Taiwan 7.4.9.1. Taiwan Mobile Value Added Services Market Size and Forecast, by Solution (2023-2030) 7.4.9.2. Taiwan Mobile Value Added Services Market Size and Forecast, by End User (2023-2030) 7.4.9.3. Taiwan Mobile Value Added Services Market Size and Forecast, by Vertical (2023-2030) 7.4.10. Rest of Asia Pacific 7.4.10.1. Rest of Asia Pacific Mobile Value Added Services Market Size and Forecast, by Solution (2023-2030) 7.4.10.2. Rest of Asia Pacific Mobile Value Added Services Market Size and Forecast, by End User (2023-2030) 7.4.10.3. Rest of Asia Pacific Mobile Value Added Services Market Size and Forecast, by Vertical (2023-2030) 8. Middle East and Africa Mobile Value Added Services Market Size and Forecast by Segmentation (by Value in USD Million) (2022-2029 8.1. Middle East and Africa Mobile Value Added Services Market Size and Forecast, by Solution (2023-2030) 8.2. Middle East and Africa Mobile Value Added Services Market Size and Forecast, by End User (2023-2030) 8.3. Middle East and Africa Mobile Value Added Services Market Size and Forecast, by Vertical (2023-2030) 8.4. Middle East and Africa Mobile Value Added Services Market Size and Forecast, by Country (2023-2030) 8.4.1. South Africa 8.4.1.1. South Africa Mobile Value Added Services Market Size and Forecast, by Solution (2023-2030) 8.4.1.2. South Africa Mobile Value Added Services Market Size and Forecast, by End User (2023-2030) 8.4.1.3. South Africa Mobile Value Added Services Market Size and Forecast, by Vertical (2023-2030) 8.4.2. GCC 8.4.2.1. GCC Mobile Value Added Services Market Size and Forecast, by Solution (2023-2030) 8.4.2.2. GCC Mobile Value Added Services Market Size and Forecast, by End User (2023-2030) 8.4.2.3. GCC Mobile Value Added Services Market Size and Forecast, by Vertical (2023-2030) 8.4.3. Nigeria 8.4.3.1. Nigeria Mobile Value Added Services Market Size and Forecast, by Solution (2023-2030) 8.4.3.2. Nigeria Mobile Value Added Services Market Size and Forecast, by End User (2023-2030) 8.4.3.3. Nigeria Mobile Value Added Services Market Size and Forecast, by Vertical (2023-2030) 8.4.4. Rest of ME&A 8.4.4.1. Rest of ME&A Mobile Value Added Services Market Size and Forecast, by Solution (2023-2030) 8.4.4.2. Rest of ME&A Mobile Value Added Services Market Size and Forecast, by End User (2023-2030) 8.4.4.3. Rest of ME&A Mobile Value Added Services Market Size and Forecast, by Vertical (2023-2030) 9. South America Mobile Value Added Services Market Size and Forecast by Segmentation (by Value in USD Million) (2022-2029 9.1. South America Mobile Value Added Services Market Size and Forecast, by Solution (2023-2030) 9.2. South America Mobile Value Added Services Market Size and Forecast, by End User (2023-2030) 9.3. South America Mobile Value Added Services Market Size and Forecast, by Vertical (2023-2030) 9.4. South America Mobile Value Added Services Market Size and Forecast, by Country (2023-2030) 9.4.1. Brazil 9.4.1.1. Brazil Mobile Value Added Services Market Size and Forecast, by Solution (2023-2030) 9.4.1.2. Brazil Mobile Value Added Services Market Size and Forecast, by End User (2023-2030) 9.4.1.3. Brazil Mobile Value Added Services Market Size and Forecast, by Vertical (2023-2030) 9.4.2. Argentina 9.4.2.1. Argentina Mobile Value Added Services Market Size and Forecast, by Solution (2023-2030) 9.4.2.2. Argentina Mobile Value Added Services Market Size and Forecast, by End User (2023-2030) 9.4.2.3. Argentina Mobile Value Added Services Market Size and Forecast, by Vertical (2023-2030) 9.4.3. Rest Of South America 9.4.3.1. Rest Of South America Mobile Value Added Services Market Size and Forecast, by Solution (2023-2030) 9.4.3.2. Rest Of South America Mobile Value Added Services Market Size and Forecast, by End User (2023-2030) 9.4.3.3. Rest Of South America Mobile Value Added Services Market Size and Forecast, by Vertical (2023-2030) 10. Global Mobile Value Added Services Market: Competitive Landscape 10.1. MMR Competition Matrix 10.2. Competitive Landscape 10.3. Key Players Benchmarking 10.3.1. Company Name 10.3.2. Service Segment 10.3.3. End-user Segment 10.3.4. Revenue (2022) 10.3.5. Company Locations 10.4. Leading Mobile Value Added Services Market Companies, by Market Capitalization 10.5. Market Structure 10.5.1. Market Leaders 10.5.2. Market Followers 10.5.3. Emerging Players 10.6. Mergers and Acquisitions Details 11. Company Profile: Key Players 11.1. Google (Alphabet Inc.) (Mountain View, California, USA) 11.1.1. Company Overview 11.1.2. Business Portfolio 11.1.3. Financial Overview 11.1.4. SWOT Analysis 11.1.5. Strategic Analysis 11.1.6. Scale of Operation (Small, Medium, and Large) 11.1.7. Details on Partnership 11.1.8. Regulatory Accreditations and Certifications Received by Them 11.1.9. Awards Received by the Firm 11.1.10. Recent Developments 11.2. Apple Inc. ( Cupertino, California, USA) 11.3. Samsung Electronics ( Suwon, South Korea) 11.4. Facebook, Inc. ( Menlo Park, California, USA) 11.5. Amazon.com, Inc. ( Seattle, Washington, USA) 11.6. Twitter, Inc. (San Francisco, California, USA) 11.7. Microsoft Corporation ( Redmond, Washington, USA) 11.8. Snap Inc. (Santa Monica, California, USA) 11.9. AT&T Inc. ( Dallas, Texas, USA) 11.10. Verizon Communications Inc. ( New York City, New York, USA) 11.11. LinkedIn Corporation ( Sunnyvale, California, USA) 11.12. IBM Corporation ( Armonk, New York, USA) 11.13. Qualcomm Incorporated ( San Diego, California, USA) 11.14. PayPal Holdings, Inc. ( San Jose, California, USA) 11.15. Mastercard Incorporated ( Purchase, New York, USA) 11.16. Nokia Corporation ( Espoo, Finland) 11.17. Telefonaktiebolaget LM Ericsson (Ericsson) ( Stockholm, Sweden) 11.18. Vodafone Group Plc (London, United Kingdom) 11.19. Orange S.A( France) 11.20. Docomo Digital ( London, United Kingdom) 11.21. Samsung Electronics ( Suwon, South Korea) 11.22. Tencent Holdings Limited ( Shenzhen, China) 11.23. Alibaba Group ( Hangzhou, China) 11.24. Huawei Technologies Co., Ltd. ( Shenzhen, China) 11.25. SoftBank Group Corp. ( Tokyo, Japan) 12. Key Findings 13. Industry Recommendations
  • INQUIRE BEFORE BUYING