
DRAM Market Size by Type, Technology, Application, Region – Revenue Pool Analysis, Margin Structure Assessment, Capital Flow Trends, Competitive Benchmarking & Forecast to 2032
Overview
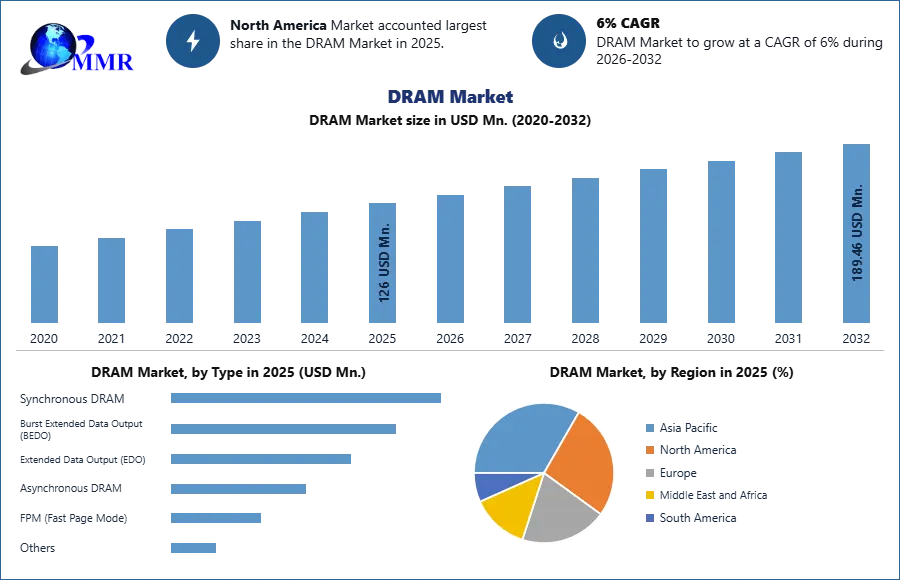
DRAM Market size was valued at US$ 126 Bn. in 2025 and the total DRAM Market revenue is expected to grow at 6 % from 2026 to 2032, reaching nearly US$ 189.46 Bn.
DRAM Market Overview:
Dynamic Random Access Memory, or DRAM, is a device that stores data on a different capacitor. The market is developing as a result of the global growth of data centers. The market size is also being driven by the development and growth of the semiconductor industries. Modern society requires safe data storage systems with increasing capacities owing to the accelerated adoption of modern communication technologies. Urbanization and rapid industrialization are two other drivers driving the DRAM market.
To know about the Research Methodology :- Request Free Sample Report
The size of the DRAM market is growing significantly, and it is expected that this growth continue over the forecast years. Each bit of data is stored in DRAM, which is made up of transistors and capacitors. DRAMs are preferred for storage in personal computers, workstations, and servers across a variety of markets and applications. Owing to its straightforward design, DRAM technology is preferred over static RAM and SRAM, which each employ about six transistors instead of only one. DRAM usage and market demand are influenced by the employment of cutting-edge semiconductor technology for storage. Furthermore, DRAM technology is more affordable than SRAM, giving it a competitive advantage.
This report analyzes the DRAM Market as the 2026 Middle East crisis triggers a historic "Memory Supercycle" and a systemic fabrication crisis. With the Strait of Hormuz disruption halting over one-third of global helium supply—essential for semiconductor lithography and cooling—and driving Brent crude to a peak of $115/bbl, the cost of energy-intensive wafer processing has surged. We explore how market leaders are pivoting toward HBM3E and HBM4 to satisfy explosive AI infrastructure demand, which is currently consuming 20% of global wafer capacity. By evaluating the shift from commodity DDR4 to AI-optimized architectures, this study provides stakeholders with strategic frameworks to navigate 2026’s high-inflation environment, where DRAM prices have surged 171% year-over-year amidst unprecedented geopolitical fragmentation.
Report scope:
The study's objective is to give market participants a complete view of the complementary and alternative medicine market. The study looks at the history and present conditions of the market as well as expected market size and trends. It also provides a straightforward analysis of complex data. The important players, including new entrants, industry leaders, and followers, actively and thoroughly conduct research. Along with the possible outcomes of the microeconomic components of the market, the analysis also presents the results of the PORTER and PESTEL assessments. Decision-makers will have a clear futuristic vision of the market after analyzing internal and external factors that could have a positive or negative impact on the firm.
The market segmentation analysis and market size projection in the study aid readers in understanding the dynamics and organization of the DRAM market. The study serves as a buyer's guide by clearly illuminating the competitive analysis of the leading businesses in complementary and alternative medicine by price, financial standing, product, product portfolio, growth strategies, and regional presence.
In order to assess and forecast the market for unified monitoring, we started by gathering data on the income of the major suppliers. In order to split the market, by Type (Synchronous DRAM, Burst Extended Data Output (BEDO), Extended Data Output (EDO), Asynchronous DRAM, FPM (Fast Page Mode),Others) by Technology (DDR4, DDR3, DDR5/GDDR5, DDR2, Others) by Application (PCs/laptops, Mobile Phones, Gaming Consoles, Networking Devices, Others) vendors' offerings are taken into account. In-depth interviews with key individuals, such as chief executive officers (CEOs), vice presidents (VPs), directors, and executives, were subsequently conducted to confirm these segments through primary research.
Utilizing bottom-up methods, the market size is calculated. To determine the major market players in the DRAM industry and to estimate their market revenues, primary and secondary research is undertaken. As opposed to secondary research, a primary research approach was employed, involving reading the annual and financial reports of the top manufacturers and conducting interviews with well-known opinion leaders and business leaders in the sector, including CEOs and marketing executives. Winbond Electronics Corporation, Samsung Electronics Co., Ltd., Powerchip Technology Corporation, Kingston Technology Corporation
Integrated Silicon Solution Inc. is a few of the top significant competitors in the global DRAM Market For the duration of the forecast period, they are continually strategizing about mergers and acquisitions to increase their market shares and growth potential.
DRAM Market Dynamics:
Market drivers:
Over the course of the forecast period, the market for dynamic random access memory is expected to grow owing to the widespread use of personal computers. In the forecast years, market growth is expected to be driven by the rising demand for high-memory smartphones and tablets, the requirement for quick online operability, and the accessibility of internet connectivity.
Furthermore, it is expected that increased demand for dynamic random access memory (DRAM), particularly in data center infrastructures, results from growing interest in cloud computing and the requirement for high-speed communication. Dynamic RAM is a low-power, high-density memory technology that manage the cooling, high-speed data transfer, and backup requirements of cloud services. Additionally, increased smartphone, laptop/tablet, digital camera, and other device sales are expected to support DRAM market. The market share of DRAM also grow as a result of the rising demand for processing technologies with more processing capability and reduced power consumption.
Market restraints:
The continuous market growth stifled by the high cost of DRAM chips, which have a detrimental effect on DRAM sales and usage in the forecast period. Because more individuals are working from home owing to the pandemic, manufacturers are concentrating on improving manufacturing capacities to keep up with demand for mobile PCs.
DRAM consumes more power than SRAM because its capacitors need to be recharged often to maintain their charge. Substantial power consumption is a key element that is expected to present significant obstacles to the growth of the DRAM market.
Market Opportunities:
DRAM has been the largest revenue-generating IC sector, and it is expected that it will continue to dominate the IC industry in 2025. As consumers and businesses shifted to home-based online activities as a result of the Covid-19 outbreak, computer systems underwent modifications. Additionally, a rise in the shipment of servers for data centers that process and store data will benefit DRAM sales. The increase in smartphone application MPU sales in the forecast year has been mostly attributed to the sale of more expensive 5G processors in the second half of 2025.
In 2026, it is expected that the introduction of 5G processors, which power new smartphones, increases sales of mobile application MPUs. The majority of 5G processors are built using the cutting-edge, more expensive 5nm process technology. Sales of DRAM rise significantly in comparison to other communications-related IC product sectors as a result of the rapid and sophisticated 5G smartphone market growth.
DRAM Market Segment Analysis:
Based on Type, The Synchronous DRAM segment is expected to grow at the highest CAGR during the forecast period. Demand for SDRAM to Rise Significantly, the synchronous DRAM (SDRAM) segment is expected to maintain its leadership position. By the end of 2025, the SDRAM market is expected to be worth USD 121 BN. The superior functional capabilities and efficiencies of SDRAM in comparison to conventional DRAMs are responsible for the segment growth.
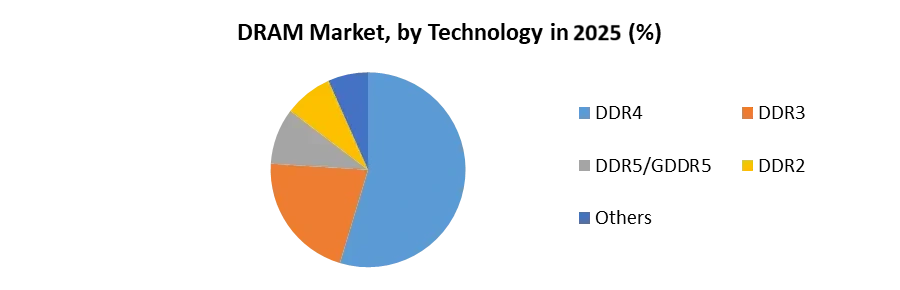
Based on Technology, The DDR4 segment is expected to grow at the highest CAGR during the forecast period. Overall speed is higher with DDR4 RAM. To get higher transfer rates and lower voltage, which results in a reduction in overall power usage. Compared to DDR3, DDR4 RAM reduces voltage by 41% while enhancing speed and bandwidth by 51%.
The fact that DDR4 offers a wider range of clock rates and timings, uses less power, and has lower latency overall than DDR3 modules is one of its key advantages. The DDR4 improves long-term system stability since it process more data simultaneously than earlier RAM alternatives. It is also a safer option for overclocking experiments because it process a lot more data without becoming overburdened. Finally, it relieves pressure on the entire computer.
Based on Application, The PCs/laptops segment is expected to grow at the highest CAGR during the forecast period. The biggest benefit of a laptop over a desktop computer is its portability. The laptop's small size, light weight, and internal battery make it easy to move from one location to another. Many versions are frequently used in public settings, such as parks, cafes, or while being transported in vehicles. The laptop may be used easily without any other accessories. Everything is built-in, including a keyboard, a built-in mouse (touchpad), speakers, a microphone, and a camera in many laptops.
The ability to access the web via wireless technologies such as Wi-Fi is the second benefit that has contributed to the rise in demand for laptops. Additionally, using the laptop for any kind of presentation is convenient. In this situation, you are not reliant on the venue's technical capabilities. There is no need to connect to the mains because the laptop can operate independently from its battery. Typically, having a laptop with you gives you immediate access to both personal and business information. Better teamwork amongst coworkers or pupils is the result.
DRAM Market Regional Insights:
North America dominated the market. Almost all DRAM chip production takes place in South Korea, which also has around half of the global DRAM chip production capacity. Furthermore, nearly half of the world's manufacturing is produced in China and Taiwan. The nation need faster-changing technology, more effective processing systems, and increased data generation across industries. Non-volatile, dense, and energy-efficient memories have become a top focus with the rise of mobile and low-power devices, high-end data centers, and massive on-chip caches.
There will be around 2,752 data centers in the US in 2025, predicts Cloud scene. The data center has emerged as the new computing unit. Data processing units (DPUs), which combine CPUs, GPUs, and DPUs into a single completely programmable computing unit, are a crucial component of contemporary, secure accelerated data centers. Furthermore, according to NVidia, data management consumes up to 31% of the central processing units in data centers.
By incorporating stronger AI into their DPUs, organizations attempt to differentiate themselves from competitors. The company, which has its headquarters in Santa Clara, California, unveiled its series of data processing units, or DPUs, which can consolidate more data center hardware into a single chip. The DPU is a system-on-chip that combines customizable Arm CPU cores with a high-performance network interface (SoC).
Additionally, 5G makes it possible to transmit a significant amount of telecommunications data quickly, which will increase the storage requirements for devices. The adoption of DRAM would rise as a result of this factor. Additionally, the nation's three largest wireless service providers—Verizon, AT&T, and T-Mobile Network—are actively investigating the financial possibilities of 5G modems to deliver high-speed internet access to buildings without the need for cable or xDSL wiring. Additionally, the nation is seeing a lot of investments in semiconductors and electronics, which is helping to expand the industry under study. For instance, Global Foundries (GF), the industry pioneer in the production of feature-rich semiconductors, announced its expansion plans for its most cutting-edge manufacturing site in upstate New York during the ensuing years. These plans include making immediate improvements at its current Fab 8 plant to address the worldwide chip shortfall and building a second fab on the same campus that will double the facility's capacity.
Recent Industry Developments (2025–2026)
| Exact Date | Company | Development | Impact |
|---|---|---|---|
| 23 March 2026 | SK Hynix Inc. | The company officially warned that the global DRAM shortage driven by AI infrastructure demand could persist until 2030. | This outlook signals a prolonged period of high ASPs (Average Selling Prices) and supply constraints for non-AI sectors like automotive and consumer electronics. |
| 26 February 2026 | Samsung Electronics | TrendForce confirmed that Samsung regained its No. 1 market share position in Q4 2025 following a historic surge in conventional DRAM contract prices. | The recovery solidifies Samsung's pricing power as blended contract prices for DRAM and HBM rose by over 50% quarter-on-quarter. |
| 08 January 2026 | Micron Technology, Inc. | The company reported a sharp upswing in profitability driven by 70% price hikes in automotive DRAM and high-demand HBM3E modules. | The shift toward high-margin AI memory significantly improves Micron's financial position but exacerbates supply bottlenecks for legacy DDR4 users. |
DRAM Market Scope: Inquire before buying
| DRAM Market | |||
|---|---|---|---|
| Report Coverage | Details | ||
| Base Year: | 2025 | Forecast Period: | 2026-2032 |
| Historical Data: | 2020 to 2025 | Market Size in 2025: | 126 USD Mn. |
| Forecast Period 2026-2032 CAGR: | 6% | Market Size in 2032: | 189.44 USD Mn. |
| Segments Covered: | by Type | Synchronous DRAM Burst Extended Data Output (BEDO) Extended Data Output (EDO) Asynchronous DRAM FPM (Fast Page Mode) Others |
|
| by Technology | DDR4 DDR3 DDR5/GDDR5 DDR2 Others |
||
| by Application | PCs/laptops Mobile Phones Gaming Consoles Networking Devices Others |
||
DRAM Market, by Region
North America (United States, Canada and Mexico)
Europe (UK, France, Germany, Italy, Spain, Sweden, Austria and Rest of Europe)
Asia Pacific (China, South Korea, Japan, India, Australia, Indonesia, Malaysia, Vietnam, Taiwan, Bangladesh, Pakistan and Rest of APAC)
Middle East and Africa (South Africa, GCC, Egypt, Nigeria and Rest)
Key Players / Competitors Profiles Covered in Brief in Global DRAM Market Report in Strategic Perspective:
- Winbond Electronics Corporation
- Samsung Electronics Co., Ltd.
- Powerchip Technology Corporation
- Kingston Technology Corporation
- Integrated Silicon Solution Inc.
- Transcend Information, Inc.
- Micron Technology, Inc.
- Nanya Technology Corporation
- ATP Electronics, Inc.
- SK Hynix Inc.
- Intel Corporation
- Texas Instruments
- Etron Technology Inc.
- Advanced Micro Devices (AMD)
- Elpida Memory
- G.Skill International Enterprise Co., Ltd.
- Team Group Inc.
- ADATA Technology Co., Ltd.
- Corsair Gaming, Inc.
- Elite Semiconductor Microelectronics Technology Inc. (ESMT)
- Alliance Memory, Inc.
- Viking Technology
- Netlist, Inc.
- Smart Modular Technologies
- SMART Global Holdings, Inc.
Frequently Asked Questions
1.What is the projected DRAM Market size and growth rate through 2032?
Ans. The DRAM market reached US$ 126 Bn in 2025. With a 6% CAGR, the DRAM Market revenue will hit US$ 189.46 Bn by 2032.
2. Which region currently leads the DRAM Market Share Analysis in 2026?
Ans. North America dominates the market due to massive data center expansion, while South Korea and China maintain over half of global DRAM chip production.
3. How is High-Bandwidth Memory (HBM) impacting DRAM Industry Growth Drivers?
Ans. Surging AI infrastructure demand drives DRAM industry growth drivers, as high-performance HBM3E modules command premium pricing and create supply shortages for traditional consumer electronics applications.
4. What are the primary DRAM Market Trends 2026 for mobile devices?
Ans. Transitioning to 5G processors using 5nm technology stimulates DRAM market trends 2026, requiring higher-density, low-power memory to handle rapid data transmission and advanced multitasking.
5. Which technology segment is dominating the DRAM Market Segmentation?
Ans. DDR4 technology leads the DRAM market segmentation due to superior clock rates, lower latency, and 41% reduced voltage compared to legacy DDR3 storage modules.
6. How does cloud computing expansion influence DRAM Market Competitive Landscape?
Ans. Growing cloud service adoption forces the DRAM market competitive landscape to prioritize high-speed, low-power chips that manage data center cooling, backup, and high-density storage requirements.
7. What are the main DRAM Market Restraints affecting future sales?
Ans. High manufacturing costs and recharging-related power consumption act as DRAM market restraints, potentially slowing adoption compared to more energy-efficient alternatives in battery-sensitive mobile sectors.