Cooling Tower Market by Type, Technology, Material,Application and Region - Global Market Size Estimation, Industry-Wide Analysis, Competitive Landscape Assessment & Long-Term Forecast to 2032

4.7%
CAGR (2026-2032)
5.65 USD Bn.
Market Size
328
Report Pages
164
Market Tables

Overview

The Cooling Tower Market size was valued at USD 5.65 Billion in 2025 and the total Cooling Tower revenue is expected to grow at a CAGR of 4.7% from 2025 to 2032, reaching nearly USD 7.79 Billion by 2032.

This growth is fueled by the rising global adoption of energy-efficient cooling solutions, increasing industrial demand for advanced thermal management systems, and the expansion of smart and eco-friendly cooling tower technologies across key sectors such as power generation, HVAC, and manufacturing.

Cooling Tower Market Overview:

The Cooling Tower Market is witnessing strong growth due to the increasing adoption of energy-efficient cooling systems across industrial, commercial, and power generation sectors. Cooling towers play a critical role in optimizing thermal performance and reducing operational costs, making them essential in HVAC systems, petrochemical plants, and manufacturing facilities. Although these systems improve energy efficiency, they often require higher water usage, creating demand for water-saving cooling tower technologies and hybrid cooling solutions.

Rapid technological advancements, such as the integration of IoT-enabled monitoring, digital control systems, and high-efficiency axial fans, are transforming the global cooling tower industry. For instance, innovations in industrial cooling tower design have allowed companies to achieve substantial energy savings—similar to how Novo Nordisk achieved nearly 5 million kWh annual savings through system optimization. Furthermore, increasing investment in eco-friendly materials, closed-circuit cooling designs, and smart cooling tower systems continues to drive market expansion.

With the ongoing push for sustainability, regulatory compliance, and industrial automation, the global cooling tower market size is expected to grow significantly from 2025 to 2032, driven by the rising focus on smart, sustainable, and cost-efficient cooling tower solutions across all major regions.

Cooling Tower Market 2025-2032

To know about the Research Methodology :- Request Free Sample Report

Global Cooling Tower Market Dynamics:

The Cooling Tower Market is witnessing strong growth driven by the rising demand for energy-efficient cooling solutions across industries such as HVAC, power generation, oil & gas, and manufacturing. Increasing industrialization in Asia-Pacific, particularly in China and India, coupled with the expansion of data centers and commercial infrastructure, is fueling the need for advanced industrial cooling tower systems. The shift toward hybrid cooling towers and water-saving cooling technologies is reshaping the market, aligning with global sustainability goals and stringent environmental regulations in Europe and North America.

Technological advancements such as IoT-based monitoring, digital performance analytics, and predictive maintenance systems are enhancing operational efficiency and driving adoption of smart cooling tower solutions. Additionally, the replacement and retrofit market is expanding as industries modernize existing systems to meet new energy standards. However, factors such as high installation costs, corrosion issues, and water scarcity challenges may limit growth in certain regions.

Despite these challenges, the global cooling tower market size is expected to grow significantly during 2025–2032, supported by eco-friendly materials, innovative design improvements, and increasing investment in sustainable industrial cooling systems. These dynamics collectively reinforce the strong growth trajectory of the cooling tower industry worldwide.

Global Cooling Tower Market Segment Analysis

The Global Cooling Tower Market is segmented by Product, and Applications.

Based on the Technology, In 2025, the closed-circuit type category had the biggest market share of xx %. On the other hand, hybrid towers are predicted to take a significant part of the market throughout the forecast period. The benefits of hybrid towers, such as plume abatement, water savings, and effective cooling, are attributed to this. On the other hand, the open-circuit type resulted in a considerable share in 2025 due to the excellent cooling they give. Due to environmental issues such as drift, plume, and water contamination, the segment is likely to increase steadily throughout the forecast period.

Cooling Tower Market by Technology

Based on the Material, Fiber-reinforced plastic (FRP), steel, concrete, wood, and High-Density Polyethylene (HDPE) are some of the materials used in cooling towers (HDPE). Due to many features such as excellent corrosion resistance, cost-effectiveness, and ease of installation, the FRP material segment accounted for the highest percentage in 2025. Steel towers, which are comprised of galvanized and stainless steel, also claimed a significant portion of the market in 2025, owing to their excellent corrosion resistance and structural strength. Following this section is the concrete material section, which is expected to develop considerably due to its extended working life.

Cooling Tower Market by Material

Cooling Tower Market Regional Insights:

Asia Pacific had the greatest market share, accounting for more than xx% of total sales, closely followed by Europe. Furthermore, from 2025 to 2032, the region is expected to be the fastest-growing market for cooling towers, with a CAGR of over xx%. The demand for these towers in Asia Pacific is likely to be driven by the growing number of manufacturing facilities and the growth of the industrial sector.

Asia Pacific continues to lead the Cooling Tower Market in 2025, driven by the region’s expanding focus on nuclear power capacity addition and large-scale industrial development. As of 2025, the region hosts over 140 operational nuclear reactors, with more than 30 reactors under active construction and an additional 60+ reactors in various planning stages, reinforcing the demand for field-erected cooling towers across power generation projects. This surge in energy infrastructure, combined with rapid growth in manufacturing, chemicals, and HVAC installations, is expected to significantly boost cooling tower deployment in the coming years.

In Europe, market growth in 2025 is primarily supported by stringent environmental regulations, energy-efficiency mandates, and the modernization of aging industrial infrastructure. The rise of heavy industries, along with a strong shift toward sustainable cooling technologies, continues to create new opportunities for cooling tower manufacturers and service providers.

Meanwhile, the Middle East & Africa (MEA) region is witnessing steady growth fueled by the expanding oil & gas sector, petrochemical investments, and increasing installation of high-capacity cooling systems in power and desalination plants. These developments collectively position MEA as a promising market for advanced cooling towers during the forecast period.
Cooling Tower Market Growth in APAC, Country Wise Sales Analysis (USD Billion) (2024)
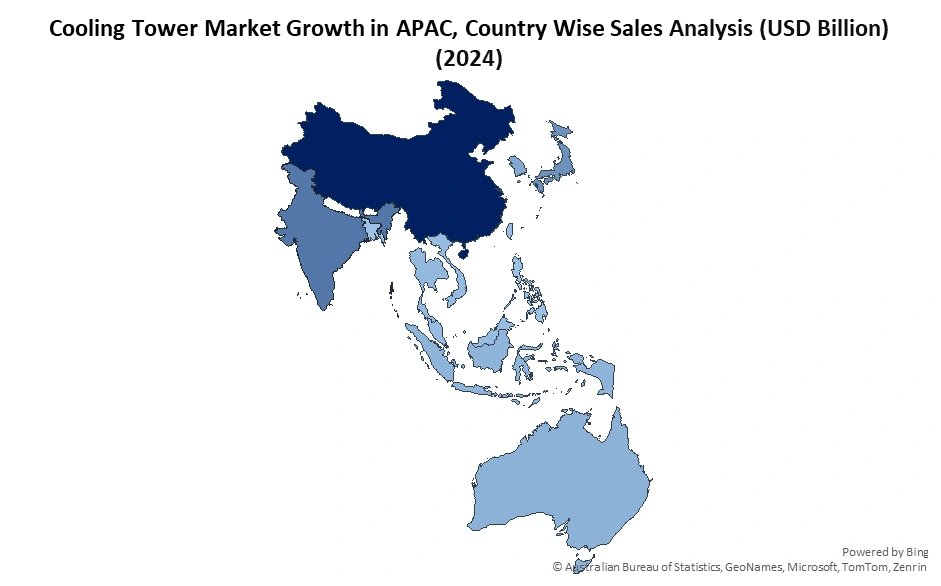
Asia Pacific dominates the global Cooling Tower Market, driven by rapid industrialization, expanding power generation capacity, and large-scale infrastructure development.

Cooling Tower Market Scope: Inquire before buying

Cooling Tower Market
Report Coverage Details
Base Year: 2025 Forecast Period: 2026-2032
Historical Data: 2020 to 2025 Market Size in 2025: 5.65 USD Bn
Forecast Period 2026-2032 CAGR: 4.7% Market Size in 2032: 7.79 USD Bn
Segments Covered: By Type Evaporative
Dry
Hybrid
By Technology Open-Circuit
Closed-Circuit
Hybrid-Circuit
By Material Fiber-Reinforced Plastic (FRP)
Steel
Concrete
Wood
High-Density Polyethylene (HDPE)
By Application HVAC
Power Generation
Oil & Gas
Chemicals & Petrochemicals
Food & Beverage
Paper & Pulp Mills
Others

Cooling Tower Market, by Region

North America (United States, Canada and Mexico)
Europe (UK, France, Germany, Italy, Spain, Sweden, Austria and Rest of Europe)
Asia Pacific (China, South Korea, Japan, India, Australia, Indonesia, Malaysia, Vietnam, Taiwan, Bangladesh, Pakistan and Rest of APAC)
Middle East and Africa (South Africa, GCC, Egypt, Nigeria and Rest of ME&A)
South America (Brazil, Argentina Rest of South America)

Cooling Tower Market, Key Players

1. B&W SPIG (Babcock & Wilcox)
2. Baltimore Aircoil Company (BAC)
3. Cenk Industrial Plants Manufacturing and Contracting
4. Cooling Towers Systems; Inc.
5. Delta Cooling Towers
6. Engie Refrigeration GmbH
7. Hamon & CIE SA
8. Johnson Controls Inc
9. Mesan Cooling Towers Ltd
10. Bell Cooling Tower
11. Brentwood Industries Inc.
12. Enexio
13. Hamon & Cie International SA
14. Paharpur Cooling Towers
15. SPIG S.p.A
16. Star Cooling Towers Private Ltd
17. EVAPCO Inc.
18. SPX Cooling Technologies, Inc.
19. Thermax Limited
20. Mitsubishi Heavy Industries, Ltd.
21. Kelvion Holding GmbH
22. Reymsa Cooling Towers, Inc.
23. Tashin Industry Co., Ltd.
24. Composite Cooling Solutions, L.P. (CCS)
25. Whaley Products, Inc.
26. Advance Cooling Towers Pvt. Ltd.
27. SPX Thermal Product Solutions
28. Superchill Cooling Towers Pvt. Ltd.
29. Torrex Cooling Tower
30. Aeron Cooling Towers Pvt. Ltd.
31. Laxmi Engineering
32. Ceramica Cleia
33. Marley Cooling Technologies
34. Delta T Systems, Inc.
35. Pinnacle Industries Ltd.
36. Towertech Cooling System Pvt. Ltd.

Frequently Asked Questions:

1. Which region has the largest share in the Global Cooling Tower Market?
Ans: Asia Pacific region held the highest share in 2025.

2. What is the growth rate of the Global Cooling Tower Market?
Ans: The Global Cooling Tower Market is expected to grow at a CAGR of 4.7% during the forecast period 2026-2032.

3. What is the scope of the Global Cooling Tower market report?
Ans: Global Cooling Tower Market report helps with the PESTEL, PORTER, Recommendations for Investors & Leaders, and market estimation of the forecast period.

4. Who are the key players in the Global Cooling Tower market?
Ans: The important key players in the Global Cooling Tower Market are – B&W SPIG (Babcock & Wilcox), Baltimore Aircoil Company (BAC), Cenk Industrial Plants Manufacturing and Contracting, Cooling Towers Systems; Inc.

5. What is the study period of this market?
Ans: The Global Cooling Tower Market is studied from 2025 to 2032.

Table of Contents

1. Cooling Tower Market: Executive Summary 1.1. Study Assumption and Market Definition 1.2. Scope of the Study 1.3. Executive Summary 1.3.1 Market Size (2024) & Forecast (2025-2032) 1.3.2 Market Size (USD Million) (Volume in Units ) and Market Share (%) - By Segments, Regions and Country 2. Cooling Tower Market: Competitive Landscapes 2.1. MMR Competition Matrix 2.2. Key Players Benchmarking 2.2.1 Company Name 2.2.2 Business Portfolio 2.2.3 End-User Segment 2.2.4 Revenue (2024) 2.2.5 Profit Margin (%) 2.2.6 Approach in Process 2.2.7 Manufacturing Footprint 2.2.8 Customer Base (Key Clients) 2.2.9 Dealer & Distribution Network 2.2.10 Dominant Revenue Location 2.2.11 Market Share (%) (2024) 2.2.12 Geographical Presence 2.3. Market Structure 2.3.1 Market Leaders 2.3.2 Market Followers 2.3.3 Emerging Players 2.4. Mergers, Acquisitions & Partnerships 2.4.1 Strategic Acquisition Trends 2.4.2 Market Consolidation Activities 2.4.3 Technology Licensing & Co-Development Agreements 2.4.4 Cross-Industry Partnership Models 2.4.5 Investments in Automation & Digital Capabilities 2.4.6 Geographic Expansion Through Joint Ventures 2.4.7 Aftermarket & Service-Focused Alliances 3. Cooling Tower Market: Dynamics 3.1. Cooling Tower Market Trends 3.2. Cooling Tower Market Dynamics 3.2.1 Drivers 3.2.2 Restraints 3.2.3 Opportunities 3.2.4 Challenges 3.3. PORTER’s Five Forces Analysis 3.4. PESTLE Analysis 3.5. Key Opinion Leader Analysis For the Industry 4. Technology, Design & Performance Metrics 4.1 Technology taxonomy: crossflow vs counterflow vs hybrid — performance metrics (cooling capacity kW/ton, approach °C). 4.2 Key components & materials: fills (PVC/PP vs splash), drift eliminators, fans (axial vs centrifugal) — cost and life expectancy. 4.3 Thermal performance benchmarks: L/G ratio, approach, range, blowdown rates — normative tables for design comparison. 4.4 Energy intensity: kWh per TR (ton of refrigeration) and opportunities for reduction. 4.5 Modular vs field-erected: lead times, transport constraints, site-prep metrics. 4.6 Reliability & MTBF/MTTR metrics by design and vendor class. 4.7 Emerging tech: variable-speed drives, CFD-optimised fills, water-saving hybrid systems — quantified impact on OPEX/CAPEX. 5. End-User Industry Analysis & Adoption Patterns 5.1 Demand by end-use (power generation, petrochemicals, HVAC/commercial, data centers, chemical & process industries, municipal) — historic share (%) and growth rates. 5.2 Installed base estimation by industry (units, total MW equivalent) and retirement curves. 5.3 Project pipeline and large-ticket projects (MW, m³/h) with near-term conversion probability. 5.4 Industry-specific buying patterns: OEM vs EPC procurement, tender vs negotiated contracts. 5.5 Retrofit drivers per industry: regulatory, water savings, energy-efficiency targets — measurable retrofit potential. 5.6 Typical service contracts & uptime SLAs by industry and average contract length. 6. Cooling Tower Market: Import and Export Analysis 6.1 Top 10 Importing Countries of Cooling Tower 6.2 Top 10 Exporting Countries of Cooling Tower 6.3 US Tariff's Potential Impact on Major Exporting and Importing Countries of Cooling Tower 7. Supply Chain, Manufacturing & Sourcing Risk 7.1 Raw material exposure: steel, FRP, PVC/PP fills — price volatility indices and % cost contribution. 7.2 Manufacturing footprint: regional production capacity, lead times (weeks), import dependence by region. 7.3 OEM vs local fabricator split and implications for price and delivery. 7.4 Component bottlenecks: fan motors, VFDs, specialized fills — critical path items and alternate sourcing availability. 7.5 Logistics & site constraints: oversized load permits, port handling metrics, inland transport impact on cost/time. 7.6 Inventory & working-capital norms: typical OEM stock levels (weeks) and aftermarket spare-part fill rates. 7.7 Supply-chain risk scoring: geopolitical, trade-tariff impacts, single-source component risks. 8. Pricing, Cost Structure & LCOE-Style Analysis 8.1 Bill of materials cost breakdown (% of unit CAPEX): structure, fan, tower shell, fill, installation. 8.2 Regional price benchmarking: $/TR or $/m³/h by region and tower size class. 8.3 Total cost of ownership (TCO) / lifecycle model: CAPEX + OPEX (energy, water, chemical, maintenance) per 10/15/20 years. 8.4 Energy cost sensitivity: impact on lifecycle cost for +/- electricity price scenarios. 8.5 Maintenance & spare parts cost drivers: annual O&M cost as % of CAPEX and common cost escalation factors. 8.6 Pricing strategies: project-based discounting, long-term service contracts, performance-based pricing (e.g., guaranteed approach). 8.7 Financing models & lease/ESG-based funding impacts on customer adoption. 9. Regulatory, Environmental & Water-Use Considerations 9.1 Water withdrawal, blowdown & drift regulations — compliance cost impact 9.2 Water efficiency metrics — cycles of concentration, blowdown & evaporation 9.3 Chemical usage & disposal compliance — OPEX and regulatory exposure 9.4 Energy efficiency standards & incentives — kWh/TR and lifecycle cost impact 9.5 Environmental risk factors — flood, corrosion & climate stress 9.6 Permits, certifications & environmental approvals — timelines and risks 9.7 GCC & Middle East regulations — demand impact across oil & gas, HVAC, manufacturing & power 9.8 Regional regulatory tightening — sector-wise growth and technology shift in GCC & Middle East 10. Aftermarket, Services & Digitalisation 10.1 Aftermarket revenue pool: spare parts, scheduled maintenance, refurbishment, retrofit services — % of total industry revenue. 10.2 O&M business models: time-and-materials vs fixed-price contracts vs availability/performance guarantees. 10.3 Digital services adoption: remote monitoring penetration (%), predictive-maintenance impact on downtime and cost. 10.4 Spare parts logistics: fulfilment times, hotspot SKUs, commonly stocked items and fill-rate targets. 10.5 Refurbishment economics: cost vs new purchase breakeven, average lifespan extension (years). 10.6 Service margins & contracting norms by geography and customer type. 11. Installation, Commissioning & On-Site Integration Complexity 11.1 Pre-installation assessment metrics: foundation load, footprint, plume dispersion, noise limits. 11.2 Installation time benchmarks by tower size: field-erected vs factory-assembled (weeks, manpower). 11.3 Commissioning procedures and KPIs: approach temperature, drift loss, vibration level, fan power. 11.4 Integration with cooling water circuits: pump head requirement, hydraulic losses, piping layout factors. 11.5 Plume abatement and drift-control installation challenges. 12 Environmental Impact Lifecycle Analysis (LCA) 12.1 Cradle-to-grave carbon footprint of cooling tower materials (FRP, steel, PVC). 12.2 Energy consumption impact over operational lifetime (kWh/TR-year). 12.3 Water lifecycle burden: annual freshwater withdrawal and reduction potential. 12.4 Waste and discharge footprint: blowdown quality, silica scaling disposal, chemical toxicity. 12.5 Comparative LCA of different cooling technologies: wet vs hybrid vs dry. 12.6 End-of-life recycling feasibility and material recovery rates. 12.7 Environmental cost externalities monetised into LCOE-like metrics. 13. Water Management, Treatment Strategies & Chemical Consumption Modelling 13.1 Water consumption modelling: evaporation, drift, blowdown volumes (m³/day). 13.2 Cycles of concentration optimisation: cost vs water savings trade-off. 13.3 Typical maintenance frequency pump servicing, coalescing media replacement, sludge extraction. 13.4 Spare parts ecosystem: pumps, valves, skimmers, filters, sensors, alarms 13.5 AMC models and their impact on long-term operating cost. 13.6 Reliability analysis failure modes by product type (gravity vs coalescing vs hydrocyclone). 13.7 Operator training requirements in industrial vs marine environments. 13.8 Comparison of proactive vs reactive maintenance strategies. 13.9 Service availability gaps in remote marine, defense, and industrial locations 14. Global Cooling Tower Market Size and Forecast by Segmentation (by Value in USD Million) (2024-2032) 14.1. Global Cooling Tower Market Size and Forecast, By Type (2024-2032) 14.1.1 Evaporative 14.1.2 Dry 14.1.3 Hybrid 14.2. Global Cooling Tower Market Size and Forecast, By Technology (2024-2032) 14.2.1 Open-Circuit 14.2.2 Closed-Circuit 14.2.3 Hybrid-Circuit 14.3. Global Cooling Tower Market Size and Forecast, By Material (2024-2032) 14.3.1 Fiber-Reinforced Plastic (FRP) 14.3.2 Steel 14.3.3 Concrete 14.3.4 Wood 14.3.5 High-Density Polyethylene (HDPE) 14.4. Global Cooling Tower Market Size and Forecast, By Application (2024-2032) 14.4.1 HVAC 14.4.2 Power Generation 14.4.3 Oil & Gas 14.4.4 Chemicals & Petrochemicals 14.4.5 Food & Beverage 14.4.6 Paper & Pulp Mills 14.4.7 Others 14.5. Global Cooling Tower Market Size and Forecast, By Region (2024-2032) 14.5.1 North America 14.5.2 Europe 14.5.3 Asia Pacific 14.5.4 Middle East and Africa 14.5.5 South America 15. North America Cooling Tower Market Size and Forecast by Segmentation (by Value in USD Million) (2024-2032) 13.1. North America Cooling Tower Market Size and Forecast, By Type (2024-2032) 15.2. North America Cooling Tower Market Size and Forecast, By Technology (2024-2032) 15.3. North America Cooling Tower Market Size and Forecast, By Material (2024-2032) 15.4. North America Cooling Tower Market Size and Forecast, By Application(2024-2032) 15.5. North America Cooling Tower Market Size and Forecast, By Country (2024-2032) 15.5.1 United States 15.5.2  United States Cooling Tower Market Size and Forecast, By Type (2024-2032) 15.5.3  United States Cooling Tower Market Size and Forecast, By Technology (2024-2032) 15.5.4  United States Cooling Tower Market Size and Forecast, By Material (2024-2032) 15.5.5  United States Cooling Tower Market Size and Forecast, By Application(2024-2032) 15.5.6 Canada 15.5.7 Mexico 16. Europe Cooling Tower Market Size and Forecast by Segmentation (by Value in USD Million) (2024-2032) 16.1. Europe Cooling Tower Market Size and Forecast, By Type (2024-2032) 16.2. Europe Cooling Tower Market Size and Forecast, By Technology (2024-2032) 16.3. Europe Cooling Tower Market Size and Forecast, By Material (2024-2032) 16.4. Europe Cooling Tower Market Size and Forecast, By Application(2024-2032) 16.5. Europe Cooling Tower Market Size and Forecast, By Country 16.5.1 United Kingdom 16.5.2 France 16.5.3 Germany 16.5.4 Italy 16.5.5 Spain 16.5.6 Sweden 16.5.7 Russia 16.5.8 Rest of Europe 17. Asia Pacific Cooling Tower Market Size and Forecast by Segmentation (by Value in USD Million) (2024-2032) 17.1. Asia Pacific Cooling Tower Market Size and Forecast, By Type (2024-2032) 17.2. Asia Pacific Cooling Tower Market Size and Forecast, By Technology (2024-2032) 17.3. Asia Pacific Cooling Tower Market Size and Forecast, By Material (2024-2032) 17.4. Asia Pacific Cooling Tower Market Size and Forecast, By Application(2024-2032) 17.5. Asia Pacific Cooling Tower Market Size and Forecast, By Country (2024-2032) 17.5.1 China 17.5.2 South Korea 17.5.3 Japan 17.5.4 India 17.5.5 Australia 17.5.6 Indonesia 17.5.7 Philippines 17.5.8 Malaysia 17.5.9 Vietnam 17.5.10 Thailand 17.5.11 Rest of Asia Pacific 18. Middle East and Africa Cooling Tower Market Size and Forecast by Segmentation (by Value in USD Million) (2024-2032) 18.1. Middle East and Africa Cooling Tower Market Size and Forecast, By Type (2024-2032) 18.2. Middle East and Africa Cooling Tower Market Size and Forecast, By Technology (2024-2032) 18.2.1 South Africa 18.2.2 GCC 18.2.3 Egypt 18.2.4 Nigeria 18.2.5 Rest of ME&A 19. South America Cooling Tower Market Size and Forecast by Segmentation (by Value in USD Million) (2024-2032) 19.1. South America Cooling Tower Market Size and Forecast, By Type (2024-2032) 19.2. South America Cooling Tower Market Size and Forecast, By Technology (2024-2032) 19.3. South America Cooling Tower Market Size and Forecast, By Material (2024-2032) 19.4. South America Cooling Tower Market Size and Forecast, By Application(2024-2032) 19.5. South America Cooling Tower Market Size and Forecast, By Country (2024-2032) 19.5.1 Brazil 19.5.2 Argentina 19.5.3 Peru 19.5.4 Colombia 19.5.5 Rest Of South America 20. Company Profile: Key Players 20.1. B&W SPIG (Babcock & Wilcox) 20.1.1 Company Overview 20.1.2 Business Portfolio 20.1.3 Financial Overview 20.1.4 SWOT Analysis 20.1.5 Strategic Analysis 20.1.6 Recent Developments 20.2. Baltimore Aircoil Company (BAC) 20.3. Cenk Industrial Plants Manufacturing and Contracting 20.4. Cooling Towers Systems Inc. 20.5. Delta Cooling Towers 20.6. Engie Refrigeration GmbH 20.7. Hamon & CIE SA 20.8. Johnson Controls Inc 20.9. Mesan Cooling Towers Ltd 20.10. Bell Cooling Tower 20.11. Brentwood Industries Inc. 20.12. Enexio 20.13. Hamon & Cie International SA 20.14. Paharpur Cooling Towers 20.15. SPIG S.p.A 20.16. Star Cooling Towers Private Ltd 20.17. EVAPCO Inc. 20.18. SPX Cooling Technologies, Inc. 20.19. Thermax Limited 20.20. Mitsubishi Heavy Industries, Ltd. 20.21. Kelvion Holding GmbH 20.22. Reymsa Cooling Towers, Inc. 20.23. Tashin Industry Co., Ltd. 20.24. Composite Cooling Solutions, L.P. (CCS) 20.25. Whaley Products, Inc. 20.26. Advance Cooling Towers Pvt. Ltd. 20.27. SPX Thermal Product Solutions 20.28. Superchill Cooling Towers Pvt. Ltd. 20.29. Torrex Cooling Tower 20.30. Aeron Cooling Towers Pvt. Ltd. 20.31. Laxmi Engineering 20.32. Ceramica Cleia 20.33. Marley Cooling Technologies 20.34. Delta T Systems, Inc. 20.35. Pinnacle Industries Ltd. 20.36. Towertech Cooling System Pvt. Ltd. 21. Key Findings 22. Analyst Recommendations 23. Cooling Tower Market: Research Methodology

Custom Market Research Services

We Will Customise The Research For You, In Case The Report Listed Above Does Not Meet With Your Requirements