
Cleanroom Lighting Market by Offering, Mounting Type, Light Source, End-User and Region – Global Market Size Estimation, Industry-Wide Analysis, Competitive Landscape Assessment & Long-Term Forecast to 2034
Overview
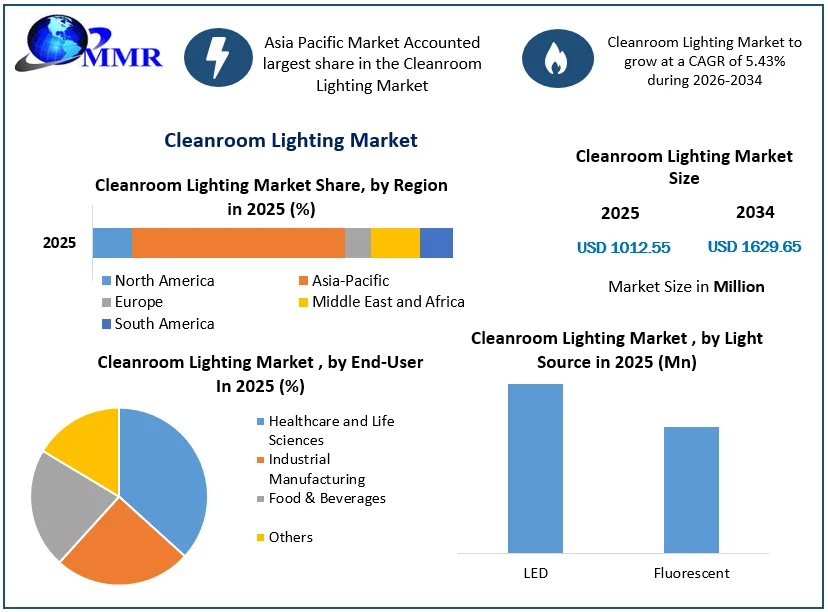
The Global Cleanroom Lighting Market size was valued at USD 1012.55 Mn in 2025, and the total Cleanroom Lighting Market revenue is expected to grow by 5.43% from 2026 to 2034, reaching nearly USD 1629.65 Mn.
Cleanroom Lighting Market Overview
The Cleanroom Lighting Market focuses on specialized lighting solutions designed for controlled environments such as laboratories, pharmaceutical manufacturing facilities, and microchip fabrication plants. Cleanrooms are essential for maintaining strict control over airborne contaminants, with quantitative particle counts ensuring the necessary hygiene standards for critical processes. In this market, lighting solutions feature sealed fixtures and smooth surfaces to prevent particle accumulation and ensure light stability without contaminating the environment. The design of cleanroom lighting considers airflow patterns to work in harmony with air filtration systems, minimizing particle emissions and supporting overall air quality management.
The Cleanroom Lighting Market is experiencing substantial growth due to increasing demand for regulatory compliance in highly controlled environments. Industries such as pharmaceuticals, biotechnology, semiconductor manufacturing, food processing, and healthcare are driving adoption. Products in this market meet stringent industry standards with features like sealed enclosures, antimicrobial finishes, low particulate emissions, and high ingress protection (IP) ratings to maintain sterilization and environmental integrity.
Advancements in technology are reshaping the Cleanroom Lighting Market, with Industry 4.0 and smart building integration introducing LED-based lighting, automated controls, IoT connectivity, and human-centric lighting (HCL). These innovations enhance energy efficiency, workflow safety, and employee comfort. The market also benefits from the adoption of smart sensors, occupancy detection, and dimmable lighting systems, which enable customized performance and long-term cost savings.
The Cleanroom Lighting Market has further accelerated following the COVID-19 era, driven by healthcare infrastructure expansion, the growth of semiconductor fabrication facilities, and the increasing use of cleanrooms in advanced manufacturing. Rising hygiene requirements, stability targets, and government-mandated safety standards have boosted investments in cleanroom infrastructure. Strong growth is being recorded in regions such as Asia-Pacific, North America, and Western Europe, where pharmaceutical R&D, electronics manufacturing, and food safety regulations are major economic growth drivers.
Cleanroom Lighting Market Snapshot
To know about the Research Methodology:-Request Free Sample Report
Cleanroom Lighting Market Dynamics
Global Shift Toward Smart Building Systems to Drive Cleanroom Lighting Market Growth
The smart building systems are expected to drive an integration of cleanroom lighting across the globe. Smart systems allow for real-time monitoring and adjustments to cleanroom lighting. Smart building systems are gaining traction worldwide. Cleanroom facilities will benefit from significant energy savings and optimized lighting usage. An adoption of smart-integrated cleanroom lighting is expected to promote more consistent and standardized practices across the globe. It represents a significant leap forward in creating a more efficient, sustainable, and worker-friendly environment within cleanroom facilities. The number of smart buildings worldwide is projected to reach 115 million in 2026, an increase of more than 150%. More than 90% of smart building spending is expected to go to non-residential properties across in 2026. Manufacturers are expected to invest more in developing cleanroom lighting systems compatible with and optimized for smart building integration. The smart building systems unlock new possibilities for optimizing cleanroom operations, minimizing energy consumption, and ensuring a cleaner and more productive work environment for workers.
Advancements in LED Solutions to Create Cleanroom Lighting Market Opportunity
Technology advancement in the cleanroom lighting is one of the key drivers behind the cleanroom lighting market growth. It is driven by the integration of cutting-edge technologies, innovations in design, and a focus on sustainability. LEDs held the dominant position in the cleanroom lighting market. It has lower energy consumption compared to fluorescents, which is leading to substantial cost savings. It has a much longer lifespan compared to fluorescents. This translates to fewer replacements needed, minimizing maintenance disruptions and the associated risks of contamination during changeovers in the critical cleanroom environment. LEDs emit minimal heat, which helps to reduce heat output, benefits cleanroom operations with the help of less strain on cooling systems and minimized risk of particle generation from heat-induced air circulation. LEDs are free of mercury, a hazardous element present in fluorescent lamps, which eliminates environmental concerns associated with disposal and promotes a more sustainable lighting solution.
ISO 14644 and GMP Guidelines to Drive Cleanroom Lighting Market Growth
The cleanroom lighting market is influenced by regulations set by various international, regional, and national bodies. It aims to ensure a contaminant-free environment crucial for industries like pharmaceuticals, microelectronics, medical device manufacturing, and food processing. The International Organization for Standardization sets global standards for cleanroom classification based on airborne particle concentration. It ISO 14644 series specifies minimum air cleanliness levels for different ISO Classes. The US Department of Health and Human Services sets regulations for cleanroom environments in the context of Good Manufacturing Practices (GMP) for pharmaceuticals under the Food and Drug Administration (FDA). Minimum illumination levels are specified based on the cleanroom classification (ISO Class) and the tasks performed within the cleanroom. The MMR covers the detailed analysis of the regulatory landscape in the cleanroom lighting market in the final report.
Cleanroom Lighting Market Segment Analysis
Based on the Light Source, the Cleanroom Lighting Market is segmented into LED and Fluorescent. The LED segment dominated the Cleanroom Lighting Market in 2025. LEDs offer significantly lower energy consumption and translate to substantial cost savings on electricity bills for cleanroom facilities. LEDs typically have a lifespan of 50,000 hours or more, over 20,000-30,000 hours for fluorescent lights. It reduces maintenance frequency and minimizes contamination risks associated with replacing fixtures within the cleanroom environment. LEDs are providing a more accurate representation of colours crucial for visual tasks like inspection and quality control in cleanrooms.
The LED segment held the dominant share in the global cleanroom lighting market with a share of 80%. The LED segment is forecasted to observe strong growth owing to its capacity to provide energy efficiency and longer operational life. Over the most recent couple of years, the challenges to limit energy consumption have broadly acquired ubiquity across different end-use sectors. The fluorescent segment is probably going to confront obstacles as fluorescent-based lights are omnidirectional and have a more limited life span compared with their counterparts. Accordingly, challenges related to the operational nature of fluorescent light are probably going to restrain the growth of the segments during the forecast period.
By Mounting Type, the Cleanroom Lighting market is segmented into recessed and surface. The recessed segment dominated the Cleanroom Lighting Market in 2025. Recessed mounted lighting fixtures are installed as flush with the ceiling as possible. When mounted in a recessed manner, lighting fixtures do not obstruct the ceiling plane. Lights that were not flush caused points that could attract what is otherwise called the "dust pool. The less fixture surface area that is exposed, the less chance of dust and particles collecting on the fixture itself. Recessed fixtures can be mounted in such a manner as not to provide shadows along the cleanroom aisle ways. These are used for small pre-manufactured cleanrooms.
The recessed-mounted fixtures have recessed spaces below the ceiling plane with open tops and an acrylic louver instead of the lens in order to operate as a lighting fixture and air delivery module. These are used in the restrictive class of cleanrooms with air supply modules furnished, and the ceiling area must be compartmentalized. In 2025, the recessed segment was utilized more so than the surface type, with a 61.70% share of the global cleanroom lighting market. The recessed lighting mounting type is attractive and is infinitely better than surface mounting in terms of ergonomics. The installation costs intertwined with the high new installation costs will pose a barrier to market growth during the time period considered.
The surface mount segment held a 38.29% share in the global cleanroom lighting market. The segment offers easy installation and is viewed as less energy-intensive when compared to its counterpart. The simplicity in activity and support of the surface mount segment is probably going to push the segment's growth during the forecast period. Surface mount fixtures are easier and less complex to install than recessed ones, that is resulting in lower upfront costs. Surface mount fixtures are readily accessible for cleaning, repair, or replacement, minimizing disruption to the cleanroom environment.
Cleanroom Lighting Industry Ecosystem

Cleanroom Lighting Market Regional Analysis
The Asia Pacific segment is expected to grow at a CAGR of xx% during the forecast period. Several biopharmaceutical companies and medical device manufacturers are expanding their presence in the Asia Pacific owing to cost advantage and a favourable regulatory environment in this region. Countries as China, Japan, South Korea, India, Taiwan, Australia, and Singapore are expected to be the major contributors to the cleanroom lighting market in the Asia Pacific. China is a huge market for cleanroom lighting, and it would continue to remain the largest market for cleanroom lighting in the Asia Pacific during the forecast period. China dominates the semiconductor manufacturing industry, and this growth is attributed to the country’s rising wafer fab equipment spending.
Cleanroom Lighting Market Competitive Landscape:
In the competitive scenario of the infrastructure of cleanroom lighting and sterile environment, NV. (Netherlands) and Kenall Manufacturing (USA) reflect two global leaders with separate strategic powers.
Philips Lighting in the east signifies, provides a broad and scalable portfolio of LED cleanroom luminaires under its Philips Cleanroom Series. These fixtures correspond to the standards of ISO Class 1-9 and are integrated with connected lighting platforms such as Interact, which enable real-time monitoring, energy efficiency, and centralized control. With strong penetration in pharmaceuticals, electronics, and food fields, the focus of signal in smart, durable lighting is the focus, and there are fast expansion footprints in the Asia-Pacific and Europe.
In contrast, Kenall Manufacturing, headquartered in the U.S., is an expert in cleanroom lighting providers, known for high-performance solutions such as MedMaster and SimpleSeal Series. It is sewn to the GMP, USP, and ISO environment, which offers extraordinary durability, ingress protection and antimicrobial coatings. Customizable, rugged cleanrooms, lighting and compliance-operated environments for Kenall healthcare, biotech and life sciences lead to Excel where regulatory accuracy and product lifespan are important.
While global levels, connected solutions, and digital controls dominate, Kenall's technical expertise, American regulatory expertise, and effectively compete through project-specific adaptation-especially in North American Health Services and Pharmaceutical areas.
Cleanroom Lighting Market Key Developments:
| Date | Company | Development | Impact |
|---|---|---|---|
| 24 July 2025 | Kenall Manufacturing | The company expanded its healthcare and containment portfolios by introducing the MedMaster Flair next-generation lighting fixture. | This design raises industry benchmarks for controlled healing environments by seamlessly combining physical durability with architectural aesthetics. |
| 30 October 2025 | Kenall Manufacturing | The company rolled out an advanced upgrade to its Indigo-Clean CSEDOIC cleanroom luminaire, embedding patented KORE Technology. | This technology delivers continuous, automated whole-room environmental disinfection while dramatically improving visual comfort through enhanced glare and contrast control. |
| 30 October 2025 | Kenall Manufacturing | The manufacturer officially added an optional IP65 certification to IEC 60598 standards for its SimpleSeal CSSGI cleanroom lighting series. | This upgrade provides superior protection against liquid ingress and particulate contamination, meeting rigid criteria for demanding industrial and scientific environments. |
| 15 January 2026 | Access Fixtures | The provider launched the OTOK LED High Bay Light, a precision-engineered, low-glare linear luminaire optimized for clean tech assembly and production environments. | The field-configurable design eliminates dark spots and glare, maximizing worker safety and operational yield in high-precision contamination-controlled workspaces. |
| 03 February 2026 | Kenall Manufacturing | The brand unveiled the SimpleSeal CSSETO top-access troffer series, tailored for cleanrooms utilizing composite modular ceilings and walkable plenum spaces. | Equipped with dual-side serviceability and an independently sealed IP66 chamber, it allows technical teams to execute seamless maintenance from the top plenum without disrupting continuous sterile operations below. |
| 12 May 2026 | BASF | The chemical giant launched a high-efficiency, low-carbon light-conversion yellow LED solution engineered explicitly for photolithography cleanrooms in microelectronics and semiconductor fabrication. | By shifting harmful short wavelengths into usable light rather than filtering them out, this innovation slashes cleanroom energy consumption by up to 50% compared to traditional yellow fluorescent tubes. |
Cleanroom Lighting Market Key Trends:
Strategic leadership shift drives industry development
The appointment of experienced officers such as Keith Eagle for senior roles in major light companies focuses on the strong leadership of the industry to navigate developed markets and drive innovation.
Continuous emphasis on business development and channel expansion
Lighting companies are giving priority to business development and deepening relations with major stakeholders, indicating a strategic push to expand market access and extend new light technologies.
Cleanroom Lighting Market Scope: Inquire before buying
| Cleanroom Lighting Market | |||
|---|---|---|---|
| Report Coverage | Details | ||
| Base Year: | 2025 | Forecast Period: | 2026-2034 |
| Historical Data: | 2020 to 2025 | Market Size in 2025: | USD 1012.55 Mn. |
| Forecast Period 2026 to 2034 CAGR: | 5.43% | Market Size in 2034: | USD 1629.65 Mn. |
| Segments Covered: | by Offering | Software Hardware Services |
|
| by Mounting Type | Recessed Surface Mount |
||
| by Light Source | LED Fluorescent |
||
| by End-User | Healthcare and Life Sciences Industrial Manufacturing Food & Beverages Others |
||
Cleanroom Lighting Market, by Region
North America (United States, Canada and Mexico)
Europe (UK, France, Germany, Italy, Spain, Sweden, Austria and the Rest of Europe)
Asia Pacific (China, South Korea, Japan, India, Australia, Indonesia, Malaysia, Vietnam, Taiwan, Bangladesh, Pakistan and the Rest of APAC)
Middle East and Africa (South Africa, GCC, Egypt, Nigeria and the Rest of ME&A)
South America (Brazil, Argentina, Rest of South America)
Cleanroom Lighting Market Key Players
North America
1. Terra Universal
2. Kenall Manufacturing
3. Eagle Lighting
4. Acuity Brands Inc.
5. Bukas Lighting Group
6. iWorks
Europe
1. Signify (Philips Lighting)
2. Eaton
3. LUG Light Factory
4. Isoone – Cleanroom Lighting
5. Hilclare Ltd
6. Linder AG
7. Astra Lighting
8. Solite Europe
Asia
1. Wipro Consumer Care and Lighting
2. Paramount Industries
3. Havells India
4. Lumax Lighting
5. Ledspan Ltd.
6. Yardley
Frequently Asked Questions
1. Which regions are leading in the adoption of Cleanroom Lighting?
Ans: The Asia Pacific region held the dominant position in the adoption of cleanroom lighting.
2. What trends are shaping the future of the Cleanroom Lighting market?
Ans. Emerging trends in the Integration with Smart Building Systems, Advanced Lighting Controls, Growing Demand for Regulatory Compliance and the Rise of Prefabricated Cleanroom Solutions.
3. What is the projected market size & and growth rate of the Cleanroom Lighting Market?
Ans. The Cleanroom Lighting Market size is expected to grow at a CAGR of 5.43% from 2026 to 2034, reaching nearly USD 1629.65 Million in 2034.
4. What segments are covered in the Cleanroom Lighting Market report?
Ans. The segments covered in the Cleanroom Lighting Market report are Light Source, Mounting Type, End User and Offering.
5. How do market dynamics such as supply and demand fluctuations affect Cleanroom Lighting prices?
Ans: Limited availability of high-quality Mounting Types, fluctuations in consumer demand, influenced by factors such as economic conditions, consumer confidence, cost of production and currency fluctuations, are expected to impact prices, leading to volatility in the Cleanroom Lighting market.