Ancillary Services Power Market by Type , Service and Region – Global Market Size Estimation, Industry-Wide Analysis, Competitive Landscape Assessment & Long-Term Forecast to 2032

25.6%
CAGR (2026-2032)
2.78 USD Bn.
Market Size
310
Report Pages
148
Market Tables

Overview

The Ancillary Services Power Market size was valued at USD 2.78 Billion in 2025 and the total Ancillary Services Power revenue is expected to grow at a CAGR of 25.6% from 2026 to 2032, reaching nearly USD 13.69 Billion.

Ancillary Services Power Market Overview

Ancillary services play a crucial role in electric power systems by ensuring the operational reliability of the bulk power system. Despite constituting a relatively small portion of overall electric power costs, these services are essential. Moreover, in certain regions, the nature and requirements of these services are evolving. In the ancillary services power industry, the services are recognized as a set of secondary services provided to enhance the reliability and availability of energy for consumers. These services encompass regulation, spinning reserve, supplemental reserve, voltage regulation, black-start, and various other functionalities. As per the study, the market is expected to grow rapidly during the forecast period.Ancillary Services Power Market
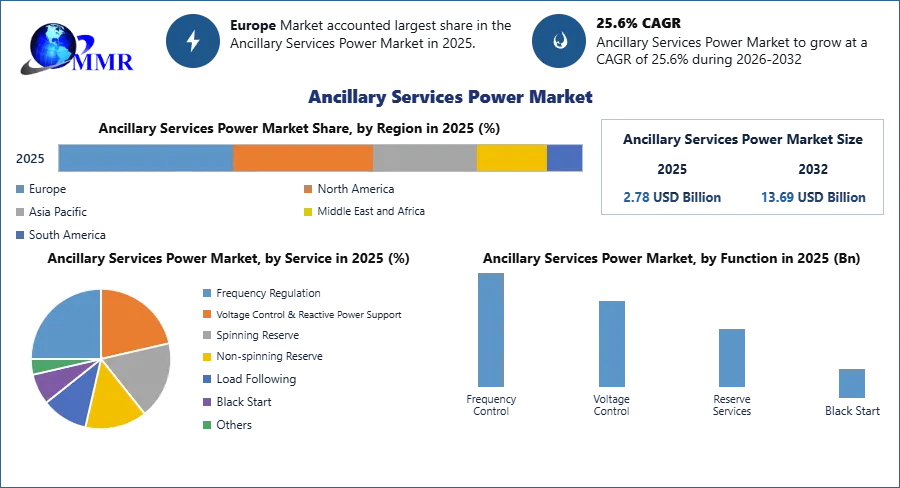
To know about the Research Methodology :- Request Free Sample Report

Ancillary Services Power Market Dynamics

Electrification of Transportation Driving the Ancillary Services Power Market

Ancillary services are addressing the increase in electricity demand from charging infrastructure and ensuring the grid's ability to handle the unique load profiles associated with the huge adoption of EVs. In the global shift toward electrified transportation, the incorporation of microgrids takes on heightened importance. The increasing popularity of electric vehicles (EVs) is attributed to their environmental advantages and the potential to mitigate greenhouse gas emissions. Implementing energy storage solutions, such as lithium-ion batteries, offers a valuable means to alleviate the inherent intermittency associated with renewable energy sources, fostering a seamless integration of variable generation. These systems are adept at storing surplus energy generated during peak production periods and releasing it during high-demand intervals, effectively lessening the strain on the power grid. These benefits and the adoption of electrification in transportation are majorly driving the growth of the Ancillary Services Power Market.

Cities across the world are increasingly prioritizing sustainable mobility solutions to address congestion, air quality issues, and the overall liveability of urban areas. The electrification of transportation majorly aligns with these goals, and urban planning initiatives are highly integrating electric public transport, shared mobility services, and charging infrastructure.


Grid Modernization Initiatives Creating Opportunities for the Ancillary Services Power Market Growth

The ongoing grid modernization efforts include the deployment of smart grid technologies. Ancillary services play a crucial role in supporting the implementation of modern grid infrastructure, which enables better communication, control, and optimization of power system operations. For example – the Grid Modernization Initiative (GMI) collaborates throughout the U.S. Department of Energy (DOE) to establish a future-ready grid system. DOE invested USD 39 million to support the 21st-century electric grid. These efforts and initiatives are majorly creating opportunities for the ancillary services power market growth in the future.

Energy Storage Costs Challenging the Ancillary Services Power Market

The upfront capital investment is required for the deployment of energy storage systems, especially advanced technologies such as lithium-ion batteries. The challenge also lies in convincing stakeholders that the long-term benefits and enhanced grid performance associated with energy storage justify the initial investment. This challenge limits the growth of the ancillary services power market especially in regions where traditional alternatives are deeply entrenched. The energy storage technologies costs are subject to variability, which are majorly influenced by factors such as raw material prices, manufacturing processes, and economies of scale. This variability introduces uncertainty for investors and industry participants, which creates challenges for the prediction and planning of the long-term cost-effectiveness of energy storage solutions.

Ancillary Services Power Market Segment Analysis

Based on Type: The market is segmented into Frequency Controlled Ancillary Services and Network Controlled Ancillary Services. The Frequency Controlled Ancillary Services segment held the largest Ancillary Services Power Market share in 2025. The frequency-controlled ancillary services are used to maintain the desired frequency by balancing load and power generation in real time. There are three levels of frequency control such as primary frequency control, secondary response, and tertiary frequency control. Increasing demand for electric devices and electric appliances creates a variable load on the power supply, which results in fluctuation in frequencies. The innovations in frequency-controlled ancillary services are driving the market growth at a high CAGR in the forecast period.

Based on Service: The market is segmented into Voltage Control and Reactive Power Support, Black Start, Operating Reserve, Load Following, Regulation Service, and Other Services. The Black Start segment is expected to grow rapidly during the forecast period. The black start is used in hydroelectric power plants, compressed air storage power plants, or gas power plants. These plants can generate a large amount of energy but to start the generation of power they need an external power source. The black start is used in this power plant to start up autonomously without an external power supply. The growth of energy generation and rising power demand are driving the growth of black start in the ancillary services power market.

Ancillary Services Power Market Regional Insights

European Ancillary Services Power Market dominated the global market with the largest share in 2025. Wind power generators are providing balancing services in European countries. Wind variability and uncertainty increase the balancing costs by approximately 1.22 – 5.47 US$/MWh. Wind energy penetrations serve up to 20% of energy demand in Europe. The growth of renewable power generation is driving the growth of the ancillary services power market. Solar and wind power generation are expected to grow rapidly during the forecast period. The growth of energy demand and increasing production of energy generation systems are driving the market growth in the region.

North American Ancillary Services Power Market is expected to grow at a high rate during the forecast period. The regional market operates within a regulatory framework that varies across jurisdictions. In the US, the Federal Energy Regulatory Commission (FERC) plays a crucial role in overseeing wholesale electricity markets, including ancillary services. In the region, Regional Transmission Organizations (RTOs) and Independent System Operators (ISOs) coordinates and manage grid operations, which also contributes to the market structure. In the US, the distribution and grid modernization is also contributing to the market growth. The planning for state for distribution and grid modernization includes:

1. Support DER integration and utilization for grid services
2. Increase customer choice and engagement in energy services
3. Reduce greenhouse gas emissions and support a clean energy transition
4. Improve grid resilience
5. Accelerate deployment of new technologies and services to optimize grid performance and minimize electricity system costs

Recent Industry Developments

Exact Date Company Development Impact
12 March 2026 Siemens AG Launched the Grid-Scale Stability Suite 2.0, featuring enhanced AI-driven synthetic inertia for grids with over 80% renewable penetration. The system significantly reduces frequency deviation during rapid solar drops, providing utilities with a reliable alternative to traditional spinning reserves.
04 February 2026 NextEra Energy, Inc. Commenced operations at a 500 MW battery storage facility specifically contracted to provide fast frequency response (FFR) services. This facility strengthens regional grid reliability and enables the further integration of utility-scale wind assets into the merchant power market.
18 January 2026 Schneider Electric SE Announced a strategic partnership with a major European TSO to deploy digital twin technology for real-time reactive power management across cross-border interconnectors. This collaboration optimizes voltage stability and reduces transmission losses in high-complexity multi-national energy corridors.
15 November 2025 ABB Ltd. Unveiled a new STATCOM (Static Synchronous Compensator) series designed for offshore wind hubs to ensure dynamic voltage support. The deployment is expected to improve power quality and facilitate compliance with stringent new grid code requirements for renewable offshore projects.
22 September 2025 National Grid plc Implemented a new market-based procurement mechanism for Black Start services, prioritizing distributed energy resources over traditional fossil-fuel plants. The shift lowers system restoration costs and encourages private investment in small-scale flexible power assets.
14 May 2025 General Electric Company Successfully tested its Grid-Forming Inverter technology at a commercial scale, delivering voltage and frequency support without external grid reference. This breakthrough enhances the resilience of microgrids and remote power systems during total grid outages or extreme weather events.

Ancillary Services Power Market Scope : Inquire before buying

Ancillary Services Power Market
Report Coverage Details
Base Year: 2025 Forecast Period: 2026-2032
Historical Data: 2020 to 2025 Market Size in 2025: 2.78 USD Billion
Forecast Period 2026-2032 CAGR: 25.6% Market Size in 2032: 13.69 USD Billion
Segments Covered: by Function Frequency Control
Voltage Control
Reserve Services
Black Start
by Service Frequency Regulation
Voltage Control & Reactive Power Support
Spinning Reserve
Non-spinning Reserve
Load Following
Black Start
Others
by End-user Transmission System Operators
Distribution System Operators
Utilities
Independent Power Producers

Ancillary Services Power Market, by Region

North America (United States, Canada and Mexico)
Europe (UK, France, Germany, Italy, Spain, Sweden, Austria and Rest of Europe)
Asia Pacific (China, South Korea, Japan, India, Australia, Indonesia, Malaysia, Vietnam, Taiwan, Bangladesh, Pakistan and Rest of APAC)
Middle East and Africa (South Africa, GCC, Egypt, Nigeria and Rest of ME&A)
South America (Brazil, Argentina Rest of South America)

Key Players / Competitors Profiles Covered in Brief in Global Ancillary Services Power Market Report in Strategic Perspective:

  1. New York Independent System Operator
  2. Independent Electricity System Operator
  3. Midcontinent Independent System Operator, Inc.
  4. Electric Reliability Council of Texas
  5. Southwest Power Pool, Inc.
  6. Snowy Hydro Limited
  7. PJM Interconnection
  8. Elia Group
  9. Transelectrica SA
  10. Alberta Electric System Operator
  11. General Electric Company
  12. Siemens AG
  13. ABB Ltd.
  14. Schneider Electric SE
  15. National Grid plc
  16. NextEra Energy, Inc.
  17. Duke Energy Corporation
  18. Mitsubishi Electric Corporation
  19. Eaton Corporation plc
  20. Enel SpA
  21. Hitachi Energy
  22. Dominion Energy, Inc.
  23. RWE AG
  24. Iberdrola, S.A.
  25. EDF Energy

Table of Contents

1. Ancillary Services Power Market Introduction
1.1. Study Assumption and Market Definition
1.2. Scope of the Study
1.3. Executive Summary
2. Global Ancillary Services Power Market: Competitive Landscape
2.1. MMR Competition Matrix
2.2. Competitive Landscape
2.3. Key Players Benchmarking
2.3.1. Company Name
2.3.2. Business Segment
2.3.3. End-user Segment
2.3.4. Revenue (2025)
2.3.5. Company Locations
2.4. Leading Ancillary Services Power Market Companies, by market capitalization
2.5. Market Structure
2.5.1. Market Leaders
2.5.2. Market Followers
2.5.3. Emerging Players
2.6. Mergers and Acquisitions Details
3. Ancillary Services Power Market: Dynamics
3.1. Ancillary Services Power Market Trends by Region
3.1.1. North America Ancillary Services Power Market Trends
3.1.2. Europe Ancillary Services Power Market Trends
3.1.3. Asia Pacific Ancillary Services Power Market Trends
3.1.4. Middle East and Africa Ancillary Services Power Market Trends
3.1.5. South America Ancillary Services Power Market Trends
3.2. Ancillary Services Power Market Dynamics by Region
3.2.1. North America
3.2.1.1. North America Ancillary Services Power Market Drivers
3.2.1.2. North America Ancillary Services Power Market Restraints
3.2.1.3. North America Ancillary Services Power Market Opportunities
3.2.1.4. North America Ancillary Services Power Market Challenges
3.2.2. Europe
3.2.2.1. Europe Ancillary Services Power Market Drivers
3.2.2.2. Europe Ancillary Services Power Market Restraints
3.2.2.3. Europe Ancillary Services Power Market Opportunities
3.2.2.4. Europe Ancillary Services Power Market Challenges
3.2.3. Asia Pacific
3.2.3.1. Asia Pacific Ancillary Services Power Market Drivers
3.2.3.2. Asia Pacific Ancillary Services Power Market Restraints
3.2.3.3. Asia Pacific Ancillary Services Power Market Opportunities
3.2.3.4. Asia Pacific Ancillary Services Power Market Challenges
3.2.4. Middle East and Africa
3.2.4.1. Middle East and Africa Ancillary Services Power Market Drivers
3.2.4.2. Middle East and Africa Ancillary Services Power Market Restraints
3.2.4.3. Middle East and Africa Ancillary Services Power Market Opportunities
3.2.4.4. Middle East and Africa Ancillary Services Power Market Challenges
3.2.5. South America
3.2.5.1. South America Ancillary Services Power Market Drivers
3.2.5.2. South America Ancillary Services Power Market Restraints
3.2.5.3. South America Ancillary Services Power Market Opportunities
3.2.5.4. South America Ancillary Services Power Market Challenges
3.3. PORTER's Five Forces Analysis
3.4. PESTLE Analysis
3.5. Technology Roadmap
3.6. Regulatory Landscape by Region
3.6.1. North America
3.6.2. Europe
3.6.3. Asia Pacific
3.6.4. Middle East and Africa
3.6.5. South America
3.7. Key Opinion Leader Analysis For Ancillary Services Power Industry
3.8. Analysis of Government Schemes and Initiatives For Ancillary Services Power Industry
3.9. Ancillary Services Power Market Trade Analysis
3.10. The Global Pandemic Impact on Ancillary Services Power Market
4. Ancillary Services Power Market: Global Market Size and Forecast by Segmentation (in USD Billion) 2025-2032
4.1. Ancillary Services Power Market Size and Forecast, by Function (2025-2032)
4.1.1. Frequency Control
4.1.2. Voltage Control
4.1.3. Reserve Services
4.1.4. Black Start
4.2. Ancillary Services Power Market Size and Forecast, by Service (2025-2032)
4.2.1. Frequency Regulation
4.2.2. Voltage Control & Reactive Power Support
4.2.3. Spinning Reserve
4.2.4. Non-spinning Reserve
4.2.5. Load Following
4.2.6. Black Start
4.2.7. Others
4.3. Ancillary Services Power Market Size and Forecast, by End-user (2025-2032)
4.3.1. Transmission System Operators
4.3.2. Distribution System Operators
4.3.3. Utilities
4.3.4. Independent Power Producers
4.4. Ancillary Services Power Market Size and Forecast, by Region (2025-2032)
4.4.1. North America
4.4.2. Europe
4.4.3. Asia Pacific
4.4.4. Middle East and Africa
4.4.5. South America
5. North America Ancillary Services Power Market Size and Forecast by Segmentation (in USD Billion) 2025-2032
5.1. North America Ancillary Services Power Market Size and Forecast, by Function (2025-2032)
5.1.1. Frequency Control
5.1.2. Voltage Control
5.1.3. Reserve Services
5.1.4. Black Start
5.2. North America Ancillary Services Power Market Size and Forecast, by Service (2025-2032)
5.2.1. Frequency Regulation
5.2.2. Voltage Control & Reactive Power Support
5.2.3. Spinning Reserve
5.2.4. Non-spinning Reserve
5.2.5. Load Following
5.2.6. Black Start
5.2.7. Others
5.3. North America Ancillary Services Power Market Size and Forecast, by End-user (2025-2032)
5.3.1. Transmission System Operators
5.3.2. Distribution System Operators
5.3.3. Utilities
5.3.4. Independent Power Producers
5.4. North America Ancillary Services Power Market Size and Forecast, by Country (2025-2032)
5.4.1. United States
5.4.1.1. United States Ancillary Services Power Market Size and Forecast, by Function (2025-2032)
5.4.1.1.1. Frequency Control
5.4.1.1.2. Voltage Control
5.4.1.1.3. Reserve Services
5.4.1.1.4. Black Start
5.4.1.2. United States Ancillary Services Power Market Size and Forecast, by Service (2025-2032)
5.4.1.2.1. Frequency Regulation
5.4.1.2.2. Voltage Control & Reactive Power Support
5.4.1.2.3. Spinning Reserve
5.4.1.2.4. Non-spinning Reserve
5.4.1.2.5. Load Following
5.4.1.2.6. Black Start
5.4.1.2.7. Others
5.4.1.3. United States Ancillary Services Power Market Size and Forecast, by End-user (2025-2032)
5.4.1.3.1. Transmission System Operators
5.4.1.3.2. Distribution System Operators
5.4.1.3.3. Utilities
5.4.1.3.4. Independent Power Producers
5.4.2. Canada
5.4.2.1. Canada Ancillary Services Power Market Size and Forecast, by Function (2025-2032)
5.4.2.1.1. Frequency Control
5.4.2.1.2. Voltage Control
5.4.2.1.3. Reserve Services
5.4.2.1.4. Black Start
5.4.2.2. Canada Ancillary Services Power Market Size and Forecast, by Service (2025-2032)
5.4.2.2.1. Frequency Regulation
5.4.2.2.2. Voltage Control & Reactive Power Support
5.4.2.2.3. Spinning Reserve
5.4.2.2.4. Non-spinning Reserve
5.4.2.2.5. Load Following
5.4.2.2.6. Black Start
5.4.2.2.7. Others
5.4.2.3. Canada Ancillary Services Power Market Size and Forecast, by End-user (2025-2032)
5.4.2.3.1. Transmission System Operators
5.4.2.3.2. Distribution System Operators
5.4.2.3.3. Utilities
5.4.2.3.4. Independent Power Producers
5.4.3. Mexico
5.4.3.1. Mexico Ancillary Services Power Market Size and Forecast, by Function (2025-2032)
5.4.3.1.1. Frequency Control
5.4.3.1.2. Voltage Control
5.4.3.1.3. Reserve Services
5.4.3.1.4. Black Start
5.4.3.2. Mexico Ancillary Services Power Market Size and Forecast, by Service (2025-2032)
5.4.3.2.1. Frequency Regulation
5.4.3.2.2. Voltage Control & Reactive Power Support
5.4.3.2.3. Spinning Reserve
5.4.3.2.4. Non-spinning Reserve
5.4.3.2.5. Load Following
5.4.3.2.6. Black Start
5.4.3.2.7. Others
5.4.3.3. Mexico Ancillary Services Power Market Size and Forecast, by End-user (2025-2032)
5.4.3.3.1. Transmission System Operators
5.4.3.3.2. Distribution System Operators
5.4.3.3.3. Utilities
5.4.3.3.4. Independent Power Producers
6. Europe Ancillary Services Power Market Size and Forecast by Segmentation (in USD Billion) 2025-2032
6.1. Europe Ancillary Services Power Market Size and Forecast, by Function (2025-2032)
6.2. Europe Ancillary Services Power Market Size and Forecast, by Service (2025-2032)
6.3. Europe Ancillary Services Power Market Size and Forecast, by End-user (2025-2032)
6.4. Europe Ancillary Services Power Market Size and Forecast, by Country (2025-2032)
6.4.1. United Kingdom
6.4.1.1. United Kingdom Ancillary Services Power Market Size and Forecast, by Function (2025-2032)
6.4.1.2. United Kingdom Ancillary Services Power Market Size and Forecast, by Service (2025-2032)
6.4.1.3. United Kingdom Ancillary Services Power Market Size and Forecast, by End-user (2025-2032)
6.4.2. France
6.4.2.1. France Ancillary Services Power Market Size and Forecast, by Function (2025-2032)
6.4.2.2. France Ancillary Services Power Market Size and Forecast, by Service (2025-2032)
6.4.2.3. France Ancillary Services Power Market Size and Forecast, by End-user (2025-2032)
6.4.3. Germany
6.4.3.1. Germany Ancillary Services Power Market Size and Forecast, by Function (2025-2032)
6.4.3.2. Germany Ancillary Services Power Market Size and Forecast, by Service (2025-2032)
6.4.3.3. Germany Ancillary Services Power Market Size and Forecast, by End-user (2025-2032)
6.4.4. Italy
6.4.4.1. Italy Ancillary Services Power Market Size and Forecast, by Function (2025-2032)
6.4.4.2. Italy Ancillary Services Power Market Size and Forecast, by Service (2025-2032)
6.4.4.3. Italy Ancillary Services Power Market Size and Forecast, by End-user (2025-2032)
6.4.5. Spain
6.4.5.1. Spain Ancillary Services Power Market Size and Forecast, by Function (2025-2032)
6.4.5.2. Spain Ancillary Services Power Market Size and Forecast, by Service (2025-2032)
6.4.5.3. Spain Ancillary Services Power Market Size and Forecast, by End-user (2025-2032)
6.4.6. Sweden
6.4.6.1. Sweden Ancillary Services Power Market Size and Forecast, by Function (2025-2032)
6.4.6.2. Sweden Ancillary Services Power Market Size and Forecast, by Service (2025-2032)
6.4.6.3. Sweden Ancillary Services Power Market Size and Forecast, by End-user (2025-2032)
6.4.7. Austria
6.4.7.1. Austria Ancillary Services Power Market Size and Forecast, by Function (2025-2032)
6.4.7.2. Austria Ancillary Services Power Market Size and Forecast, by Service (2025-2032)
6.4.7.3. Austria Ancillary Services Power Market Size and Forecast, by End-user (2025-2032)
6.4.8. Rest of Europe
6.4.8.1. Rest of Europe Ancillary Services Power Market Size and Forecast, by Function (2025-2032)
6.4.8.2. Rest of Europe Ancillary Services Power Market Size and Forecast, by Service (2025-2032)
6.4.8.3. Rest of Europe Ancillary Services Power Market Size and Forecast, by End-user (2025-2032)
7. Asia Pacific Ancillary Services Power Market Size and Forecast by Segmentation (in USD Billion) 2025-2032
7.1. Asia Pacific Ancillary Services Power Market Size and Forecast, by Function (2025-2032)
7.2. Asia Pacific Ancillary Services Power Market Size and Forecast, by Service (2025-2032)
7.3. Asia Pacific Ancillary Services Power Market Size and Forecast, by End-user (2025-2032)
7.4. Asia Pacific Ancillary Services Power Market Size and Forecast, by Country (2025-2032)
7.4.1. China
7.4.1.1. China Ancillary Services Power Market Size and Forecast, by Function (2025-2032)
7.4.1.2. China Ancillary Services Power Market Size and Forecast, by Service (2025-2032)
7.4.1.3. China Ancillary Services Power Market Size and Forecast, by End-user (2025-2032)
7.4.2. S Korea
7.4.2.1. S Korea Ancillary Services Power Market Size and Forecast, by Function (2025-2032)
7.4.2.2. S Korea Ancillary Services Power Market Size and Forecast, by Service (2025-2032)
7.4.2.3. S Korea Ancillary Services Power Market Size and Forecast, by End-user (2025-2032)
7.4.3. Japan
7.4.3.1. Japan Ancillary Services Power Market Size and Forecast, by Function (2025-2032)
7.4.3.2. Japan Ancillary Services Power Market Size and Forecast, by Service (2025-2032)
7.4.3.3. Japan Ancillary Services Power Market Size and Forecast, by End-user (2025-2032)
7.4.4. India
7.4.4.1. India Ancillary Services Power Market Size and Forecast, by Function (2025-2032)
7.4.4.2. India Ancillary Services Power Market Size and Forecast, by Service (2025-2032)
7.4.4.3. India Ancillary Services Power Market Size and Forecast, by End-user (2025-2032)
7.4.5. Australia
7.4.5.1. Australia Ancillary Services Power Market Size and Forecast, by Function (2025-2032)
7.4.5.2. Australia Ancillary Services Power Market Size and Forecast, by Service (2025-2032)
7.4.5.3. Australia Ancillary Services Power Market Size and Forecast, by End-user (2025-2032)
7.4.6. Indonesia
7.4.6.1. Indonesia Ancillary Services Power Market Size and Forecast, by Function (2025-2032)
7.4.6.2. Indonesia Ancillary Services Power Market Size and Forecast, by Service (2025-2032)
7.4.6.3. Indonesia Ancillary Services Power Market Size and Forecast, by End-user (2025-2032)
7.4.7. Malaysia
7.4.7.1. Malaysia Ancillary Services Power Market Size and Forecast, by Function (2025-2032)
7.4.7.2. Malaysia Ancillary Services Power Market Size and Forecast, by Service (2025-2032)
7.4.7.3. Malaysia Ancillary Services Power Market Size and Forecast, by End-user (2025-2032)
7.4.8. Vietnam
7.4.8.1. Vietnam Ancillary Services Power Market Size and Forecast, by Function (2025-2032)
7.4.8.2. Vietnam Ancillary Services Power Market Size and Forecast, by Service (2025-2032)
7.4.8.3. Vietnam Ancillary Services Power Market Size and Forecast, by End-user (2025-2032)
7.4.9. Taiwan
7.4.9.1. Taiwan Ancillary Services Power Market Size and Forecast, by Function (2025-2032)
7.4.9.2. Taiwan Ancillary Services Power Market Size and Forecast, by Service (2025-2032)
7.4.9.3. Taiwan Ancillary Services Power Market Size and Forecast, by End-user (2025-2032)
7.4.10. Rest of Asia Pacific
7.4.10.1. Rest of Asia Pacific Ancillary Services Power Market Size and Forecast, by Function (2025-2032)
7.4.10.2. Rest of Asia Pacific Ancillary Services Power Market Size and Forecast, by Service (2025-2032)
7.4.10.3. Rest of Asia Pacific Ancillary Services Power Market Size and Forecast, by End-user (2025-2032)
8. Middle East and Africa Ancillary Services Power Market Size and Forecast by Segmentation (in USD Billion) 2025-2032
8.1. Middle East and Africa Ancillary Services Power Market Size and Forecast, by Function (2025-2032)
8.2. Middle East and Africa Ancillary Services Power Market Size and Forecast, by Service (2025-2032)
8.3. Middle East and Africa Ancillary Services Power Market Size and Forecast, by End-user (2025-2032)
8.4. Middle East and Africa Ancillary Services Power Market Size and Forecast, by Country (2025-2032)
8.4.1. South Africa
8.4.1.1. South Africa Ancillary Services Power Market Size and Forecast, by Function (2025-2032)
8.4.1.2. South Africa Ancillary Services Power Market Size and Forecast, by Service (2025-2032)
8.4.1.3. South Africa Ancillary Services Power Market Size and Forecast, by End-user (2025-2032)
8.4.2. GCC
8.4.2.1. GCC Ancillary Services Power Market Size and Forecast, by Function (2025-2032)
8.4.2.2. GCC Ancillary Services Power Market Size and Forecast, by Service (2025-2032)
8.4.2.3. GCC Ancillary Services Power Market Size and Forecast, by End-user (2025-2032)
8.4.3. Nigeria
8.4.3.1. Nigeria Ancillary Services Power Market Size and Forecast, by Function (2025-2032)
8.4.3.2. Nigeria Ancillary Services Power Market Size and Forecast, by Service (2025-2032)
8.4.3.3. Nigeria Ancillary Services Power Market Size and Forecast, by End-user (2025-2032)
8.4.4. Rest of ME&A
8.4.4.1. Rest of ME&A Ancillary Services Power Market Size and Forecast, by Function (2025-2032)
8.4.4.2. Rest of ME&A Ancillary Services Power Market Size and Forecast, by Service (2025-2032)
8.4.4.3. Rest of ME&A Ancillary Services Power Market Size and Forecast, by End-user (2025-2032)
9. South America Ancillary Services Power Market Size and Forecast by Segmentation (in USD Billion) 2025-2032
9.1. South America Ancillary Services Power Market Size and Forecast, by Function (2025-2032)
9.2. South America Ancillary Services Power Market Size and Forecast, by Service (2025-2032)
9.3. South America Ancillary Services Power Market Size and Forecast, by End-user (2025-2032)
9.4. South America Ancillary Services Power Market Size and Forecast, by Country (2025-2032)
9.4.1. Brazil
9.4.1.1. Brazil Ancillary Services Power Market Size and Forecast, by Function (2025-2032)
9.4.1.2. Brazil Ancillary Services Power Market Size and Forecast, by Service (2025-2032)
9.4.1.3. Brazil Ancillary Services Power Market Size and Forecast, by End-user (2025-2032)
9.4.2. Argentina
9.4.2.1. Argentina Ancillary Services Power Market Size and Forecast, by Function (2025-2032)
9.4.2.2. Argentina Ancillary Services Power Market Size and Forecast, by Service (2025-2032)
9.4.2.3. Argentina Ancillary Services Power Market Size and Forecast, by End-user (2025-2032)
9.4.3. Rest Of South America
9.4.3.1. Rest Of South America Ancillary Services Power Market Size and Forecast, by Function (2025-2032)
9.4.3.2. Rest Of South America Ancillary Services Power Market Size and Forecast, by Service (2025-2032)
9.4.3.3. Rest Of South America Ancillary Services Power Market Size and Forecast, by End-user (2025-2032)
10. Company Profile: Key Players
10.1. New York Independent System Operator
10.1.1. Company Overview
10.1.2. Business Portfolio
10.1.3. Financial Overview
10.1.4. SWOT Analysis
10.1.5. Strategic Analysis
10.1.6. Scale of Operation (small, medium, and large)
10.1.7. Details on Partnership
10.1.8. Regulatory Accreditations and Certifications Received by Them
10.1.9. Awards Received by the Firm
10.1.10. Recent Developments
10.2. Independent Electricity System Operator
10.3. Midcontinent Independent System Operator Inc.
10.4. Electric Reliability Council of Texas
10.5. Southwest Power Pool Inc.
10.6. Snowy Hydro Limited
10.7. PJM Interconnection
10.8. Elia Group
10.9. Transelectrica SA
10.10. Alberta Electric System Operator
10.11. General Electric Company
10.12. Siemens AG
10.13. ABB Ltd.
10.14. Schneider Electric SE
10.15. National Grid plc
10.16. NextEra Energy Inc.
10.17. Duke Energy Corporation
10.18. Mitsubishi Electric Corporation
10.19. Eaton Corporation plc
10.20. Enel SpA
10.21. Hitachi Energy
10.22. Dominion Energy Inc.
10.23. RWE AG
10.24. Iberdrola S.A.
10.25. EDF Energy
11. Key Findings
12. Industry Recommendations
13. Ancillary Services Power Market: Research Methodology
14. Terms and Glossary

Custom Market Research Services

We Will Customise The Research For You, In Case The Report Listed Above Does Not Meet With Your Requirements