
Energy bar Market - Industry Structure Evaluation, Demand Drivers Analysis, Regional Growth Analysis and Identification, Competitive Positioning / Landscape Review & Global Market Size Forecast to 2032
Overview
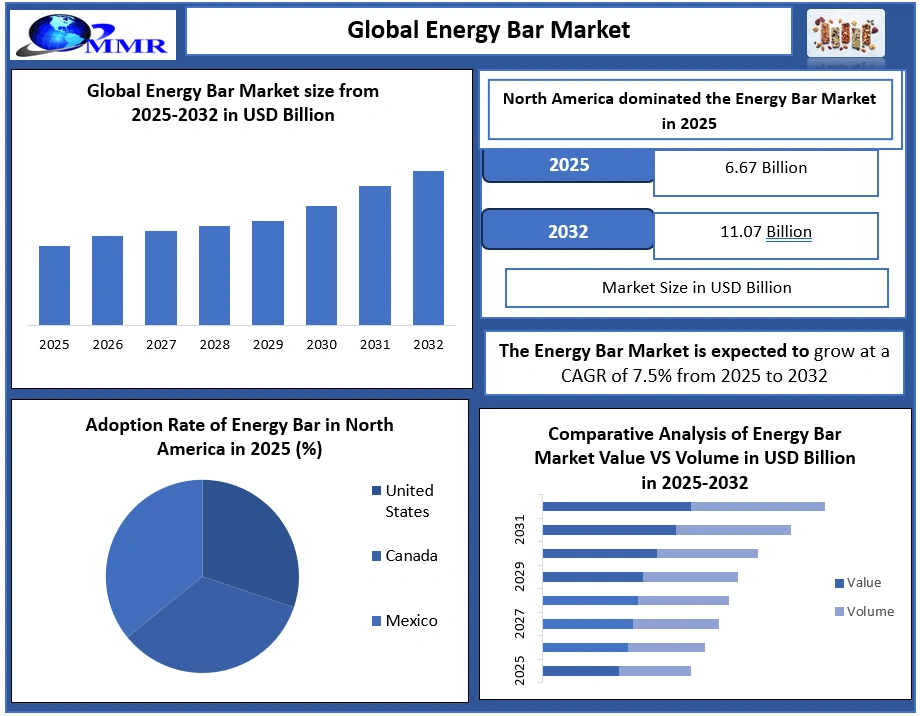
Energy Bar Market Size was valued at USD 6.67 Billion in 2025, and the total revenue is expected to grow at a CAGR of 7.5% from 2025 to 2032, reaching USD 11.07 Billion by 2032.
Energy Bar Market Overview
Energy bar is a compact, nutrient-rich food designed to provide quick energy, protein, and functional nutrition for active and health-conscious consumers. Rising adoption of clean-label, plant-based, and high-protein formulations is strengthening Energy Bar Market growth, driven by on-the-go lifestyles and fitness trends. Kellogg Company, General Mills, and Clif Bar & Company lead innovation and brand penetration, while North America and Asia Pacific remain high-demand regions due to strong consumer awareness and expanding health-snack consumption.
To know about the Research Methodology :- Request Free Sample Report
Energy Bar Market Trends
Trend: Shift Toward Clean-Label, Plant-Based, and Functional Ingredients Driving Energy Bar Innovation
The Energy Bar Market is witnessing a surge in clean-label and plant-based product demand, reflecting consumers’ preference for transparent, natural, and functional nutrition. 65% of global consumers now actively read ingredient labels, seeking low-sugar, high-protein, and fortified bars to support wellness and fitness routines. This trend is particularly strong among Millennials and Gen Z, who prioritize sustainable and ethically sourced ingredients. As a result, manufacturers are innovating with plant-based proteins, superfoods, and functional additives to enhance energy, satiety, and immunity, solidifying product differentiation and accelerating Energy Bar Market adoption and growth.
Rising Health Awareness and Active Lifestyle Adoption Accelerates to boost Energy Bar Market Growth
Consumer emphasis on healthier eating habits, fitness routines, and convenient functional snacks is accelerating the expansion of the Energy Bar Industry. Globally, According to WHO over 2.5 billion adults are overweight and 890 million obese, while 830 million people live with diabetes in 2025, prompting a shift toward high-protein, low-sugar, clean-label energy bars. Millennials and Gen Z, representing 59% of healthy snack consumers, actively seek nutrient-dense bars for pre- and post-workout energy, satiety, and wellness. This generational and lifestyle shift accelerates adoption, fuels product innovation, and strengthens Energy Bar Market growth, reinforcing the importance of functional, on-the-go nutrition.
Energy Bar Market Opportunity
High-Protein, Low-Sugar, Clean-Label Energy Bars with Functional Benefits
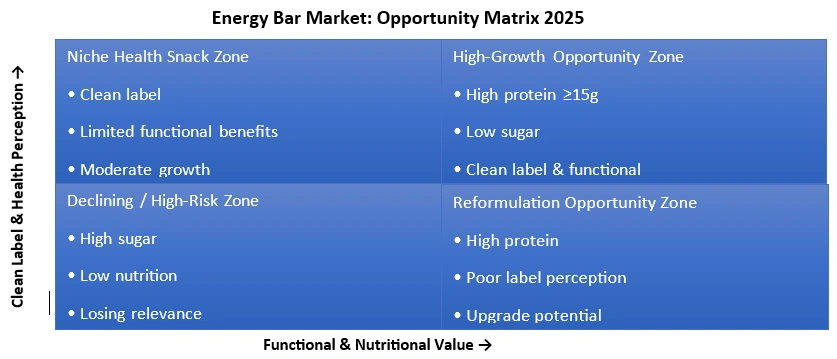
The Energy Bar Market opportunity lies in developing high-protein, low-sugar, clean-label bars with added functional benefits, aligned with evolving consumer nutrition priorities. Over 56% of U.S. consumers actively increase protein intake, while nearly 60% are reducing sugar, driving strong demand for balanced formulations. 24% of global functional nutrition buyers are influenced by functional benefit claims, such as energy, immunity, and gut health. Brands combining protein (≥15g), fiber, clean ingredients, and functional additives can capture premium positioning, accelerate adoption among health-conscious consumers, and unlock sustained Energy Bar Market growth.
Energy Bar Market Restraints
High Product Pricing to Limit Mass-Market Adoption
A key restraint in the Energy Bar Market is the relatively high pricing of functional and protein-rich energy bars, which limits adoption among price-sensitive consumers. Premium formulations incorporating high protein content, specialized ingredients, and performance nutrition benefits are often priced significantly higher than conventional snack bars. This pricing gap reduces penetration in emerging and value-driven markets, where affordability remains a critical purchase factor. As a result, Energy Bar Market growth faces constraints in achieving large-scale adoption beyond urban, fitness-oriented consumer segments.
Energy Bar Market Segment Analysis
By Type: The Global Energy Bar Market is segmented by type into Protein Bars, Nutrition Bars, Cereal Bars, and Fiber Bars, each catering to distinct consumer needs and consumption occasions. Protein bars held the largest Energy Bar Market Share in 2025, driven by rising protein bar demand among fitness enthusiasts, athletes, and health-conscious consumers seeking muscle support, energy, and satiety. Nutrition bars are gaining traction as balanced, on-the-go meal replacements, aligning with broader Energy Bar Market trends toward convenient functional foods. Cereal bars continue to see steady demand as affordable, everyday snacks, particularly among families and working professionals. Meanwhile, fiber bars are witnessing increasing adoption due to growing digestive health awareness, supporting expansion in the Functional Food Bar Market and Sports Nutrition Bar Industry.

By Distribution Channel: The Global Energy Bar Market is segmented by distribution channel into Supermarkets/Hypermarkets, Convenience Stores, Specialty Stores, Online Retail, and Others. Supermarkets and hypermarkets dominated distribution in 2025, supported by wide product assortments, competitive pricing, and high consumer footfall, making them critical for mass-market penetration. Convenience stores play a key role in impulse-driven purchases, benefiting from on-the-go consumption trends. Specialty stores, including health and nutrition outlets, are gaining importance as consumers seek expert guidance and premium offerings. Online retail is the fastest-growing channel, driven by digital adoption, subscription models, and direct-to-consumer strategies, enhancing Energy Bar Consumer Insights and reshaping Energy Bar Market trends.

Energy Bar Market Regional Insights
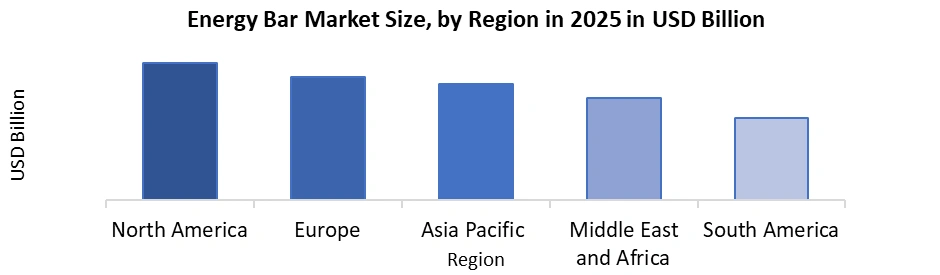
The Global Energy Bar Industry exhibits marked regional variation, underscoring diverse consumer preferences and growth drivers. In 2025, North America dominated with 39.96% market share, driven by widespread health conscious consumer trends, fitness enthusiast nutrition snacks, and mature online retail energy bar sales infrastructure, with the U.S. leading adoption. Europe followed with 29.87% share, reflecting adoption of clean-label energy bars and organic energy bar trends among urban populations. The Asia Pacific region accounted for 23.46% share, buoyed by rising disposable incomes and expanding online retail energy bar sales in emerging economies. South America (4.94%) and Middle East & Africa (1.76%) represent smaller yet strategic markets, indicating untapped potential amid growing functional snack demand.
Energy Bar Market Competitive Landscape
The Energy Bar Market is highly competitive, driven by innovation in formulation, functional ingredients, and speed-to-shelf execution. Leading brands such as Kellogg Company, General Mills Inc., and Clif Bar & Company focus on differentiated offerings including high-protein, plant-based, and low-sugar energy bars to meet evolving Energy Bar Market trends and consumer nutrition bar insights. Ingredient partners and co-manufacturers, exemplified by Glanbia Nutritionals’ rapid bar development services and formulation expertise, support new product launches by aligning bar nutrition targets with texture, taste, and functional positioning, enhancing retailer acceptance and on-shelf performance. Retailers emphasize assortments that balance mainstream appeal with niche functional benefits, strengthening category growth across supermarkets, convenience outlets, and online retail channels.
Energy Bar Market: Competitive Landscape Table
| Factor | Market Implication |
| Key Innovators | Kellogg Company, General Mills Inc., Clif Bar & Company – strong brand equity and distribution |
| Ingredient & Development Partners | Glanbia Nutritionals – rapid R&D support, customized formulations |
| Product Differentiation | High-protein, plant-based, low-sugar, functional bars |
| Retail Channels | Supermarkets/Hypermarkets, Specialty Stores, Online Retail expanding category reach |
| Retailer Focus | Assortment mix of mainstream and functional energy bars to capture varied consumer segments |
| Innovation Drivers | Functional ingredients, formulation technology, fast product rollout |
Case Study & R&D Insight: Accelerating Energy Bar Innovation
Glanbia Nutritionals’ R&D enabled a leading CPG brand to fast-track Energy Bar Market innovation, developing five formulations in just two days. Each met nutrition, taste, and texture targets, moving from concept to retail launch in three months. With 56% of U.S. consumers increasing protein intake and 53% boosting fiber, this case highlights the strategic value of collaborative R&D, functional formulation, and agile product development in meeting consumer-driven demand.
Case Study: Bar Consumption Patterns Highlight Energy Bar Adoption
Across major developed markets including the U.S., UK, Germany, and Australia bar products (including energy bars) have seen a notable rise as healthy and convenient snacks, reflecting shifting eating styles where frequent snacking replaces structured meals. Over the past five years, bars have dominated new snack launches, with 79% of U.S. consumers consuming bars in the past 12 months, indicating strong Energy Bar Market consumer adoption driven by convenience and nutritional value.60% of U.S. consumers consider high protein claims important, reinforcing demand for high protein energy bars aligned with active lifestyles and wellness priorities.
Global Energy bar Market Scope: Inquiry Before Buying
| Global Energy bar Market | |||
|---|---|---|---|
| Report Coverage | Details | ||
| Base Year: | 2025 | Forecast Period: | 2026-2032 |
| Historical Data: | 2020 to 2025 | Market Size in 2025: | USD 6.67 Bn. |
| Forecast Period 2026 to 2032 CAGR: | 7.5% | Market Size in 2032: | USD 11.07 Bn. |
| Segments Covered: | by Type | Protein bar Nutrition bar Cereal bar Fiber bar |
|
| by Nature | Organic Conventional |
||
| by Ingredient Type | Grains Nuts & Seeds Fruits Chocolate Coated Others |
||
| by Flavor | Caramel Peanut Butter Honey Others |
||
| by Distribution Channel | Supermarkets/Hypermarkets Convenience Stores Specialty Stores Online Retail Others |
||
Energy bar Market, by Region
North America (United States, Canada and Mexico)
Europe (UK, France, Germany, Italy, Spain, Sweden, Austria and Rest of Europe)
Asia Pacific (China, South Korea, Japan, India, Australia, Indonesia, Malaysia, Vietnam, Taiwan, Bangladesh, Pakistan and Rest of APAC)
Middle East and Africa (South Africa, GCC, Egypt, Nigeria and Rest of ME&A)
South America (Brazil, Argentina Rest of South America)
Energy Bar Key Players
1. Kellogg Company
2. General Mills Inc.
3. Clif Bar & Company
4. Kind LLC
5. Lotus Bakeries
6. Mars Incorporated
7. Mondelēz International Inc.
8. PepsiCo Inc.
9. Post Holdings Inc.
10. Quest Nutrition LLC
11. NuGo Nutrition
12. Premier Nutrition Inc.
13. ProBar LLC
14. Bumble Bar Inc.
15. McKee Foods Corporation
16. Science in Sport plc
17. Abbott Laboratories
18. Nature Essential Foods Pvt. Ltd
19. Brighter Foods Ltd
20. OTE Sports Ltd
21. TORQ Limited
22. Freedom Nutritional Products Limited
23. Yoga Bar
24. Caveman Foods LLC
25. Amway Corp.
26. Nature’s Bakery LLC
27. Grenade
28. High5
29. Hammer Nutrition
30. Kate’s Real Food
31. Others
FAQ:
1. What are the growth drivers for the Energy Bar Market?
Answer: Rising health consciousness, increasing fitness participation, demand for convenient, high-protein and plant-based snacks, clean-label preferences, and expanding retail and online distribution channels globally drives energy bar market.
2. What are the major restraints for the Energy Bar Market growth?
Answer: High production costs, price sensitivity among consumers, limited awareness in emerging markets, and competition from traditional snacks are the restraints of the energy bar market.
3. Which region is expected to lead the global Energy Bar Market during the forecast period?
Answer: North America is expected to lead the global Energy Bar Market during the forecast period, driven by high health-conscious consumer adoption, widespread fitness culture, strong retail and online distribution networks, and growing demand for high-protein and plant-based energy bars across the U.S. and Canada.
4. What is the expected market size and growth rate of the Energy Bar Market?
Answer: The Energy Bar Market was valued at USD 6.67 Billion in 2025 and is expected to grow at a 7.5% CAGR, reaching USD 11.07 Billion by 2032.
5. What segments are covered in the Energy Bar Market report?
Answer: The report covers Type, Nature, Ingredient Type, Flavor, Distribution Channel and Region.