Electronic Navigational Charts Market – Global Industry Analysis and Forecast (2023-2029)

The 
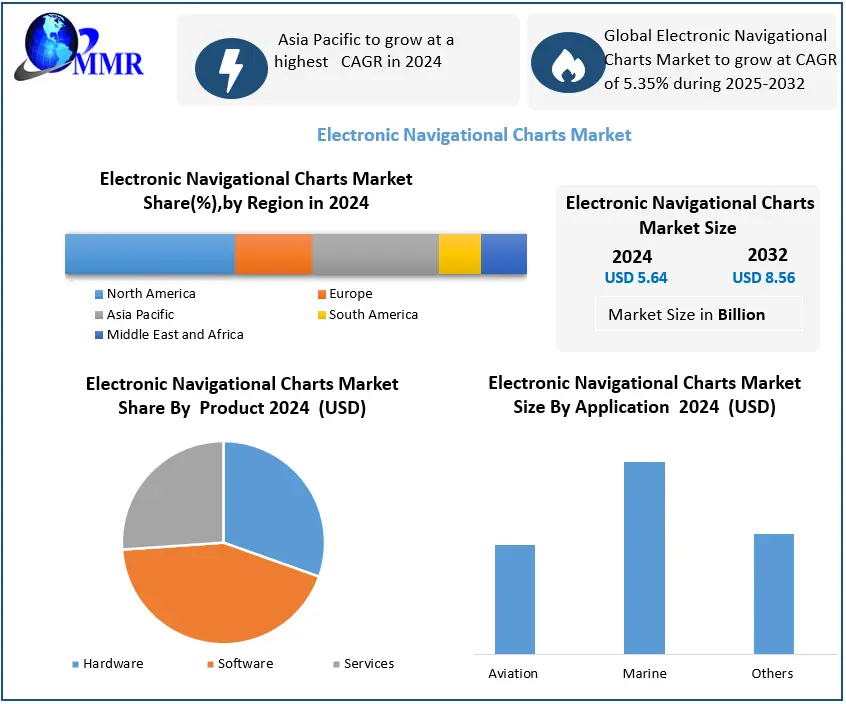
Electronic Navigational Charts Market was valued at US$  1.07 Bn. in 2022. The Global Electronic Navigational Charts Market size is estimated to grow at a CAGR of 5.35 % over the forecast period.

Electronic Navigational Charts Market Overview:

Electronic navigational maps are compliant with International Hydrographic Organization (IHO) S57 standards. ECDIS (Electronic Map Display and Information System) manufacturers use the IHO S57 standard to display navigational data on maps. Raster or paper maps are far preferable to computer navigational charts. Systems that use ENCs can be designed to provide information about an approaching danger in relation to mapped information and the movement and position of a ship. Electronic Navigational Charts MarketTo know about the Research Methodology :- Request Free Sample Report

Electronic Navigational Charts Market Dynamics:

The International Maritime Organization’s (IMO) safety criteria, the growth in the movement towards safe navigation systems & the expansion of the maritime and aircraft industries worldwide are expected to fuel the global demand for electronic navigation charts in forecast period. The paper catalogue is replaced by a digital catalogue (many of which are available), the order is sent by e-mail, & a license for the ENCs is sent by e-mail to the map distributor. Rise in Maritime Safety System: The increasing need to manage complicated supply chain operations, improve sustainability across the marine industry, increase trade & freight transport activities through the sea, increasing need to raise awareness about maritime safety & regulatory compliances & standards are the main factors propelling the growth of the maritime safety market. Additionally, the development of integrated solutions to reduce maritime terrorism & piracy, as well as emerging opportunities across untapped regional markets, are expected to present opportunities for businesses operating in the maritime safety market. These innovative technologies include RFID, GPS, AR, robotics, & Blockchain. However, there are restraints that could impede the market's growth for marine safety. The marine industry is facing a number of challenges, such as strict environmental rules & compliance concerns, a lack of common standards for implementing security solutions, & an increase in criminal activity. In addition to these limitations, merchants are expected to face a number of other difficulties in the near future. These would include escalating piracy problems, rising maritime terrorism, a shortage of workers, & a suspension of production during the epidemic. A global health & economic catastrophe brought on by the COVID-19 coronavirus had far-reaching effects on marine trade & transportation. Ports, shipping, and supply chains have been affected by the pandemic-related restrictions, which were put in place. There were difficulties in many industries' supply chains. Raw material limitations, lead-time issues, ocean blank sailings, port closures, shortened port hours, equipment and manpower shortages, and transportation capacity restrictions were a few of these difficulties. These impediments seriously damage transportation services and threaten the efficiency of supply chain operations and trade flows. Governments have circulated circulars and other types of communication regarding COVID-19 to both flag states and port states. The maritime industry has released a number of port marine circulars connected to COVID-19 in a number of nations and areas. Following feedback from the industry & unions, it established a prescribed process after initially announcing that crew changes were suspended. This process takes into account whether the seafarer has served the maximum amount of time on board and no further extensions of the employment contract are granted by the flag state. The long-term impact of the COVID-19 is yet to be fully understood. All signs point to the maritime industry facing major hurdles right away. Depending on the maritime transport sector, they vary (e.g., container, bulk, reefer, tanker). These indicators vary by geography, degree of development, & level of preceding shock and disruption preparedness. Globally, the COVID-19 epidemic has produced an unheard-of condition. Governments all across the world have imposed travel restrictions and closed borders to stop the disease's spread & diminish its effects. Ports and airports all over the world have closed, ships have been turned away, and planes have been grounded. Approximately 90% of world trade is transported by sea. One of the main sources of food in the globe is commercial fishing. There are many seamen aboard for extended periods of time. Crews must therefore frequently change in order to prevent tiredness. Every month, this affects some 100,000 mariners. Around 90,000 seamen are currently stranded aboard cruise ships without passengers and occasionally even without pay due to COVID-19-related regulations. Both sailors & ship owners have benefited from the Maritime Labor Convention of 2006, which has shown to be a reliable & useful tool during this pandemic. Licensing practices: The bonus of ENCs is that they are usually already on board the CDs that contain the ENCs. When the license is released, the ship will then load the charts from the CDs onto the ECDIS, removing the need to send physically any merchandise. Via M&A operations, several businesses are attempting to enter the domain of electronic navigational maps. In the year 2017, for example, Garmin Ltd. purchased Navionics S.P.A., the Italian electronic navigation charts firm. In addition, the demand for instruction in electronic navigational charts is likely to impede the development of the market for electronic navigational charts. Shipping businesses face difficulties in the use of ECDIS when teaching crew. There are choices for pursuing a general or type-specific ECDIS training plan. In purchasing & licensing practices, though the crew still needs to be qualified. The management of a digital catalogue, the preparation of a trip, the assessment of license conditions and the loading of ECDIS licenses require training in their own right. Owing to the numerous distinct forms of catalogue applications in operation, all with their own user interface and peculiarities, this is particularly true. The IMO approves ENCs as a paper-chart counterpart. Furthermore, according to the IMO, as is usually necessary under the Protection of Life at Sea (SOLAS) Convention, warships and ships fitted with ENCs do not need to hold paper maps. The contract fee is calculated on the basis of the contract duration, the number of units and the forms of ENCs for electronic navigational charts. Marine Technology Trends by the end of 2030: The development of technology is accelerating & will do so in the future. There is no sign that it will slow down in the next 15 years, nor is there any indication that the trend toward more tightly related technology applications will change. Despite how widespread the technological revolution is, the commercial maritime, navy, & ocean space sectors will experience it differently. In the marine industry, both individually & collectively, big data analytics, advanced materials, autonomous systems, advanced manufacturing, energy management, cyber & electronic warfare, human-computer interaction &human augmentation technologies are transformational. Utilizing these technologies will improve a navy's capacity to project military force, which is directly reliant on gaining access to the full spectrum of battle space, including cyberspace & on having the ability to coerce, deter, and intervene in its war fighting role to safeguard national interests. The ability of a navy to safeguard a country's population, territory, & trade against terrorism, crime, piracy, state-sponsored insurgency, & unlawful limitations on freedom of navigation will also be improved by these technology. Big data analytics, cutting-edge materials, autonomous systems, sensors, & communication, sustainable energy production, carbon capture & storage, marine biotechnology, & deep ocean mining are all transformational in nature when used separately or in combination in the ocean space sector. These technologies will offer a thorough understanding of the ocean environment, which might be utilised to solve issues like climate change, the depletion of land-based resources, & population growth. These technologies can make it simple to defend residents of coastal areas against powerful natural forces like storms &s tsunamis. Electronic Navigational Charts Market Dynamics: The International Maritime Organization’s (IMO) safety criteria, the growth in the movement towards safe navigation systems & the expansion of the maritime and aircraft industries worldwide are expected to fuel the global demand for electronic navigation charts in forecast period. The paper catalogue is replaced by a digital catalogue (many of which are available), the order is sent by e-mail, & a license for the ENCs is sent by e-mail to the map distributor. Rise in Maritime Safety System: The increasing need to manage complicated supply chain operations, improve sustainability across the marine industry, increase trade & freight transport activities through the sea, increasing need to raise awareness about maritime safety & regulatory compliances & standards are the main factors propelling the growth of the maritime safety market. Additionally, the development of integrated solutions to reduce maritime terrorism & piracy, as well as emerging opportunities across untapped regional markets, are expected to present opportunities for businesses operating in the maritime safety market. These innovative technologies include RFID, GPS, AR, robotics, & Blockchain. However, there are restraints that could impede the market's growth for marine safety. The marine industry is facing a number of challenges, such as strict environmental rules & compliance concerns, a lack of common standards for implementing security solutions, & an increase in criminal activity. In addition to these limitations, merchants are expected to face a number of other difficulties in the near future. These would include escalating piracy problems, rising maritime terrorism, a shortage of workers, & a suspension of production during the epidemic. A global health & economic catastrophe brought on by the COVID-19 coronavirus had far-reaching effects on marine trade & transportation. Ports, shipping, and supply chains have been affected by the pandemic-related restrictions, which were put in place. There were difficulties in many industries' supply chains. Raw material limitations, lead-time issues, ocean blank sailings, port closures, shortened port hours, equipment and manpower shortages, and transportation capacity restrictions were a few of these difficulties. These impediments seriously damage transportation services and threaten the efficiency of supply chain operations and trade flows. Governments have circulated circulars and other types of communication regarding COVID-19 to both flag states and port states. The maritime industry has released a number of port marine circulars connected to COVID-19 in a number of nations and areas. Following feedback from the industry & unions, it established a prescribed process after initially announcing that crew changes were suspended. This process takes into account whether the seafarer has served the maximum amount of time on board and no further extensions of the employment contract are granted by the flag state. The long-term impact of the COVID-19 is yet to be fully understood. All signs point to the maritime industry facing major hurdles right away. Depending on the maritime transport sector, they vary (e.g., container, bulk, reefer, tanker). These indicators vary by geography, degree of development, & level of preceding shock and disruption preparedness. Globally, the COVID-19 epidemic has produced an unheard-of condition. Governments all across the world have imposed travel restrictions and closed borders to stop the disease's spread & diminish its effects. Ports and airports all over the world have closed, ships have been turned away, and planes have been grounded. Approximately 90% of world trade is transported by sea. One of the main sources of food in the globe is commercial fishing. There are many seamen aboard for extended periods of time. Crews must therefore frequently change in order to prevent tiredness. Every month, this affects some 100,000 mariners. Around 90,000 seamen are currently stranded aboard cruise ships without passengers and occasionally even without pay due to COVID-19-related regulations. Both sailors & ship owners have benefited from the Maritime Labor Convention of 2006, which has shown to be a reliable & useful tool during this pandemic. Licensing practices: The bonus of ENCs is that they are usually already on board the CDs that contain the ENCs. When the license is released, the ship will then load the charts from the CDs onto the ECDIS, removing the need to send physically any merchandise. Via M&A operations, several businesses are attempting to enter the domain of electronic navigational maps. In the year 2017, for example, Garmin Ltd. purchased Navionics S.P.A., the Italian electronic navigation charts firm. In addition, the demand for instruction in electronic navigational charts is likely to impede the development of the market for electronic navigational charts. Shipping businesses face difficulties in the use of ECDIS when teaching crew. There are choices for pursuing a general or type-specific ECDIS training plan. In purchasing & licensing practices, though the crew still needs to be qualified. The management of a digital catalogue, the preparation of a trip, the assessment of license conditions and the loading of ECDIS licenses require training in their own right. Owing to the numerous distinct forms of catalogue applications in operation, all with their own user interface and peculiarities, this is particularly true. The IMO approves ENCs as a paper-chart counterpart. Furthermore, according to the IMO, as is usually necessary under the Protection of Life at Sea (SOLAS) Convention, warships and ships fitted with ENCs do not need to hold paper maps. The contract fee is calculated on the basis of the contract duration, the number of units and the forms of ENCs for electronic navigational charts. Marine Technology Trends by the end of 2030: The development of technology is accelerating & will do so in the future. There is no sign that it will slow down in the next 15 years, nor is there any indication that the trend toward more tightly related technology applications will change. Despite how widespread the technological revolution is, the commercial maritime, navy, & ocean space sectors will experience it differently. In the marine industry, both individually & collectively, big data analytics, advanced materials, autonomous systems, advanced manufacturing, energy management, cyber & electronic warfare, human-computer interaction &human augmentation technologies are transformational. Utilizing these technologies will improve a navy's capacity to project military force, which is directly reliant on gaining access to the full spectrum of battle space, including cyberspace & on having the ability to coerce, deter, and intervene in its war fighting role to safeguard national interests. The ability of a navy to safeguard a country's population, territory, & trade against terrorism, crime, piracy, state-sponsored insurgency, & unlawful limitations on freedom of navigation will also be improved by these technology. Big data analytics, cutting-edge materials, autonomous systems, sensors, & communication, sustainable energy production, carbon capture & storage, marine biotechnology, & deep ocean mining are all transformational in nature when used separately or in combination in the ocean space sector. These technologies will offer a thorough understanding of the ocean environment, which might be utilised to solve issues like climate change, the depletion of land-based resources, & population growth. These technologies can make it simple to defend residents of coastal areas against powerful natural forces like storms &s tsunamis. Asia-Pacific Aviation Sector Set To Boom: The market's growth is ascribed to a number of factors, including rising disposable incomes, more air travel, the growth of the tourism sector, & growing global trade. Players in the aerospace avionics industry are being further encouraged to expand their avionics portfolios by the growth in aircraft deliveries to address the accelerating air passenger traffic. The industry share will be supported by the implementation of cutting-edge technologies like the Internet of Things (IoT) and connected cabin technologies, which will provide clients with individualized travel experiences. In the year 2018, the flight management system accounted for a significant 19% of the market for aerospace avionics. Numerous advantages of the flight management system include shorter flight routes that result in less fuel being consumed & more operating capabilities. The development of new open architecture for avionics, which will support the industry scale over the future years, is a top priority for major producers of avionics systems. A surge in air passenger traffic is being caused by a number of regional government laws that assist the improvement of passenger safety. By the end of 2025, it is expected that the commercial aviation segment would hold a significant share of the Aerospace Avionics market, accounting for more than 55% of total market revenue, as a result of the increased need for commercial aircraft to serve the region's growing business travel & international tourist sectors. Government agencies in the area are putting their efforts into building infrastructure, initiating helpful initiatives, and collaborating with private airlines to provide customers with sustainable & inexpensive air connectivity, helping the commercial aviation market. For instance, in order to make flying more accessible to citizens, the Ministry of Civil Aviation, Government of India, announced the National Civil Aviation Policy (NCAP) in June 2016. The Indian ministry also released updated RDG route categorization, which went into effect at the end of 2017. In the year 2022, China held a market share of over 30%. The fastest developing economy in the area is to blame for the country's rising industry. In order to meet the growing need for avionics, the region's aircraft operators are calling for improved avionics and communication systems. For instance, in December 2019, Boeing established its first 737 assembly factory in China, putting an end to the trade spat between the two countries and creating new market opportunities. Electronic Navigational Charts Market Regional Overview: Due to the growth of the marine industry, an improvement in the safety of navigational systems, & the existence of well-established businesses offering electronic navigational charts, North America and Europe are anticipated to dominate the market for electronic navigational charts. Additionally, the market for electronic navigational charts in Asia Pacific is expected to grow over the projected period of 2023 to 2029 due to an increase in demand for electronic navigational charts for ships & aircraft. The market's growth is ascribed to a number of factors, including rising disposable incomes, more air travel, the growth of the tourism sector, & growing global trade. Players in the aerospace avionics industry are being further encouraged to expand their avionics portfolios by the growth in aircraft deliveries to address the accelerating air passenger traffic. The industry share will be supported by the implementation of cutting-edge technologies like the Internet of Things (IoT) and connected cabin technologies, which will provide clients with individualized travel experiences. In the year 2018, the flight management system accounted for a significant 19% of the market for aerospace avionics. Numerous advantages of the flight management system include shorter flight routes that result in less fuel being consumed & more operating capabilities. The development of new open architecture for avionics, which will support the industry scale over the future years, is a top priority for major producers of avionics systems. A surge in air passenger traffic is being caused by a number of regional government laws that assist the improvement of passenger safety. By the end of 2025, it is expected that the commercial aviation segment would hold a significant share of the Aerospace Avionics market, accounting for more than 55% of total market revenue, as a result of the increased need for commercial aircraft to serve the region's growing business travel & international tourist sectors. Government agencies in the area are putting their efforts into building infrastructure, initiating helpful initiatives, and collaborating with private airlines to provide customers with sustainable & inexpensive air connectivity, helping the commercial aviation market. For instance, in order to make flying more accessible to citizens, the Ministry of Civil Aviation, Government of India, announced the National Civil Aviation Policy (NCAP) in June 2016. The Indian ministry also released updated RDG route categorization, which went into effect at the end of 2017. In the year 2022, China held a market share of over 30%. The fastest developing economy in the area is to blame for the country's rising industry. In order to meet the growing need for avionics, the region's aircraft operators are calling for improved avionics and communication systems. For instance, in December 2019, Boeing established its first 737 assembly factory in China, putting an end to the trade spat between the two countries and creating new market opportunities.

Electronic Navigational Charts Market Regional Overview:

Due to the growth of the marine industry, an improvement in the safety of navigational systems, & the existence of well-established businesses offering electronic navigational charts, North America and Europe are anticipated to dominate the market for electronic navigational charts. Additionally, the market for electronic navigational charts in Asia Pacific is expected to grow over the projected period of 2023 to 2029 due to an increase in demand for electronic navigational charts for ships & aircraft. The report's objective is to provide industry stakeholders with a thorough insight of the global IPTV Market. The research analyses complex data in plain terms & shows the historical & current state of the industry together with predicted market size & trends. The analysis analyses important companies, including market leaders, followers, and new entries, in detail and covers all areas of the industry. The research includes a PORTER, PESTEL analysis with the probable influence of market micro-economic aspects. Analysis of both internal & external variables that are thought to have an impact on the company either favourably or unfavorably has been done in order to provide decision-makers with a clear futuristic vision of the sector. The reports also help in understanding the Electronic Navigational Charts Market dynamic, and structure by analyzing the market segments and projecting the Electronic Navigational Charts Market size. Clear representation of competitive analysis of key players by Design, price, financial position, Component portfolio, growth strategies, and regional presence in the Electronic Navigational Charts Market make the report investor’s guide.

Electronic Navigational Charts Market Scope: Inquire before buying

Electronic Navigational Charts Market
Report Coverage Details
Base Year: 2022 Forecast Period: 2023-2029
Historical Data: 2018 to 2022 Market Size in 2022: US $ 1.07 Bn.
Forecast Period 2023 to 2029 CAGR: 5.35% Market Size in 2029: US $ 1.55 Bn.
Segments Covered: by Component Hardware Software Services
by Application Aviation Marine Others

Electronic Navigational Charts Market by Region:

North America (United States, Canada and Mexico) Europe (UK, France, Germany, Italy, Spain, Sweden, Austria and Rest of Europe) Asia Pacific (China, South Korea, Japan, India, Australia, Indonesia, Malaysia, Vietnam, Taiwan, Bangladesh, Pakistan and Rest of APAC) Middle East and Africa (South Africa, GCC, Egypt, Nigeria and Rest of ME&A) South America (Brazil, Argentina Rest of South America

Electronic Navigational Charts Market Key Players:

1. Electronic Charts Company, Inc. 2. ChartCo Limited 3. Japan Hydrographic Charts & Publications Co., Ltd. 4. OceanWise 5. Poseidon Navigation Services Ltd 6. Maritime Services Ltd. 7. Sirm SPA 8. Jeppesen 9. SRH Marine Electronics S.A. 10. Maryland Nautical 11. American Nautical Services, Inc. 12. Fontanski Marine Supply 13. Nautisk Forlag AS. 14. Others. Frequently Asked Questions: 1. What is the study period of the market? Ans. The Global Electronic Navigational Charts Market is studied from 2022-2029. 2. What is the growth rate of Electronic Navigational Charts Market? Ans. The Global Electronic Navigational Charts Market is growing at a CAGR of 5.35 % over forecast period. 3. Which region has largest share in The Global Electronic Navigational Charts Market? Ans. Asia-Pacific holds the largest share. 4. What is the Global Electronic Navigational Charts Market segment based on Application? Ans. Aviation, Marine, Others 5. Who are the key players in the Global Electronic Navigational Charts Market? Ans. The key players in the Global Electronic Navigational Charts Market are Electronic Charts Company, Inc., ChartCo Limited, Japan Hydrographic Charts & Publications Co., Ltd., OceanWise, Poseidon Navigation Services Ltd, Maritime Services Ltd., Sirm SPA, Jeppesen, SRH Marine Electronics S.A.,
1. Electronic Navigational Charts Market Introduction 1.1. Study Assumption and Market Definition 1.2. Scope of the Study 1.3. Executive Summary 2. Electronic Navigational Charts Market: Dynamics 2.1. Electronic Navigational Charts Market Trends by Region 2.1.1. North America Electronic Navigational Charts Market Trends 2.1.2. Europe Electronic Navigational Charts Market Trends 2.1.3. Asia Pacific Electronic Navigational Charts Market Trends 2.1.4. Middle East and Africa Electronic Navigational Charts Market Trends 2.1.5. South America Electronic Navigational Charts Market Trends 2.2. Electronic Navigational Charts Market Dynamics by Region 2.2.1. North America 2.2.1.1. North America Electronic Navigational Charts Market Drivers 2.2.1.2. North America Electronic Navigational Charts Market Restraints 2.2.1.3. North America Electronic Navigational Charts Market Opportunities 2.2.1.4. North America Electronic Navigational Charts Market Challenges 2.2.2. Europe 2.2.2.1. Europe Electronic Navigational Charts Market Drivers 2.2.2.2. Europe Electronic Navigational Charts Market Restraints 2.2.2.3. Europe Electronic Navigational Charts Market Opportunities 2.2.2.4. Europe Electronic Navigational Charts Market Challenges 2.2.3. Asia Pacific 2.2.3.1. Asia Pacific Electronic Navigational Charts Market Drivers 2.2.3.2. Asia Pacific Electronic Navigational Charts Market Restraints 2.2.3.3. Asia Pacific Electronic Navigational Charts Market Opportunities 2.2.3.4. Asia Pacific Electronic Navigational Charts Market Challenges 2.2.4. Middle East and Africa 2.2.4.1. Middle East and Africa Electronic Navigational Charts Market Drivers 2.2.4.2. Middle East and Africa Electronic Navigational Charts Market Restraints 2.2.4.3. Middle East and Africa Electronic Navigational Charts Market Opportunities 2.2.4.4. Middle East and Africa Electronic Navigational Charts Market Challenges 2.2.5. South America 2.2.5.1. South America Electronic Navigational Charts Market Drivers 2.2.5.2. South America Electronic Navigational Charts Market Restraints 2.2.5.3. South America Electronic Navigational Charts Market Opportunities 2.2.5.4. South America Electronic Navigational Charts Market Challenges 2.3. PORTER’s Five Forces Analysis 2.4. PESTLE Analysis 2.5. Technology Roadmap 2.6. Regulatory Landscape by Region 2.6.1. North America 2.6.2. Europe 2.6.3. Asia Pacific 2.6.4. Middle East and Africa 2.6.5. South America 2.7. Key Opinion Leader Analysis For Electronic Navigational Charts Industry 2.8. Analysis of Government Schemes and Initiatives For Electronic Navigational Charts Industry 2.9. Electronic Navigational Charts Market Trade Analysis 2.10. The Global Pandemic Impact on Electronic Navigational Charts Market 3. Electronic Navigational Charts Market: Global Market Size and Forecast by Segmentation by Demand and Supply Side (by Value in USD Million) 2022-2029 3.1. Electronic Navigational Charts Market Size and Forecast, by Component (2022-2029) 3.1.1. Hardware 3.1.2. Software 3.1.3. Services 3.2. Electronic Navigational Charts Market Size and Forecast, by Application (2022-2029) 3.2.1. Aviation 3.2.2. Marine 3.2.3. Others 3.3. Electronic Navigational Charts Market Size and Forecast, by Region (2022-2029) 3.3.1. North America 3.3.2. Europe 3.3.3. Asia Pacific 3.3.4. Middle East and Africa 3.3.5. South America 4. North America Electronic Navigational Charts Market Size and Forecast by Segmentation (by Value in USD Million) 2022-2029 4.1. North America Electronic Navigational Charts Market Size and Forecast, by Component (2022-2029) 4.1.1. Hardware 4.1.2. Software 4.1.3. Services 4.2. North America Electronic Navigational Charts Market Size and Forecast, by Application (2022-2029) 4.2.1. Aviation 4.2.2. Marine 4.2.3. Others 4.3. North America Electronic Navigational Charts Market Size and Forecast, by Country (2022-2029) 4.3.1. United States 4.3.1.1. United States Electronic Navigational Charts Market Size and Forecast, by Component (2022-2029) 4.3.1.1.1. Hardware 4.3.1.1.2. Software 4.3.1.1.3. Services 4.3.1.2. United States Electronic Navigational Charts Market Size and Forecast, by Application (2022-2029) 4.3.1.2.1. Aviation 4.3.1.2.2. Marine 4.3.1.2.3. Others 4.3.2. Canada 4.3.2.1. Canada Electronic Navigational Charts Market Size and Forecast, by Component (2022-2029) 4.3.2.1.1. Hardware 4.3.2.1.2. Software 4.3.2.1.3. Services 4.3.2.2. Canada Electronic Navigational Charts Market Size and Forecast, by Application (2022-2029) 4.3.2.2.1. Aviation 4.3.2.2.2. Marine 4.3.2.2.3. Others 4.3.3. Mexico 4.3.3.1. Mexico Electronic Navigational Charts Market Size and Forecast, by Component (2022-2029) 4.3.3.1.1. Hardware 4.3.3.1.2. Software 4.3.3.1.3. Services 4.3.3.2. Mexico Electronic Navigational Charts Market Size and Forecast, by Application (2022-2029) 4.3.3.2.1. Aviation 4.3.3.2.2. Marine 4.3.3.2.3. Others 5. Europe Electronic Navigational Charts Market Size and Forecast by Segmentation (by Value in USD Million) 2022-2029 5.1. Europe Electronic Navigational Charts Market Size and Forecast, by Component (2022-2029) 5.2. Europe Electronic Navigational Charts Market Size and Forecast, by Application (2022-2029) 5.3. Europe Electronic Navigational Charts Market Size and Forecast, by Country (2022-2029) 5.3.1. United Kingdom 5.3.1.1. United Kingdom Electronic Navigational Charts Market Size and Forecast, by Component (2022-2029) 5.3.1.2. United Kingdom Electronic Navigational Charts Market Size and Forecast, by Application (2022-2029) 5.3.2. France 5.3.2.1. France Electronic Navigational Charts Market Size and Forecast, by Component (2022-2029) 5.3.2.2. France Electronic Navigational Charts Market Size and Forecast, by Application (2022-2029) 5.3.3. Germany 5.3.3.1. Germany Electronic Navigational Charts Market Size and Forecast, by Component (2022-2029) 5.3.3.2. Germany Electronic Navigational Charts Market Size and Forecast, by Application (2022-2029) 5.3.4. Italy 5.3.4.1. Italy Electronic Navigational Charts Market Size and Forecast, by Component (2022-2029) 5.3.4.2. Italy Electronic Navigational Charts Market Size and Forecast, by Application (2022-2029) 5.3.5. Spain 5.3.5.1. Spain Electronic Navigational Charts Market Size and Forecast, by Component (2022-2029) 5.3.5.2. Spain Electronic Navigational Charts Market Size and Forecast, by Application (2022-2029) 5.3.6. Sweden 5.3.6.1. Sweden Electronic Navigational Charts Market Size and Forecast, by Component (2022-2029) 5.3.6.2. Sweden Electronic Navigational Charts Market Size and Forecast, by Application (2022-2029) 5.3.7. Austria 5.3.7.1. Austria Electronic Navigational Charts Market Size and Forecast, by Component (2022-2029) 5.3.7.2. Austria Electronic Navigational Charts Market Size and Forecast, by Application (2022-2029) 5.3.8. Rest of Europe 5.3.8.1. Rest of Europe Electronic Navigational Charts Market Size and Forecast, by Component (2022-2029) 5.3.8.2. Rest of Europe Electronic Navigational Charts Market Size and Forecast, by Application (2022-2029) 6. Asia Pacific Electronic Navigational Charts Market Size and Forecast by Segmentation (by Value in USD Million) 2022-2029 6.1. Asia Pacific Electronic Navigational Charts Market Size and Forecast, by Component (2022-2029) 6.2. Asia Pacific Electronic Navigational Charts Market Size and Forecast, by Application (2022-2029) 6.3. Asia Pacific Electronic Navigational Charts Market Size and Forecast, by Country (2022-2029) 6.3.1. China 6.3.1.1. China Electronic Navigational Charts Market Size and Forecast, by Component (2022-2029) 6.3.1.2. China Electronic Navigational Charts Market Size and Forecast, by Application (2022-2029) 6.3.2. S Korea 6.3.2.1. S Korea Electronic Navigational Charts Market Size and Forecast, by Component (2022-2029) 6.3.2.2. S Korea Electronic Navigational Charts Market Size and Forecast, by Application (2022-2029) 6.3.3. Japan 6.3.3.1. Japan Electronic Navigational Charts Market Size and Forecast, by Component (2022-2029) 6.3.3.2. Japan Electronic Navigational Charts Market Size and Forecast, by Application (2022-2029) 6.3.4. India 6.3.4.1. India Electronic Navigational Charts Market Size and Forecast, by Component (2022-2029) 6.3.4.2. India Electronic Navigational Charts Market Size and Forecast, by Application (2022-2029) 6.3.5. Australia 6.3.5.1. Australia Electronic Navigational Charts Market Size and Forecast, by Component (2022-2029) 6.3.5.2. Australia Electronic Navigational Charts Market Size and Forecast, by Application (2022-2029) 6.3.6. Indonesia 6.3.6.1. Indonesia Electronic Navigational Charts Market Size and Forecast, by Component (2022-2029) 6.3.6.2. Indonesia Electronic Navigational Charts Market Size and Forecast, by Application (2022-2029) 6.3.7. Malaysia 6.3.7.1. Malaysia Electronic Navigational Charts Market Size and Forecast, by Component (2022-2029) 6.3.7.2. Malaysia Electronic Navigational Charts Market Size and Forecast, by Application (2022-2029) 6.3.8. Vietnam 6.3.8.1. Vietnam Electronic Navigational Charts Market Size and Forecast, by Component (2022-2029) 6.3.8.2. Vietnam Electronic Navigational Charts Market Size and Forecast, by Application (2022-2029) 6.3.9. Taiwan 6.3.9.1. Taiwan Electronic Navigational Charts Market Size and Forecast, by Component (2022-2029) 6.3.9.2. Taiwan Electronic Navigational Charts Market Size and Forecast, by Application (2022-2029) 6.3.10. Rest of Asia Pacific 6.3.10.1. Rest of Asia Pacific Electronic Navigational Charts Market Size and Forecast, by Component (2022-2029) 6.3.10.2. Rest of Asia Pacific Electronic Navigational Charts Market Size and Forecast, by Application (2022-2029) 7. Middle East and Africa Electronic Navigational Charts Market Size and Forecast by Segmentation (by Value in USD Million) 2022-2029 7.1. Middle East and Africa Electronic Navigational Charts Market Size and Forecast, by Component (2022-2029) 7.2. Middle East and Africa Electronic Navigational Charts Market Size and Forecast, by Application (2022-2029) 7.3. Middle East and Africa Electronic Navigational Charts Market Size and Forecast, by Country (2022-2029) 7.3.1. South Africa 7.3.1.1. South Africa Electronic Navigational Charts Market Size and Forecast, by Component (2022-2029) 7.3.1.2. South Africa Electronic Navigational Charts Market Size and Forecast, by Application (2022-2029) 7.3.2. GCC 7.3.2.1. GCC Electronic Navigational Charts Market Size and Forecast, by Component (2022-2029) 7.3.2.2. GCC Electronic Navigational Charts Market Size and Forecast, by Application (2022-2029) 7.3.3. Nigeria 7.3.3.1. Nigeria Electronic Navigational Charts Market Size and Forecast, by Component (2022-2029) 7.3.3.2. Nigeria Electronic Navigational Charts Market Size and Forecast, by Application (2022-2029) 7.3.4. Rest of ME&A 7.3.4.1. Rest of ME&A Electronic Navigational Charts Market Size and Forecast, by Component (2022-2029) 7.3.4.2. Rest of ME&A Electronic Navigational Charts Market Size and Forecast, by Application (2022-2029) 8. South America Electronic Navigational Charts Market Size and Forecast by Segmentation (by Value in USD Million) 2022-2029 8.1. South America Electronic Navigational Charts Market Size and Forecast, by Component (2022-2029) 8.2. South America Electronic Navigational Charts Market Size and Forecast, by Application (2022-2029) 8.3. South America Electronic Navigational Charts Market Size and Forecast, by Country (2022-2029) 8.3.1. Brazil 8.3.1.1. Brazil Electronic Navigational Charts Market Size and Forecast, by Component (2022-2029) 8.3.1.2. Brazil Electronic Navigational Charts Market Size and Forecast, by Application (2022-2029) 8.3.2. Argentina 8.3.2.1. Argentina Electronic Navigational Charts Market Size and Forecast, by Component (2022-2029) 8.3.2.2. Argentina Electronic Navigational Charts Market Size and Forecast, by Application (2022-2029) 8.3.3. Rest Of South America 8.3.3.1. Rest Of South America Electronic Navigational Charts Market Size and Forecast, by Component (2022-2029) 8.3.3.2. Rest Of South America Electronic Navigational Charts Market Size and Forecast, by Application (2022-2029) 9. Global Electronic Navigational Charts Market: Competitive Landscape 9.1. MMR Competition Matrix 9.2. Competitive Landscape 9.3. Key Players Benchmarking 9.3.1. Company Name 9.3.2. Business Segment 9.3.3. End-user Segment 9.3.4. Revenue (2022) 9.3.5. Company Locations 9.4. Leading Electronic Navigational Charts Market Companies, by market capitalization 9.5. Market Structure 9.5.1. Market Leaders 9.5.2. Market Followers 9.5.3. Emerging Players 9.6. Mergers and Acquisitions Details 10. Company Profile: Key Players 10.1. Electronic Charts Company, Inc. 10.1.1. Company Overview 10.1.2. Business Portfolio 10.1.3. Financial Overview 10.1.4. SWOT Analysis 10.1.5. Strategic Analysis 10.1.6. Scale of Operation (small, medium, and large) 10.1.7. Details on Partnership 10.1.8. Regulatory Accreditations and Certifications Received by Them 10.1.9. Awards Received by the Firm 10.1.10. Recent Developments 10.2. ChartCo Limited 10.3. Japan Hydrographic Charts & Publications Co., Ltd. 10.4. OceanWise 10.5. Poseidon Navigation Services Ltd 10.6. Maritime Services Ltd. 10.7. Sirm SPA 10.8. Jeppesen 10.9. SRH Marine Electronics S.A. 10.10. Maryland Nautical 10.11. American Nautical Services, Inc. 10.12. Fontanski Marine Supply 10.13. Nautisk Forlag AS. 10.14. Others. 11. Key Findings 12. Industry Recommendations 13. Electronic Navigational Charts Market: Research Methodology 14. Terms and Glossary
  • INQUIRE BEFORE BUYING