
Global Defence Market Overview - Size, Share & Industry Snapshot
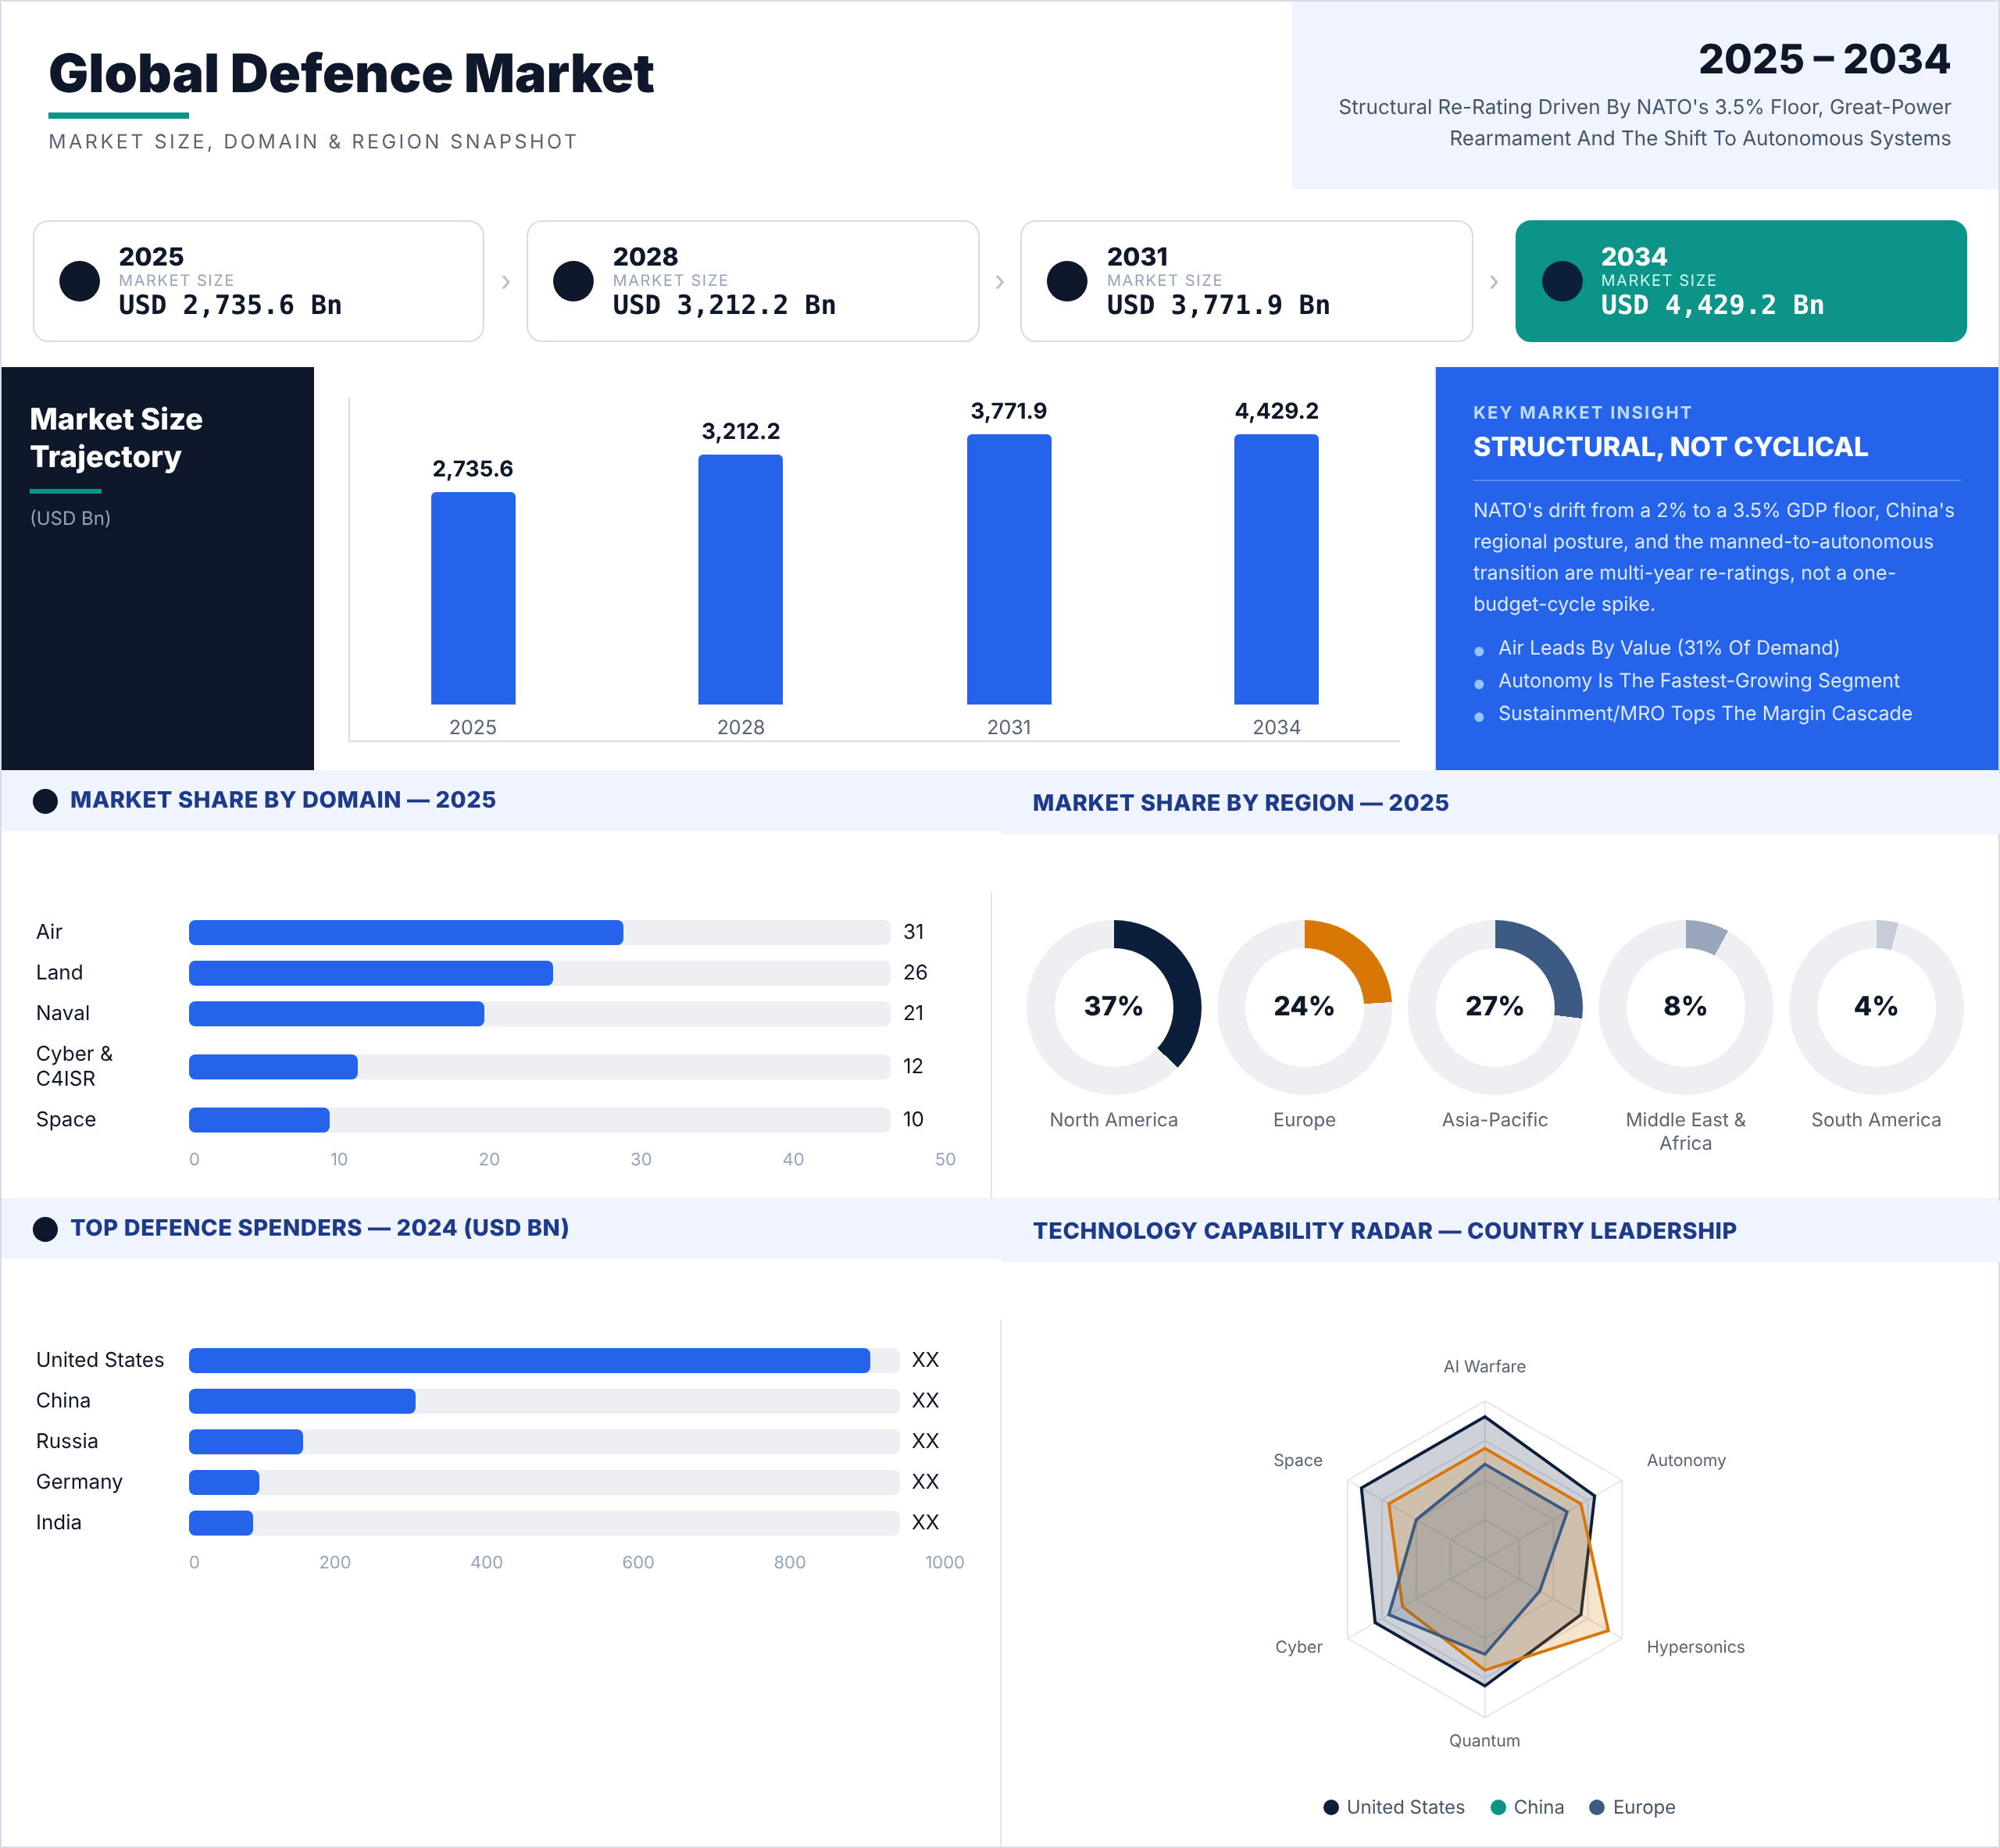
The Global Defence Market was valued at USD 2,735.58 Bn in 2025 and is projected to reach USD 4,429.16 Bn by 2034, growing at a CAGR of 5.5%. Rearmament across NATO, the Indo-Pacific and the Gulf - layered with the shift from manned platforms to autonomy - is reshaping where this growth concentrates.
Defence Market Scope & Report Coverage - Inquire Before Buying
| Report Coverage | Details | ||
|---|---|---|---|
| Base Year | 2025 | Forecast Period | 2026-2034 |
| Historical Data | 2020 to 2025 | Market Size in 2025 | USD 2,735.58 Bn |
| Forecast Period 2026-2034 CAGR | 5.5% | Market Size in 2034 | USD 4,429.16 Bn |
Segments Covered — By Defence Domain
| Level 1: Domain | Level 2: Segment | Level 3: Sub-segments |
|---|---|---|
| 1. Land / Army | 1.1 Armoured Vehicles | Main Battle Tanks (MBTs), Infantry Fighting Vehicles (IFVs), Armoured Personnel Carriers (APCs), Light Tactical Vehicles |
| 1.2 Artillery & Ground Weapons | Self-Propelled Artillery, Towed Artillery, Multiple Launch Rocket Systems (MLRS), Mortars | |
| 1.3 Soldier Systems & Small Arms | Small Arms, Soldier Modernization Systems, Personal Protection Equipment | |
| 1.4 Ground-Based Air Defence | Short-Range, Medium-Range and Long-Range Ground-Based Air Defence Systems; Dedicated Launchers and Associated Interceptors | |
| 1.5 Land Unmanned Systems | Unmanned Ground Vehicles (UGVs), EOD Robots, Autonomous Ground Platforms | |
| 1.6 Ground Support Systems | Tactical Communications, Ground Sensors, Ground-Specific Battlefield Management Systems | |
| 2. Naval / Navy | 2.1 Surface Combatants | Aircraft Carriers, Destroyers, Frigates, Corvettes, Patrol Vessels |
| 2.2 Submarines | Nuclear-Powered Submarines, Conventional Submarines | |
| 2.3 Naval Aviation | Carrier-Based Fixed-Wing Aircraft, Shipborne Helicopters, Naval Aviation-Specific Systems | |
| 2.4 Naval Weapons | Naval Guns, Torpedoes, Anti-Ship Missiles, Naval Weapon Systems | |
| 2.5 Naval Electronics | Sonar, Naval Radar, Platform-Specific Combat Management Systems, Naval Electronic Warfare Systems | |
| 2.6 Unmanned Maritime Systems | Unmanned Surface Vehicles (USVs), Unmanned Underwater Vehicles (UUVs) | |
| 3. Air / Air Force | 3.1 Combat Aircraft | Multirole Fighters, Air-Superiority Fighters, Strike Aircraft; Excludes Aircraft Classified under Naval Aviation |
| 3.2 Support Aircraft | Transport Aircraft, Aerial Tankers, Airborne Early Warning & Control (AEW&C), Special-Mission Aircraft | |
| 3.3 Military Helicopters | Attack Helicopters, Transport Helicopters, Utility Helicopters, Search and Rescue (SAR) Helicopters; Excludes Shipborne Helicopters Classified under Naval Aviation | |
| 3.4 Military UAV/UAS | Tactical UAVs, Medium-Altitude Long-Endurance (MALE) UAVs, High-Altitude Long-Endurance (HALE) UAVs, Combat UAVs | |
| 3.5 Airborne Electronics | Airborne Radar, Avionics, Airborne Electronic Warfare Systems, Airborne Intelligence, Surveillance and Reconnaissance (ISR) Systems | |
| 3.6 Air-Launched Weapons | Air-to-Air Missiles, Air-to-Ground Missiles, Precision-Guided Munitions | |
| 4. Space / Space Command | 4.1 Military Satellites | Military Communication Satellites, Earth Observation Satellites, Reconnaissance Satellites |
| 4.2 Space-Based ISR | ISR Payloads, Space-Based Intelligence Collection Systems | |
| 4.3 Navigation & Timing | Military Positioning, Navigation and Timing (PNT), Satellite Navigation Systems | |
| 4.4 Space Surveillance | Space Situational Awareness (SSA), Space Domain Awareness (SDA), Space Tracking Systems | |
| 4.5 Protected Space Infrastructure | Protected Satellite Communications, Resilient Military Space Systems | |
| 5. Cross-Domain Defence Systems | 5.1 Missiles & Strategic Weapons | Ballistic Missiles, Strategic Land-Attack Cruise Missiles, Hypersonic Missiles, Strategic Missile Systems |
| 5.2 Integrated Air & Missile Defence | Integrated Interceptor Coordination, Multi-Layer Air & Missile Defence Integration, Integrated Command-and-Control Systems, Networked Missile Defence Sensors | |
| 5.3 C4ISR & Command Systems | Joint Command-and-Control (C2), Secure Communications Networks, Cross-Domain ISR Integration, Integrated Battlefield Networks | |
| 5.4 Electronic Warfare | Cross-Domain Electronic Support, Electronic Attack, Electronic Protection | |
| 5.5 Cyber Defence | Military Cybersecurity, Secure Military Networks, Cyber Operations Systems | |
| 5.6 Joint/Multi-Domain Systems | Joint Command Systems, Multi-Domain Integration, Cross-Domain Data Integration |
Segment definitions and coverage shown here mirror the complete report's table of contents; all share and value figures are released at the sub-segment level in the full study.
Defence Market Key Highlights & Growth Trends 2025-2034
Most market reports list highlights. This section explains what they mean - for procurement strategy, for supplier positioning, and for investment timing in the global defence industry.
1. Autonomous & Unmanned Systems - The Growth Engine of the Defence Market
UAV, UGV and swarm-system procurement lines are now embedded in mainline force-structure budgets, not innovation pilots. Ukraine's battlefield has compressed the autonomy-adoption timeline that NATO planners expected to take until the early 2030s into a live doctrine shift happening now, and every major modernization program reviewed in this report now carries an explicit unmanned-systems line item that did not exist five years ago.
The real bottleneck is not platform supply - it is counter-autonomy doctrine, spectrum-management policy and airworthiness certification, all of which move slower than the hardware. Primes and component suppliers investing in autonomy software and sensor-fusion stacks today are locking in defence-market share that will be very difficult for a later entrant to dislodge, because autonomy contracts renew on software-update cycles, not platform-replacement cycles.
2. China's Rare-Earth Concentration - The Industry's Single Biggest Chokepoint
China controls roughly 70% of global rare-earth mining and roughly 90% of processing capacity - the two inputs that sit underneath nearly every Western missile-guidance system, radar array and electronic-warfare suite in this report. Layer in Taiwan's ~90% share of cutting-edge semiconductor fabrication and the Netherlands' sole-source position in EUV lithography equipment, and the defence industry's real constraint comes into focus: it is not demand, and it is not even raw-material reserves - it is midstream processing capacity, which almost none of the proposed Western alternatives (Mountain Pass, Saskatchewan, Kazakhstan) have solved for yet.
Only an estimated 6% of defence contractors report full Tier-1-to-Tier-3 supply-chain visibility, meaning the vast majority of primes cannot actually see how exposed their own sub-tier suppliers are to a single Chinese export license. For Western OEMs and their component suppliers, diversification is risk insurance against a 2027-horizon restriction scenario that several governments are already planning around - not a sustainability talking point.
3. Sustainment & MRO - Where the Margin Lives
Recurring, sole-sourced, low-capex sustainment and MRO contracts sit at the top of the Margin Cascade used throughout this report, while new-build land platforms - high capital intensity, fragmented competition, thin margins - sit at the bottom. The gap between the two is widening, not narrowing, as ageing fleets across NATO, the Gulf and the Indo-Pacific all enter their heaviest sustainment years simultaneously.
Capital is visibly rotating away from new-build toward software-defined upgrade and lifecycle-support revenue, which is also the segment least exposed to the program-delay and cost-overrun risk that plagues new platform starts. A supplier that converts even a fraction of its new-build relationship into a sustainment contract captures a multi-decade, re-competed-rarely revenue stream instead of a one-time sale.
4. Bearings, Ball Screws & Precision Actuation - The Moat Few Are Watching
Every platform segmented in this report - from a main battle tank's turret-drive system to a fighter's flight-control actuators to a naval gun mount - depends on a precision-motion component layer that gets one line in most competitor research and an entire dedicated section here. Qualification cycles for flight-critical and weapon-critical actuation run three to five years and are rarely re-opened once awarded.
That qualification barrier is the moat: once a supplier is qualified into a platform, it stays qualified for that platform's entire multi-decade production life, largely insulated from the price competition that squeezes prime contractors on the platform itself. For a precision-motion supplier like NSK, this is the single most direct, highest-return entry point into the defence market covered anywhere in this report.
5. The NATO 2% | 3.5% Re-Rating Is a Decade-Long Re-Pricing Event
Headlines cover the annual %GDP-compliance scoreboard; what they miss is that a shift from a 2% to a 3.5% planning floor across 32 member states is not a budget line change, it is a re-rating of the entire European procurement pipeline's addressable size over the next decade. Germany, Poland and the Baltic states have already moved planning assumptions; the laggards are a matter of pace, not direction.
For any supplier evaluating European market entry, the compliance trajectory member-by-member is a more useful signal than the current spend snapshot, because the gap between today's budget and the 3.5% floor is tomorrow's addressable procurement pipeline.
Global Defence Industry Overview - Definition, Scope & Market Evolution
The defence market is the capital-intensive, strategic economic sector consisting of the development, production, deployment, maintenance, and sale of military hardware, technology, infrastructure, and support services designed to protect nations and their interests.
This report's market sizing covers expenditure on arms, ammunition, platforms, systems and their associated technology, production and lifecycle support (R&D, procurement, MRO/sustainment, and upgrade spend). It does not include personnel costs such as salaries, pensions and other administrative service charges, which sit outside the addressable "market" definition used throughout this analysis, even though they appear inside national defence budgets.
The global defence market is the economic expression of a structural shift in how states compete - from platform-centric force structures toward network-centric, data-centric and increasingly autonomous warfare, at a scale that now touches every domain from land to space. It spans the full value chain from raw materials and precision components, through platform integration and testing, to procurement, fielding, and the multi-decade sustainment tail that follows every major program.
Defence spending crossed USD 2.72 trillion in 2024 - the steepest single-year rise since the Cold War, and the first time in three decades all five permanent UN Security Council members raised spend in the same year. That is not a one-off spike: NATO's structural drift toward a 3.5%-of-GDP planning floor, China's Indo-Pacific posture, and the Gulf states' missile-defence build-out are independent, overlapping forces that each extend the cycle on their own terms, which is why this report's base case carries the market to USD 4,429.16 Bn by 2034 at a 5.5% CAGR rather than treating 2024's surge as a peak to mean-revert from.
Three forces are reshaping who captures that growth. First, the center of gravity of global defence spend is shifting east and south, with Asia-Pacific and the Gulf compounding faster than the North American base that has historically anchored the market. Second, autonomy has moved from an R&D line item to a procurement category in its own right, changing which suppliers get qualified into next-generation platforms. Third, supply-chain resilience - rare earths, semiconductors, precision components - has become a procurement-evaluation criterion on par with unit cost, which is opening doors for suppliers who can demonstrate qualified, diversified sourcing.
Defence Market Regional Analysis - Growth Map by Geography
North America 37% share | 3.8% CAGR
The largest base but the slowest-growing of the five - a fleet-refresh and great-power-competition cycle on top of an already-mature procurement system. The United States alone outspends the next two countries combined; Canada's build-out is smaller but accelerating on NATO-compliance pressure, and Mexico's modernization is concentrated in internal-security platforms.
Europe 24% share | 6.5% CAGR
The sharpest re-rating of any region: Russia-proximate threat perception has turned NATO's 2%-of-GDP guideline into a 3.5% medium-term planning floor across Germany, France, UK, Italy, Poland and Turkey, making Europe's procurement pipeline grow faster than its current market share alone would suggest.
Asia-Pacific 27% share | 7.5% CAGR
The fastest-growing region in this report. China's regional posture and Indo-Pacific alliance-building are pulling India, Japan, South Korea and Australia into the steepest modernization pace of any bloc outside the US, while China's own industrial base scales on a different order of magnitude from every regional peer.
Middle East & Africa 8% share | 4.8% CAGR
Gulf missile-defence and counter-UAS demand dominates the region's procurement, with Saudi Arabia alone running one of the highest %GDP defence-spend ratios globally (~7.3%); the African portion of this region is driven chiefly by internal-security and border-protection needs rather than great-power competition.
South America 4% share | 4.2% CAGR
The smallest base in this report. Brazil leads a comparatively small but steadily growing market, with white-space opportunity concentrated in MRO and mid-tier platform upgrades rather than new-build procurement - a profile that rewards sustainment-focused suppliers over new-platform OEMs.
Read together, the regional split makes a specific strategic point: the two fastest-growing regions (Asia-Pacific and Europe) together already hold 51% of the market and are gaining share from the largest single region, North America. A go-to-market sequence built around "largest market first" undersells where the growth actually is over the 2025-2034 window.
Geographic Scope - Countries Covered by Region
| Region | Countries Covered (Representative) |
|---|---|
| North America | United States, Canada, Mexico |
| Europe | Germany, France, United Kingdom, Poland, Italy, Ukraine, Sweden, Turkey |
| Asia-Pacific | China, India, Japan, South Korea, Australia, Taiwan, Indonesia |
| Middle East & Africa | Saudi Arabia, UAE, Israel, Qatar, Egypt, South Africa |
| South America | Brazil, Argentina, Chile, Colombia |
Full country-level deep-dives (25 countries across all five regions) are covered in the complete report; Russia is tracked as a benchmark-only data point and excluded from regional market totals.
Defence Market Dynamics - Drivers, Restraints & Opportunities
Demand Driver Impact - MMR Analysis
Driver 1 - NATO's Structural Re-Rating: The shift from a 2%-of-GDP guideline to a 3.5% medium-term planning floor is already a binding planning assumption inside European finance ministries, not an aspiration. This is the single largest structural tailwind behind the European procurement pipeline, and it compounds annually rather than resetting.
Driver 2 - Autonomy & AI Adoption: UAV, UGV and swarm-system procurement lines have moved from innovation-budget pilots into mainline force-structure line items across every major buyer nation profiled in this report, making autonomous systems the single fastest-growing operation type through 2034.
Driver 3 - Rare-Earth & Semiconductor Chokepoint Risk: Paradoxically, the same concentration risk that threatens supply (Section 03) is itself driving demand - governments are now funding parallel domestic capacity explicitly because of the risk, which shows up in procurement budgets as a demand driver even though its origin is a supply-side vulnerability.
Restraints - Defence Market Challenges
Restraint 1: Budget Crowd-Out from Pension & Personnel Cost
Several top-25 spenders are "paper-rich, capability-poor" - personnel and pension costs are crowding out real procurement headroom. A rising headline budget does not automatically translate into rising addressable procurement spend if an increasing share of it is absorbed by legacy personnel obligations; this is one of the most common gaps between announced defence budgets and actual contract-award capacity.
Restraint 2: Program Delay & Cost-Overrun Risk
RFP-to-delivery timelines keep slipping across major platform categories, compressing the effective budget efficiency of even well-funded programs. For suppliers, this cuts both ways: it delays revenue recognition on new-build contracts, but it also extends the life - and the sustainment tail - of the legacy platforms still in service while replacements slip.
Restraint 3: Export-Control Tightening on Critical Components
US ITAR, EU dual-use rules and China's own rare-earth licensing regime are reshaping which supply corridors stay commercially viable. A component or subsystem that is freely tradeable today can become licensing-restricted within a single budget cycle, which is why export-control exposure is increasingly scored as a procurement-risk factor in its own right, not just a legal compliance checkbox.
Opportunities - White Space Roadmap, 2025-2034
Of these four, the component-level opportunity is the most underpriced relative to its addressable size: it inherits demand growth from every platform category simultaneously (Land, Air, Naval, Space) rather than depending on the fortunes of any single platform program, and its qualification-driven moat (Highlight 4, Section 03) means early entrants are difficult to displace once qualified. The localization-ready entry point is the fastest to execute, since EDIS, ReArm Europe and NDAA-linked domestic-content mandates are already active procurement criteria, not future policy.
Defence Market Key Developments - Latest News & Industry Updates
| Date | Company | Development | Impact |
|---|---|---|---|
| 2024 | Rheinmetall | Expanded ammunition and armoured-vehicle production capacity across Germany | Scaled European munitions output amid NATO's spending re-rating |
| 2024 | RTX | Secured major air-defence export contracts for Patriot and NASAMS systems | Reinforced US dominance in allied missile-defence exports |
| 2025 | Anduril Industries | Closed a large new funding round to scale autonomous-systems manufacturing | Accelerated capitalization of the US autonomy and software-defined defence sector |
| 2024-25 | Germany (Federal Government) | Enacted constitutional debt-brake reform to exempt higher defence spending | Validated NATO's structural shift toward a higher GDP-spend planning floor |
| 2025 | Rheinmetall / Lockheed Martin | Expanded joint-venture missile and munitions production facilities in Europe | Strengthened transatlantic defence-industrial integration |
| 2024-25 | Baykar | Expanded European drone-manufacturing footprint through acquisitions and new facilities | Intensified Turkish UAV competition inside the European market |
| 2025 | India (Ministry of Defence) | Advanced indigenous fighter and naval procurement programmes under Atmanirbhar Bharat | Reinforced India's shift toward domestic defence manufacturing and export ambitions |
| 2024 | Saab | Secured new Gripen fighter export orders from NATO-aligned buyers | Extended the Swedish OEM's export order book and European market share |
Entries are illustrative, sample developments compiled for this preview report; the complete report tracks 50+ developments per year across contracts, M&A, funding, programme milestones and regulatory actions, each independently verified before publication.
Defence Market Trade Flow & Top Country Markets
Top 5 Arms Exporters (% share)
Top 5 Arms Importers (% share)
The exporter table is far more concentrated than most buyers assume: the top 5 exporters alone account for more than two-thirds of everything that moves across borders, with the United States in a category of its own. That concentration is a strategic fact for a component supplier, not just a market-structure footnote - a company qualified into a US prime's supply chain is, by extension, qualified into a large share of global arms trade. On the importer side, Ukraine and India's top-two positions reflect very different dynamics: Ukraine's is an acute, conflict-driven surge, while India's is a structural, decade-long modernization program layered on top of an explicit indigenous-manufacturing push - the two require entirely different market-entry strategies even though they sit next to each other on this chart.
Defence Market - Top 10 Country Markets
| Country | Defence Budget (USD Bn) | % of GDP | Key Domestic OEM(s) |
|---|---|---|---|
| United States | XX | XX | Lockheed Martin, RTX, Northrop Grumman |
| China | XX | XX | NORINCO, AVIC, CASIC |
| Russia | XX | XX | Rostec, Almaz-Antey |
| India | XX | XX | HAL, BEL, Mazagon Dock |
| Germany | XX | XX | Rheinmetall, Hensoldt |
| United Kingdom | XX | XX | BAE Systems |
| Saudi Arabia | XX | XX | SAMI (emerging) |
| France | XX | XX | Dassault, Naval Group, Thales |
| Japan | XX | XX | Mitsubishi Heavy Industries |
| South Korea | XX | XX | Hanwha, KAI, Hyundai Rotem |
Budget and %GDP figures are placeholders pending the complete report's bottom-up/top-down triangulation. OEM mapping is MMR's own classification, illustrative.
Defence Market Competitive Landscape & Key Players
The complete report benchmarks the top 50 profiled companies on market share, revenue, backlog, technology capability and export dependency. The positioning map below plots 25 of them on market scale against technology innovation.
| Strategic Archetype | Revenue Scale | Backlog Quality | China/Rare-Earth Exposure | 2025-2034 Outlook |
|---|---|---|---|---|
| Scale Leader | Highest | Deep, funded | Medium | Margin pressure on new-build |
| Integrated Group | High | Strong | Medium | Scale advantage across domains |
| Specialty Innovator | Low-Medium | Fast-growing | Low | Best-positioned for premium growth |
| Niche Challenger | Low | Selective | Low | Niche premium, limited scale |
Scale Leaders dominate revenue but are the archetype most exposed to new-build margin pressure as autonomy and software-defined upgrades redraw where value is captured. Integrated Groups have structural advantages serving buyer nations that want a single supplier across Land, Naval and Air - a genuine moat for large program bundling, but one that moves slowly. Specialty Innovators are the best-positioned archetype for 2025-2034 premium growth precisely because their capability profile (low China/rare-earth exposure, fast-growing backlog, software-first cost structure) aligns with the highest-CAGR segments identified elsewhere in this report - autonomy, AI-enabled C4ISR, and counter-drone systems. Niche Challengers command the highest per-contract margins in categories where they hold a genuine technology or regulatory edge, but have limited scale to bid for the largest platform programs outright.
Capability Heatmap - Archetype vs. Core Dimensions
| Archetype | Platform Scale | Technology / Software | Export Reach | Price Competitiveness |
|---|---|---|---|---|
| Scale Leader | Highest | High | Highest | Low |
| Integrated Group | High | Medium-High | High | Medium |
| Specialty Innovator | Low-Medium | Highest | Medium | Medium-High |
| Niche Challenger | Low | Medium | Low-Medium | High |
Illustrative capability scoring, MMR analysis; full numeric scoring by company is available in the complete report.
Companies Profiled in This Report
37 of the 50+ companies benchmarked in the complete report, spanning every region and strategic archetype covered in this analysis.
| Company | HQ / Region | Primary Domain Focus | Archetype |
|---|---|---|---|
| Lockheed Martin | United States | Air, Missile Defence | Scale Leader |
| RTX (Raytheon) | United States | Missile Defence, C4ISR | Scale Leader |
| Northrop Grumman | United States | Air, Space | Scale Leader |
| Boeing Defense, Space & Security | United States | Air, Space | Scale Leader |
| General Dynamics | United States | Land, Naval | Scale Leader |
| L3Harris Technologies | United States | C4ISR, Electronics | Integrated Group |
| General Atomics | United States | Unmanned Systems | Specialty Innovator |
| Anduril Industries | United States | Autonomy, AI | Specialty Innovator |
| Oshkosh Defense | United States | Land Vehicles | Niche Challenger |
| BAE Systems | United Kingdom | Land, Naval, Air | Integrated Group |
| Rolls-Royce Defence | United Kingdom | Propulsion | Niche Challenger |
| Babcock International | United Kingdom | Naval, Sustainment | Niche Challenger |
| Thales | France | C4ISR, Electronics | Integrated Group |
| Dassault Aviation | France | Air | Scale Leader (regional) |
| Naval Group | France | Naval | Niche Challenger |
| Airbus Defence & Space | Europe (FR/DE) | Air, Space | Integrated Group |
| Rheinmetall | Germany | Land, Munitions | Scale Leader (regional) |
| Hensoldt | Germany | Radar, Sensors | Niche Challenger |
| Helsing | Germany | AI, Autonomy | Specialty Innovator |
| Leonardo S.p.A. | Italy | Air, Electronics | Integrated Group |
| Saab AB | Sweden | Air, C4ISR | Niche Challenger |
| Rostec | Russia | Land, Air | Scale Leader (regional) |
| Almaz-Antey | Russia | Missile Defence | Niche Challenger |
| Hindustan Aeronautics (HAL) | India | Air | Integrated Group |
| Bharat Electronics (BEL) | India | C4ISR, Electronics | Niche Challenger |
| Mazagon Dock Shipbuilders | India | Naval | Niche Challenger |
| Adani Defence & Aerospace | India | Unmanned Systems | Specialty Innovator |
| NORINCO | China | Land, Munitions | Scale Leader (regional) |
| AVIC | China | Air | Scale Leader (regional) |
| Elbit Systems | Israel | C4ISR, Unmanned | Integrated Group |
| IAI (Israel Aerospace Industries) | Israel | Air, Space, Unmanned | Integrated Group |
| Rafael Advanced Defense Systems | Israel | Missile Defence | Specialty Innovator |
| Hanwha Aerospace / Defense | South Korea | Land, Air | Integrated Group |
| Korea Aerospace Industries (KAI) | South Korea | Air | Niche Challenger |
| Mitsubishi Heavy Industries | Japan | Air, Naval | Integrated Group |
| Aselsan | Turkey | C4ISR, Electronics | Niche Challenger |
| Baykar | Turkey | Unmanned Systems | Specialty Innovator |
| SAMI | Saudi Arabia | Diversified (emerging) | Niche Challenger |
Archetype classification per MMR's Scale Leader / Integrated Group / Specialty Innovator / Niche Challenger framework (above). Full company-level revenue, backlog and technology-capability scoring is available in the complete report.
Defence Technology Innovation Radar & Hype Cycle
The strategic read on this curve matters more than the curve itself. Technologies at the Peak of Inflated Expectations (generative AI, quantum computing) attract the most funding headlines but the longest and least certain path to fielded procurement value - a buyer or investor anchoring a near-term thesis there is underwriting hype-cycle risk, not technology risk. The Slope of Enlightenment categories (zero-trust architecture, computer vision, digital twins, drone countermeasures) are where near-term, sub-two-year procurement payoff actually concentrates, and where this report's White-Space recommendations (Section 07) are weighted most heavily.
Strategic Posture Map - Where to Invest vs. Monitor
Illustrative strategic-posture classification, MMR analysis; the complete report scores each technology individually against capability gap, procurement readiness and cost trajectory.
Defence Market FAQ - Size, Growth, Trends & Key Players
What is the global defence market size and forecast?
The global defence market was valued at USD 2,735.58 Bn in 2025 and is forecast to reach USD 4,429.16 Bn by 2034, growing at a CAGR of 5.5%. That trajectory is underpinned by three independent, overlapping forces rather than one spending cycle: NATO's re-rating toward a 3.5%-of-GDP floor, China's Indo-Pacific posture, and Gulf missile-defence demand - see Section 04 for the full basis.
Which country spends the most on defence?
The United States, by a wide margin - more than the next several countries in this report's Top-10 Markets table combined, though at a lower percentage of GDP than some Gulf states despite the far larger absolute figure.
What's driving the shift toward autonomous and unmanned systems?
UAV, UGV and swarm-system procurement lines have moved from innovation-budget pilots into mainline force-structure line items across every major buyer nation profiled in this report. The Ukraine conflict compressed what NATO planners expected to be a 2030s doctrine shift into a live operational reality today, making autonomy the single fastest-growing operation type through 2034 (Section 05, D7).
Why is rare-earth supply chain risk a defence market issue?
China controls the majority of global rare-earth mining and processing capacity - inputs underneath most Western missile-guidance, radar and electronic-warfare systems. Only a small share of defence contractors report full Tier-1-to-Tier-3 supply-chain visibility, which means the risk is both large and largely unmeasured across the industry (Section 03, Highlight 2).
Which companies lead the global defence OEM landscape?
Lockheed Martin, RTX, BAE Systems, Rheinmetall and Thales lead by scale and backlog depth; Anduril, Helsing and Baykar lead the innovation-led challenger tier with the fastest-growing, lowest-China-exposure backlogs in this report's competitive benchmark (Section 10).
What is the component-level opportunity in the defence market?
Precision motion components - bearings, ball screws and actuation systems - sit underneath nearly every platform segmented in this report, but carry long qualification cycles that create a durable moat once a supplier is qualified in. This is identified as one of the most underpriced opportunities in the market relative to its addressable size (Section 03, Highlight 4; Section 07 opportunities).
How reliable are the figures in this sample report?
Market-size, CAGR and the 2034 forecast are MMR's base-case estimates. Country-level budget, trade and company figures marked "XX" are directional placeholders pending the full bottom-up/top-down triangulation and data validation in the complete report.
Defence Market Analyst Perspective & Strategic Outlook
Call 1: More NATO Members Will Miss the 3.5% Floor Than Headlines Suggest - and It's Still Bullish for Primes
Compliance will be uneven: fiscal headroom, coalition politics and election cycles mean several members will land closer to 2.5-3% than 3.5% by the mid-2030s. That is still the single largest upward re-rating of European procurement budgets in three decades, because the consensus baseline a few years ago assumed no structural change at all. The bullish case does not depend on universal compliance - it depends on direction, and the direction is not in serious dispute.
Call 2: Autonomous-Systems Procurement Overtakes Manned-Platform R&D Budgets Before 2030
Most OEM roadmaps still model autonomy as an adjacent R&D category sitting alongside core manned-platform investment. We think the crossover point - where autonomous and unmanned systems R&D exceeds manned-platform R&D in aggregate prime-contractor spend - arrives before 2030, not in the mid-2030s as most five-year plans assume, because force-structure budgets in the US, China and Turkey are already being redrawn around autonomy as the primary category, not the adjacent one.
Call 3: The Next Rare-Earth Export Restriction Reprices Western Missile-Guidance Programs Overnight
With only a small share of contractors reporting full Tier-1-to-Tier-3 supply-chain visibility, the market is structurally underpricing a risk that is a matter of when, not if. China has already demonstrated willingness to use rare-earth and critical-mineral licensing as a policy lever; the next restriction cycle - plausibly inside the 2027 horizon flagged by several Western governments - will move programs that currently treat rare-earth inputs as a line-item cost into active schedule risk within a single quarter.
Call 4: Mid-Tier Component Suppliers Out-Return Prime Contractors Through 2034
Bearings, ball screws and precision actuation sit at a higher point on the Margin Cascade than most of the platforms built on top of them, and carry none of the new-build cost-overrun risk that compresses prime-contractor margins. A qualified mid-tier component supplier captures sustainment-grade, multi-decade revenue without ever bidding for - or carrying the balance-sheet risk of - the platform program itself. We expect returns on capital in this tier to outperform the prime-contractor layer across the forecast window.
Call 5: India Will Outgrow Its Own Official Modernization Targets
India's Atmanirbhar Bharat indigenous-manufacturing push is consistently modeled by official five-year plans as a import-substitution story. We think the more consequential shift is India converting from a net arms importer into a credible mid-tier exporter faster than its own stated targets, on the back of HAL, BEL and Mazagon Dock's expanding export order books - a shift that changes who India's defence-industrial base competes against, not just who it buys from.