Computed Tomography Scanners Market – Global Industry Analysis and Forecast (2023-2029)

Computed Tomography Scanners Market was valued at US$ 6.77 Bn. in 2022. Global Computed Tomography Scanners Market size is expected to grow at a CAGR of 5.9 % through the forecast period.

Computed Tomography Scanners Market Overview:

The rising frequency of chronic illnesses such as cardiovascular, cancer, neurology, and orthopedic problems has resulted in a huge patient pool getting computed tomography scans. According to the National Center for Health Statistics, 1,898,160 new cancer cases will be documented in the United States in 2021. As a result, the rising global prevalence of cancer is boosting demand for computed tomography scanners throughout the forecast period. CT scans are a type of medical imaging that is frequently used in hospitals for diagnostic and therapeutic purposes. The demand for sophisticated imaging systems, such as computed tomography systems, is growing due to the increased prevalence of chronic disease and recent innovations in the healthcare industry.Computed Tomography Scanners Market 
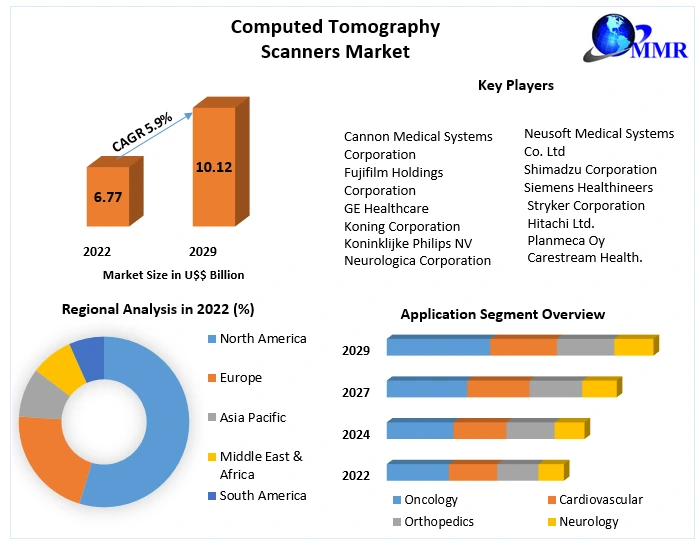
To know about the Research Methodology :- Request Free Sample Report

Computed Tomography Scanners Market COVID-19 Insights:

Due to the increased deployment of CT scanners for the care and diagnosis of patients suffering from coronavirus, the introduction of COVID-19 has hampered demand for computed tomography scanners. Because of the COVID-19 pandemic, key businesses in the industry saw a considerable boost in income. The rise of chronic disease as a modality for identifying COVID-19 patients is one of the key factors driving the proliferation of imaging equipment during the pandemic. According to an article published by AuntMinnie, the digital radiography sector had a unit revenue gain of over 80.0% in 2022, while the computed tomography scanner market saw a 9.3% increase. However, due to increasing demand for CT scanners during COVID-19, hospitals and diagnostic centers acquired more than projected in 2022. As a result, a major drop in demand was noticed in 2022. In terms of revenue, the market decreased by 14.9% in 2022.

Computed Tomography Scanners Market Dynamics:

Market Trends: One of the major factors stimulating market growth is the introduction of technologically advanced computed tomography scanners. The market's major players are always working on new technologically advanced products. CT scanners have cut hospital stays in half and improved cancer detection. CT scanning technology has improved in recent years, removing harmful radiation from patients while also increasing speed and image quality. The market's major players are launching technologically advanced products. Following the introduction of 64-slice CT systems, key market players developed higher-slice CT systems to improve image quality, reduce scanning times, and eliminate stitching artifacts, among other things. Only a few players are currently offering technologically advanced high-slice products on the market. In the market, some players are offering application-specific products. One of the most common uses of computed tomography scanners is cardiac imaging. Physicians are increasingly using CT angiography (CTA) to assess medical issues connected to the cardiovascular system. Market Drivers: The growing demand for CT scanners is being driven by the growing demand for early-stage diagnosis of chronic illnesses and the burgeoning healthcare infrastructure. This, together with the rising frequency of chronic diseases, is expected to have a considerable influence on demand for sophisticated imaging technologies, such as computed tomography. According to the American Heart Association, 121.5 million individuals in the United States suffered from cardiovascular disease in 2022. According to the British Heart Foundation, 7.6 million individuals in the United Kingdom will suffer from cardiovascular disease by 2022. The increased number of patients with chronic illnesses is likely to result in a bigger patient pool for imaging operations. During the forecast period, this is expected to boost the growth of computed tomography systems. In developing nations, improving healthcare infrastructure focuses on increasing the number of hospital beds to meet rising demand. As a result of the fast growth of healthcare infrastructure, as well as the rising frequency of chronic illnesses and a focus on early detection, the market for medical imaging equipment, particularly CT scanners, is seeing increased demand. This need is augmented by market participants' strong R&D focus, which has resulted in the development of new and technologically sophisticated equipment. Restraining Factors: One of the primary factors limiting the computed tomography (CT) scanner market's growth during the forecast period is the high cost of equipment maintenance and installation. The cost of acquiring computed tomography equipment is estimated to be between $300,000 and $2,000,000. The typical annual maintenance cost of a 16-slice basic scanner is roughly USD 60,000, whereas a high-end 128-slice scanner is well over USD 250,000. It is costly for small healthcare institutions because of the hefty yearly maintenance costs. As a result, the expensive capital necessary for the latest technologies, along with a huge and regulated used equipment business, has hampered the adoption of new and innovative items, particularly in emerging nations such as China, Brazil, Chile, Mexico, and India.

Computed Tomography Scanners Market Segment Analysis:

Based on Technology, in 2022, the low-slice segment dominated the market. The rising usage of low-slice scanners in emerging nations, as well as market players' established and robust product portfolios and new product releases in the low-slice category, are driving this segment's growth. Affordable-slice scanner technical developments and low prices in comparison to high-end equipment have aided in increasing demand for low-slice items across the industry. CBCT, on the other hand, is expected to grow at a significant CAGR throughout the forecast period. The growing use of CBCT scanners in dentistry, ENT, orthopaedics, and Inventional Radiology is estimated to fuel global demand for CBCT devices.Computed Tomography Scanners1
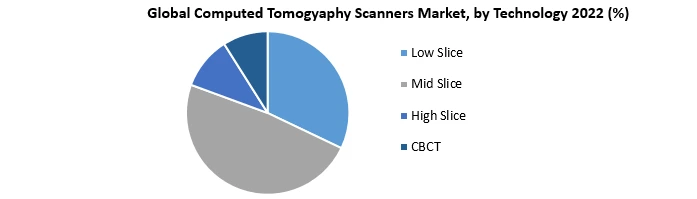
Based on the Application, in 2022, the oncology category was the most popular application. During the forecast period, it is also expected to grow at a faster rate than the other segments. Tumors and other malignant medical anomalies are frequently detected using computed tomography equipment. The rising prevalence of cancer and the growing number of applications of CT scanners in cancer diagnostics are the primary drivers of this segment's growth. Due to the increase in the elderly population and the rising incidence of cardiovascular illnesses among the general population, the cardiovascular segment is expected to grow at a considerable CAGR over the forecast period. Based on the Modality, in 2022, the O arm had the biggest market share in the modality sector. Demand for O-arm systems is driven by an increase in CT scan operations, increased use of novel solutions, and new product launches in this market. Because of its open architecture and convenient patient access, the C-arm sector is expected to grow considerably due to increased implementation of the C-arm in interventional surgical procedures. Based on the End User, in 2022, the end-user category of hospitals and ambulatory surgery centres (ASCs) maintained the biggest market share. During the forecast period, the hospitals and ambulatory surgery centres segment will rise because of the well-established healthcare sector in emerging areas; the rising number of hospitals in developing nations; and growing awareness about CT scans. Diagnostic imaging centres are expected to grow at a substantial rate since the majority of countries undertake imaging exams at diagnostic imaging centres.

Computed Tomography Scanners Market Regional Insights:

The North America region dominated the market with 40 % share in 2022. Because of the rising prevalence of inflammatory diseases, the presence of key players, the development of the healthcare sector, the presence of new innovative computed tomography systems, and advancements in computed tomography technology in the region, North America dominated the computed tomography market and is expected to continue to do so during the forecast period. According to an Amber Diagnostics article, 90 million CT scan treatments are conducted in the United States each year. This, together with advances in computed tomography technology, will propel market growth throughout the forecast period. The APAC region is expected to witness significant growth at a CAGR of 5.9% through the forecast period. The market is being driven by a growing elderly population and an increase in chronic illness occurrences, as well as a shift in medical treatment toward image-guided therapies and technological improvements. Japan has the fastest-aging population in the world. As the elderly population grows in the next few years, they will be more susceptible to chronic diseases like cancer, chronic renal disease, cardiovascular disease, respiratory disease, diabetes, and other diseases, which will boost the usage of CT procedures and thus the market's development. As a result, CT treatments are a preferred choice of imaging due to access to technology and relative cost when compared to other modalities. The objective of the report is to present a comprehensive analysis of the global Computed Tomography Scanners Market to the stakeholders in the industry. The past and current status of the industry with the forecasted market size and trends are presented in the report with the analysis of complicated data in simple language. The report covers all the aspects of the industry with a dedicated study of key players that include market leaders, followers, and new entrants. PORTER, PESTEL analysis with the potential impact of micro-economic factors of the market have been presented in the report. External as well as internal factors that are supposed to affect the business positively or negatively have been analyzed, which will give a clear futuristic view of the industry to the decision-makers. The reports also help in understanding the Computed Tomography Scanners Market dynamic, structure by analyzing the market segments and projecting the Computed Tomography Scanners Market size. Clear representation of competitive analysis of key players by Vehicle type, price, financial position, product portfolio, growth strategies, and regional presence in the Computed Tomography Scanners Market make the report investor’s guide.

Computed Tomography Scanners Market Scope: Inquire before buying

Global Computed Tomography Scanners Market
Report Coverage Details
Base Year: 2022 Forecast Period: 2023-2029
Historical Data: 2018 to 2022 Market Size in 2022: US $ 6.77 Bn.
Forecast Period 2023 to 2029 CAGR: 5.9% Market Size in 2029: US $10.12 Bn.
Segments Covered: by Technology Low Slice Mid Slice High Slice CBCT
by Application Oncology Cardiovascular Orthopedics Neurology
by Modality Oncology Cardiovascular Orthopedics Neurology
by End-User Hospitals and ASCs Diagnostics Imaging Centers

Computed Tomography Scanners Market by Region

North America (United States, Canada and Mexico) Europe (UK, France, Germany, Italy, Spain, Sweden, Austria and Rest of Europe) Asia Pacific (China, South Korea, Japan, India, Australia, Indonesia, Malaysia, Vietnam, Taiwan, Bangladesh, Pakistan and Rest of APAC) Middle East and Africa (South Africa, GCC, Egypt, Nigeria and Rest of ME&A) South America (Brazil, Argentina Rest of South America)

Computed Tomography Scanners Market Key Players

1. Cannon Medical Systems Corporation 2. Fujifilm Holdings Corporation 3. GE Healthcare 4. Koning Corporation 5. Koninklijke Philips NV 6. Neurologica Corporation 7. Neusoft Medical Systems Co. Ltd 8. Shimadzu Corporation 9. Siemens Healthineers 10. Stryker Corporation 11. Hitachi Ltd. 12. Planmeca Oy 13. Carestream Health Frequently Asked Questions: 1] What segments are covered in the Global Computed Tomography Scanners Market report? Ans. The segments covered in the Computed Tomography Scanners Market report are based on Product Technology, Application, Modality and End User. 2] Which region is expected to hold the highest share in the Global Computed Tomography Scanners Market? Ans. The North America region is expected to hold the highest share in the Computed Tomography Scanners Market. 3] What is the market size of the Global Computed Tomography Scanners Market by 2029? Ans. The market size of the Computed Tomography Scanners Market by 2029 is expected to reach US$ 10.12 Bn. 4] What is the forecast period for the Global Computed Tomography Scanners Market? Ans. The forecast period for the Computed Tomography Scanners Market is 2023-2029. 5] What was the market size of the Global Computed Tomography Scanners Market in 2022? Ans. The market size of the Computed Tomography Scanners Market in 2022 was valued at US$ 6.4 Bn.
1. Computed Tomography Scanners Market Introduction 1.1. Study Assumption and Market Definition 1.2. Scope of the Study 1.3. Executive Summary 2. Computed Tomography Scanners Market: Dynamics 2.1. Computed Tomography Scanners Market Trends by Region 2.1.1. North America Computed Tomography Scanners Market Trends 2.1.2. Europe Computed Tomography Scanners Market Trends 2.1.3. Asia Pacific Computed Tomography Scanners Market Trends 2.1.4. Middle East and Africa Computed Tomography Scanners Market Trends 2.1.5. South America Computed Tomography Scanners Market Trends 2.2. Computed Tomography Scanners Market Dynamics by Region 2.2.1. North America 2.2.1.1. North America Computed Tomography Scanners Market Drivers 2.2.1.2. North America Computed Tomography Scanners Market Restraints 2.2.1.3. North America Computed Tomography Scanners Market Opportunities 2.2.1.4. North America Computed Tomography Scanners Market Challenges 2.2.2. Europe 2.2.2.1. Europe Computed Tomography Scanners Market Drivers 2.2.2.2. Europe Computed Tomography Scanners Market Restraints 2.2.2.3. Europe Computed Tomography Scanners Market Opportunities 2.2.2.4. Europe Computed Tomography Scanners Market Challenges 2.2.3. Asia Pacific 2.2.3.1. Asia Pacific Computed Tomography Scanners Market Drivers 2.2.3.2. Asia Pacific Computed Tomography Scanners Market Restraints 2.2.3.3. Asia Pacific Computed Tomography Scanners Market Opportunities 2.2.3.4. Asia Pacific Computed Tomography Scanners Market Challenges 2.2.4. Middle East and Africa 2.2.4.1. Middle East and Africa Computed Tomography Scanners Market Drivers 2.2.4.2. Middle East and Africa Computed Tomography Scanners Market Restraints 2.2.4.3. Middle East and Africa Computed Tomography Scanners Market Opportunities 2.2.4.4. Middle East and Africa Computed Tomography Scanners Market Challenges 2.2.5. South America 2.2.5.1. South America Computed Tomography Scanners Market Drivers 2.2.5.2. South America Computed Tomography Scanners Market Restraints 2.2.5.3. South America Computed Tomography Scanners Market Opportunities 2.2.5.4. South America Computed Tomography Scanners Market Challenges 2.3. PORTER’s Five Forces Analysis 2.4. PESTLE Analysis 2.5. Technology Roadmap 2.6. Regulatory Landscape by Region 2.6.1. North America 2.6.2. Europe 2.6.3. Asia Pacific 2.6.4. Middle East and Africa 2.6.5. South America 2.7. Key Opinion Leader Analysis For Computed Tomography Scanners Industry 2.8. Analysis of Government Schemes and Initiatives For Computed Tomography Scanners Industry 2.9. Computed Tomography Scanners Market Trade Analysis 2.10. The Global Pandemic Impact on Computed Tomography Scanners Market 3. Computed Tomography Scanners Market: Global Market Size and Forecast by Segmentation by Demand and Supply Side (by Value in USD Million) 2022-2029 3.1. Computed Tomography Scanners Market Size and Forecast, by Technology (2022-2029) 3.1.1. Low Slice 3.1.2. Mid Slice 3.1.3. High Slice 3.1.4. CBCT 3.2. Computed Tomography Scanners Market Size and Forecast, by Application (2022-2029) 3.2.1. Oncology 3.2.2. Cardiovascular 3.2.3. Orthopedics 3.2.4. Neurology 3.3. Computed Tomography Scanners Market Size and Forecast, by Modality (2022-2029) 3.3.1. Oncology 3.3.2. Cardiovascular 3.3.3. Orthopedics 3.3.4. Neurology 3.4. Computed Tomography Scanners Market Size and Forecast, by End-User (2022-2029) 3.4.1. Hospitals and ASCs 3.4.2. Diagnostics Imaging Centers 3.5. Computed Tomography Scanners Market Size and Forecast, by Region (2022-2029) 3.5.1. North America 3.5.2. Europe 3.5.3. Asia Pacific 3.5.4. Middle East and Africa 3.5.5. South America 4. North America Computed Tomography Scanners Market Size and Forecast by Segmentation (by Value in USD Million) 2022-2029 4.1. North America Computed Tomography Scanners Market Size and Forecast, by Technology (2022-2029) 4.1.1. Low Slice 4.1.2. Mid Slice 4.1.3. High Slice 4.1.4. CBCT 4.2. North America Computed Tomography Scanners Market Size and Forecast, by Application (2022-2029) 4.2.1. Oncology 4.2.2. Cardiovascular 4.2.3. Orthopedics 4.2.4. Neurology 4.3. North America Computed Tomography Scanners Market Size and Forecast, by Modality (2022-2029) 4.3.1. Oncology 4.3.2. Cardiovascular 4.3.3. Orthopedics 4.3.4. Neurology 4.4. North America Computed Tomography Scanners Market Size and Forecast, by End-User (2022-2029) 4.4.1. Hospitals and ASCs 4.4.2. Diagnostics Imaging Centers 4.5. North America Computed Tomography Scanners Market Size and Forecast, by Country (2022-2029) 4.5.1. United States 4.5.1.1. United States Computed Tomography Scanners Market Size and Forecast, by Technology (2022-2029) 4.5.1.1.1. Low Slice 4.5.1.1.2. Mid Slice 4.5.1.1.3. High Slice 4.5.1.1.4. CBCT 4.5.1.2. United States Computed Tomography Scanners Market Size and Forecast, by Application (2022-2029) 4.5.1.2.1. Oncology 4.5.1.2.2. Cardiovascular 4.5.1.2.3. Orthopedics 4.5.1.2.4. Neurology 4.5.1.3. United States Computed Tomography Scanners Market Size and Forecast, by Modality (2022-2029) 4.5.1.3.1. Oncology 4.5.1.3.2. Cardiovascular 4.5.1.3.3. Orthopedics 4.5.1.3.4. Neurology 4.5.1.4. United States Computed Tomography Scanners Market Size and Forecast, by End-User (2022-2029) 4.5.1.4.1. Hospitals and ASCs 4.5.1.4.2. Diagnostics Imaging Centers 4.5.2. Canada 4.5.2.1. Canada Computed Tomography Scanners Market Size and Forecast, by Technology (2022-2029) 4.5.2.1.1. Low Slice 4.5.2.1.2. Mid Slice 4.5.2.1.3. High Slice 4.5.2.1.4. CBCT 4.5.2.2. Canada Computed Tomography Scanners Market Size and Forecast, by Application (2022-2029) 4.5.2.2.1. Oncology 4.5.2.2.2. Cardiovascular 4.5.2.2.3. Orthopedics 4.5.2.2.4. Neurology 4.5.2.3. Canada Computed Tomography Scanners Market Size and Forecast, by Modality (2022-2029) 4.5.2.3.1. Oncology 4.5.2.3.2. Cardiovascular 4.5.2.3.3. Orthopedics 4.5.2.3.4. Neurology 4.5.2.4. Canada Computed Tomography Scanners Market Size and Forecast, by End-User (2022-2029) 4.5.2.4.1. Hospitals and ASCs 4.5.2.4.2. Diagnostics Imaging Centers 4.5.3. Mexico 4.5.3.1. Mexico Computed Tomography Scanners Market Size and Forecast, by Technology (2022-2029) 4.5.3.1.1. Low Slice 4.5.3.1.2. Mid Slice 4.5.3.1.3. High Slice 4.5.3.1.4. CBCT 4.5.3.2. Mexico Computed Tomography Scanners Market Size and Forecast, by Application (2022-2029) 4.5.3.2.1. Oncology 4.5.3.2.2. Cardiovascular 4.5.3.2.3. Orthopedics 4.5.3.2.4. Neurology 4.5.3.3. Mexico Computed Tomography Scanners Market Size and Forecast, by Modality (2022-2029) 4.5.3.3.1. Oncology 4.5.3.3.2. Cardiovascular 4.5.3.3.3. Orthopedics 4.5.3.3.4. Neurology 4.5.3.4. Mexico Computed Tomography Scanners Market Size and Forecast, by End-User (2022-2029) 4.5.3.4.1. Hospitals and ASCs 4.5.3.4.2. Diagnostics Imaging Centers 5. Europe Computed Tomography Scanners Market Size and Forecast by Segmentation (by Value in USD Million) 2022-2029 5.1. Europe Computed Tomography Scanners Market Size and Forecast, by Technology (2022-2029) 5.2. Europe Computed Tomography Scanners Market Size and Forecast, by Application (2022-2029) 5.3. Europe Computed Tomography Scanners Market Size and Forecast, by Modality (2022-2029) 5.4. Europe Computed Tomography Scanners Market Size and Forecast, by End-User (2022-2029) 5.5. Europe Computed Tomography Scanners Market Size and Forecast, by Country (2022-2029) 5.5.1. United Kingdom 5.5.1.1. United Kingdom Computed Tomography Scanners Market Size and Forecast, by Technology (2022-2029) 5.5.1.2. United Kingdom Computed Tomography Scanners Market Size and Forecast, by Application (2022-2029) 5.5.1.3. United Kingdom Computed Tomography Scanners Market Size and Forecast, by Modality (2022-2029) 5.5.1.4. United Kingdom Computed Tomography Scanners Market Size and Forecast, by End-User (2022-2029) 5.5.2. France 5.5.2.1. France Computed Tomography Scanners Market Size and Forecast, by Technology (2022-2029) 5.5.2.2. France Computed Tomography Scanners Market Size and Forecast, by Application (2022-2029) 5.5.2.3. France Computed Tomography Scanners Market Size and Forecast, by Modality (2022-2029) 5.5.2.4. France Computed Tomography Scanners Market Size and Forecast, by End-User (2022-2029) 5.5.3. Germany 5.5.3.1. Germany Computed Tomography Scanners Market Size and Forecast, by Technology (2022-2029) 5.5.3.2. Germany Computed Tomography Scanners Market Size and Forecast, by Application (2022-2029) 5.5.3.3. Germany Computed Tomography Scanners Market Size and Forecast, by Modality (2022-2029) 5.5.3.4. Germany Computed Tomography Scanners Market Size and Forecast, by End-User (2022-2029) 5.5.4. Italy 5.5.4.1. Italy Computed Tomography Scanners Market Size and Forecast, by Technology (2022-2029) 5.5.4.2. Italy Computed Tomography Scanners Market Size and Forecast, by Application (2022-2029) 5.5.4.3. Italy Computed Tomography Scanners Market Size and Forecast, by Modality (2022-2029) 5.5.4.4. Italy Computed Tomography Scanners Market Size and Forecast, by End-User (2022-2029) 5.5.5. Spain 5.5.5.1. Spain Computed Tomography Scanners Market Size and Forecast, by Technology (2022-2029) 5.5.5.2. Spain Computed Tomography Scanners Market Size and Forecast, by Application (2022-2029) 5.5.5.3. Spain Computed Tomography Scanners Market Size and Forecast, by Modality (2022-2029) 5.5.5.4. Spain Computed Tomography Scanners Market Size and Forecast, by End-User (2022-2029) 5.5.6. Sweden 5.5.6.1. Sweden Computed Tomography Scanners Market Size and Forecast, by Technology (2022-2029) 5.5.6.2. Sweden Computed Tomography Scanners Market Size and Forecast, by Application (2022-2029) 5.5.6.3. Sweden Computed Tomography Scanners Market Size and Forecast, by Modality (2022-2029) 5.5.6.4. Sweden Computed Tomography Scanners Market Size and Forecast, by End-User (2022-2029) 5.5.7. Austria 5.5.7.1. Austria Computed Tomography Scanners Market Size and Forecast, by Technology (2022-2029) 5.5.7.2. Austria Computed Tomography Scanners Market Size and Forecast, by Application (2022-2029) 5.5.7.3. Austria Computed Tomography Scanners Market Size and Forecast, by Modality (2022-2029) 5.5.7.4. Austria Computed Tomography Scanners Market Size and Forecast, by End-User (2022-2029) 5.5.8. Rest of Europe 5.5.8.1. Rest of Europe Computed Tomography Scanners Market Size and Forecast, by Technology (2022-2029) 5.5.8.2. Rest of Europe Computed Tomography Scanners Market Size and Forecast, by Application (2022-2029) 5.5.8.3. Rest of Europe Computed Tomography Scanners Market Size and Forecast, by Modality (2022-2029) 5.5.8.4. Rest of Europe Computed Tomography Scanners Market Size and Forecast, by End-User (2022-2029) 6. Asia Pacific Computed Tomography Scanners Market Size and Forecast by Segmentation (by Value in USD Million) 2022-2029 6.1. Asia Pacific Computed Tomography Scanners Market Size and Forecast, by Technology (2022-2029) 6.2. Asia Pacific Computed Tomography Scanners Market Size and Forecast, by Application (2022-2029) 6.3. Asia Pacific Computed Tomography Scanners Market Size and Forecast, by Modality (2022-2029) 6.4. Asia Pacific Computed Tomography Scanners Market Size and Forecast, by End-User (2022-2029) 6.5. Asia Pacific Computed Tomography Scanners Market Size and Forecast, by Country (2022-2029) 6.5.1. China 6.5.1.1. China Computed Tomography Scanners Market Size and Forecast, by Technology (2022-2029) 6.5.1.2. China Computed Tomography Scanners Market Size and Forecast, by Application (2022-2029) 6.5.1.3. China Computed Tomography Scanners Market Size and Forecast, by Modality (2022-2029) 6.5.1.4. China Computed Tomography Scanners Market Size and Forecast, by End-User (2022-2029) 6.5.2. S Korea 6.5.2.1. S Korea Computed Tomography Scanners Market Size and Forecast, by Technology (2022-2029) 6.5.2.2. S Korea Computed Tomography Scanners Market Size and Forecast, by Application (2022-2029) 6.5.2.3. S Korea Computed Tomography Scanners Market Size and Forecast, by Modality (2022-2029) 6.5.2.4. S Korea Computed Tomography Scanners Market Size and Forecast, by End-User (2022-2029) 6.5.3. Japan 6.5.3.1. Japan Computed Tomography Scanners Market Size and Forecast, by Technology (2022-2029) 6.5.3.2. Japan Computed Tomography Scanners Market Size and Forecast, by Application (2022-2029) 6.5.3.3. Japan Computed Tomography Scanners Market Size and Forecast, by Modality (2022-2029) 6.5.3.4. Japan Computed Tomography Scanners Market Size and Forecast, by End-User (2022-2029) 6.5.4. India 6.5.4.1. India Computed Tomography Scanners Market Size and Forecast, by Technology (2022-2029) 6.5.4.2. India Computed Tomography Scanners Market Size and Forecast, by Application (2022-2029) 6.5.4.3. India Computed Tomography Scanners Market Size and Forecast, by Modality (2022-2029) 6.5.4.4. India Computed Tomography Scanners Market Size and Forecast, by End-User (2022-2029) 6.5.5. Australia 6.5.5.1. Australia Computed Tomography Scanners Market Size and Forecast, by Technology (2022-2029) 6.5.5.2. Australia Computed Tomography Scanners Market Size and Forecast, by Application (2022-2029) 6.5.5.3. Australia Computed Tomography Scanners Market Size and Forecast, by Modality (2022-2029) 6.5.5.4. Australia Computed Tomography Scanners Market Size and Forecast, by End-User (2022-2029) 6.5.6. Indonesia 6.5.6.1. Indonesia Computed Tomography Scanners Market Size and Forecast, by Technology (2022-2029) 6.5.6.2. Indonesia Computed Tomography Scanners Market Size and Forecast, by Application (2022-2029) 6.5.6.3. Indonesia Computed Tomography Scanners Market Size and Forecast, by Modality (2022-2029) 6.5.6.4. Indonesia Computed Tomography Scanners Market Size and Forecast, by End-User (2022-2029) 6.5.7. Malaysia 6.5.7.1. Malaysia Computed Tomography Scanners Market Size and Forecast, by Technology (2022-2029) 6.5.7.2. Malaysia Computed Tomography Scanners Market Size and Forecast, by Application (2022-2029) 6.5.7.3. Malaysia Computed Tomography Scanners Market Size and Forecast, by Modality (2022-2029) 6.5.7.4. Malaysia Computed Tomography Scanners Market Size and Forecast, by End-User (2022-2029) 6.5.8. Vietnam 6.5.8.1. Vietnam Computed Tomography Scanners Market Size and Forecast, by Technology (2022-2029) 6.5.8.2. Vietnam Computed Tomography Scanners Market Size and Forecast, by Application (2022-2029) 6.5.8.3. Vietnam Computed Tomography Scanners Market Size and Forecast, by Modality (2022-2029) 6.5.8.4. Vietnam Computed Tomography Scanners Market Size and Forecast, by End-User (2022-2029) 6.5.9. Taiwan 6.5.9.1. Taiwan Computed Tomography Scanners Market Size and Forecast, by Technology (2022-2029) 6.5.9.2. Taiwan Computed Tomography Scanners Market Size and Forecast, by Application (2022-2029) 6.5.9.3. Taiwan Computed Tomography Scanners Market Size and Forecast, by Modality (2022-2029) 6.5.9.4. Taiwan Computed Tomography Scanners Market Size and Forecast, by End-User (2022-2029) 6.5.10. Rest of Asia Pacific 6.5.10.1. Rest of Asia Pacific Computed Tomography Scanners Market Size and Forecast, by Technology (2022-2029) 6.5.10.2. Rest of Asia Pacific Computed Tomography Scanners Market Size and Forecast, by Application (2022-2029) 6.5.10.3. Rest of Asia Pacific Computed Tomography Scanners Market Size and Forecast, by Modality (2022-2029) 6.5.10.4. Rest of Asia Pacific Computed Tomography Scanners Market Size and Forecast, by End-User (2022-2029) 7. Middle East and Africa Computed Tomography Scanners Market Size and Forecast by Segmentation (by Value in USD Million) 2022-2029 7.1. Middle East and Africa Computed Tomography Scanners Market Size and Forecast, by Technology (2022-2029) 7.2. Middle East and Africa Computed Tomography Scanners Market Size and Forecast, by Application (2022-2029) 7.3. Middle East and Africa Computed Tomography Scanners Market Size and Forecast, by Modality (2022-2029) 7.4. Middle East and Africa Computed Tomography Scanners Market Size and Forecast, by End-User (2022-2029) 7.5. Middle East and Africa Computed Tomography Scanners Market Size and Forecast, by Country (2022-2029) 7.5.1. South Africa 7.5.1.1. South Africa Computed Tomography Scanners Market Size and Forecast, by Technology (2022-2029) 7.5.1.2. South Africa Computed Tomography Scanners Market Size and Forecast, by Application (2022-2029) 7.5.1.3. South Africa Computed Tomography Scanners Market Size and Forecast, by Modality (2022-2029) 7.5.1.4. South Africa Computed Tomography Scanners Market Size and Forecast, by End-User (2022-2029) 7.5.2. GCC 7.5.2.1. GCC Computed Tomography Scanners Market Size and Forecast, by Technology (2022-2029) 7.5.2.2. GCC Computed Tomography Scanners Market Size and Forecast, by Application (2022-2029) 7.5.2.3. GCC Computed Tomography Scanners Market Size and Forecast, by Modality (2022-2029) 7.5.2.4. GCC Computed Tomography Scanners Market Size and Forecast, by End-User (2022-2029) 7.5.3. Nigeria 7.5.3.1. Nigeria Computed Tomography Scanners Market Size and Forecast, by Technology (2022-2029) 7.5.3.2. Nigeria Computed Tomography Scanners Market Size and Forecast, by Application (2022-2029) 7.5.3.3. Nigeria Computed Tomography Scanners Market Size and Forecast, by Modality (2022-2029) 7.5.3.4. Nigeria Computed Tomography Scanners Market Size and Forecast, by End-User (2022-2029) 7.5.4. Rest of ME&A 7.5.4.1. Rest of ME&A Computed Tomography Scanners Market Size and Forecast, by Technology (2022-2029) 7.5.4.2. Rest of ME&A Computed Tomography Scanners Market Size and Forecast, by Application (2022-2029) 7.5.4.3. Rest of ME&A Computed Tomography Scanners Market Size and Forecast, by Modality (2022-2029) 7.5.4.4. Rest of ME&A Computed Tomography Scanners Market Size and Forecast, by End-User (2022-2029) 8. South America Computed Tomography Scanners Market Size and Forecast by Segmentation (by Value in USD Million) 2022-2029 8.1. South America Computed Tomography Scanners Market Size and Forecast, by Technology (2022-2029) 8.2. South America Computed Tomography Scanners Market Size and Forecast, by Application (2022-2029) 8.3. South America Computed Tomography Scanners Market Size and Forecast, by Modality(2022-2029) 8.4. South America Computed Tomography Scanners Market Size and Forecast, by End-User (2022-2029) 8.5. South America Computed Tomography Scanners Market Size and Forecast, by Country (2022-2029) 8.5.1. Brazil 8.5.1.1. Brazil Computed Tomography Scanners Market Size and Forecast, by Technology (2022-2029) 8.5.1.2. Brazil Computed Tomography Scanners Market Size and Forecast, by Application (2022-2029) 8.5.1.3. Brazil Computed Tomography Scanners Market Size and Forecast, by Modality (2022-2029) 8.5.1.4. Brazil Computed Tomography Scanners Market Size and Forecast, by End-User (2022-2029) 8.5.2. Argentina 8.5.2.1. Argentina Computed Tomography Scanners Market Size and Forecast, by Technology (2022-2029) 8.5.2.2. Argentina Computed Tomography Scanners Market Size and Forecast, by Application (2022-2029) 8.5.2.3. Argentina Computed Tomography Scanners Market Size and Forecast, by Modality (2022-2029) 8.5.2.4. Argentina Computed Tomography Scanners Market Size and Forecast, by End-User (2022-2029) 8.5.3. Rest Of South America 8.5.3.1. Rest Of South America Computed Tomography Scanners Market Size and Forecast, by Technology (2022-2029) 8.5.3.2. Rest Of South America Computed Tomography Scanners Market Size and Forecast, by Application (2022-2029) 8.5.3.3. Rest Of South America Computed Tomography Scanners Market Size and Forecast, by Modality (2022-2029) 8.5.3.4. Rest Of South America Computed Tomography Scanners Market Size and Forecast, by End-User (2022-2029) 9. Global Computed Tomography Scanners Market: Competitive Landscape 9.1. MMR Competition Matrix 9.2. Competitive Landscape 9.3. Key Players Benchmarking 9.3.1. Company Name 9.3.2. Business Segment 9.3.3. End-user Segment 9.3.4. Revenue (2022) 9.3.5. Company Locations 9.4. Leading Computed Tomography Scanners Market Companies, by market capitalization 9.5. Market Structure 9.5.1. Market Leaders 9.5.2. Market Followers 9.5.3. Emerging Players 9.6. Mergers and Acquisitions Details 10. Company Profile: Key Players 10.1. Cannon Medical Systems Corporation 10.1.1. Company Overview 10.1.2. Business Portfolio 10.1.3. Financial Overview 10.1.4. SWOT Analysis 10.1.5. Strategic Analysis 10.1.6. Scale of Operation (small, medium, and large) 10.1.7. Details on Partnership 10.1.8. Regulatory Accreditations and Certifications Received by Them 10.1.9. Awards Received by the Firm 10.1.10. Recent Developments 10.2. Fujifilm Holdings Corporation 10.3. GE Healthcare 10.4. Koning Corporation 10.5. Koninklijke Philips NV 10.6. Neurologica Corporation 10.7. Neusoft Medical Systems Co. Ltd 10.8. Shimadzu Corporation 10.9. Siemens Healthineers 10.10. Stryker Corporation 10.11. Hitachi Ltd. 10.12. Planmeca Oy 10.13. Carestream Health 11. Key Findings 12. Industry Recommendations 13. Computed Tomography Scanners Market: Research Methodology 14. Terms and Glossary
  • INQUIRE BEFORE BUYING