
Bromine Market Size by Type, Application, End Use Industry, Region – Segment-Level Market Assessment, Growth Opportunity Analysis, Competitive Mapping & Forecast to 2032
Overview
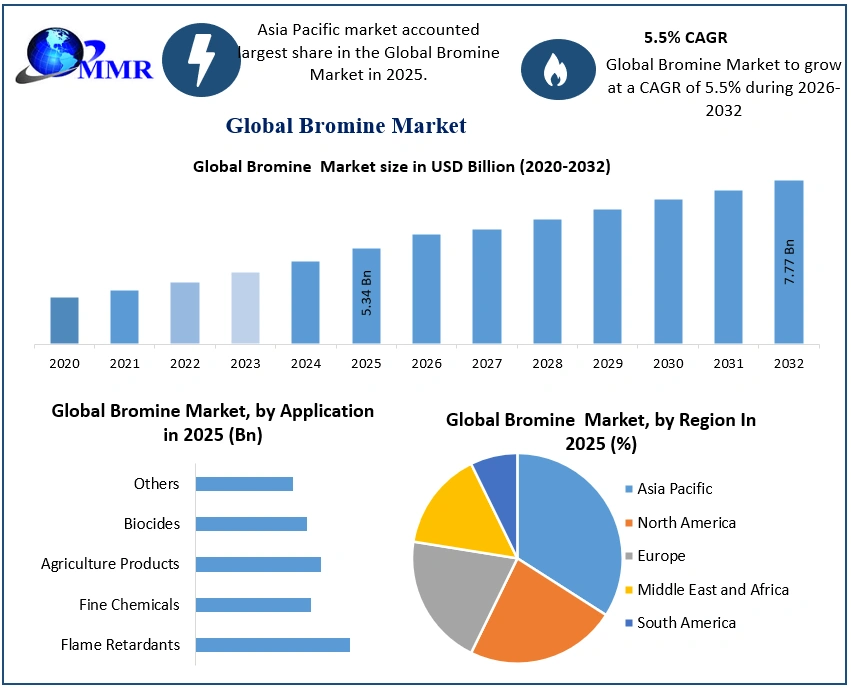
The Bromine Market size was valued at USD 5.34 Bn in 2025 and the total Bromine revenue is expected to grow at a CAGR of 4.7% from 2025 to 2032, reaching nearly USD 7.77 Bn by 2032.
Bromine Market Overview
Bromine is found in inorganic or natural organo-bromine compounds, and bromine compounds can be found in natural sources such as soil, salt, and seawater. It is part of the halogen group of the periodic table. Bromine is a reddish-brown liquid and it is never naturally found in its elemental form but in inorganic compounds, also known as bromides. Bromines are found in soils, salts, air, and seawater.
 To know about the Research Methodology :- Request Free Sample Report
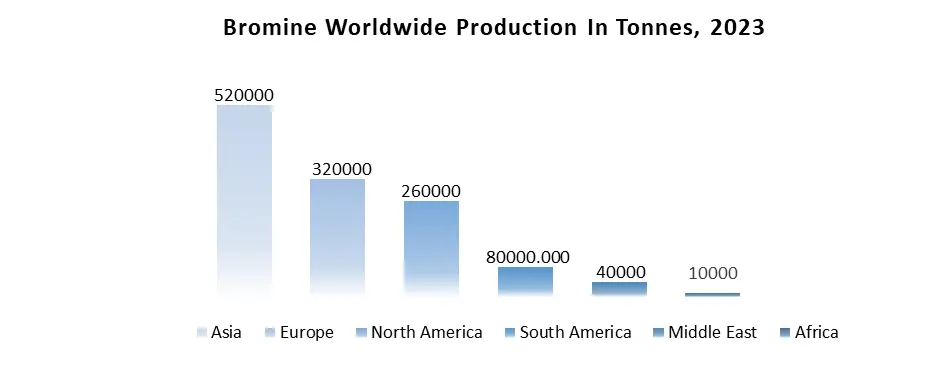
1. Global production is estimated to be around 330,000 tons in 2023. About 30% of the bromine in the atmosphere comes from human activities, the rest is natural.
2. China has almost 4,000 shopping centers, while 7,000 more are estimated to be open by 2027.
3. The five largest producers account for 85% of the world's bromine production, mainly through two natural resources (the Dead Sea – Israel and Jordan, and the US – Albemarle and Lanxess).
More than 50% of the world’s bromine comes from the Dead Sea. Rising construction activities globally are enhancing the demand for bromine compounds in the aforementioned applications. For instance, China is one of the leading countries concerning the construction of shopping centers. Companies are increasingly investing in technologies that enable the recycling of bromine and its derivatives, especially from waste streams and after-use applications. Bromine, along with nickel, vanadium, aluminum, arsenic, and silicon, is one of the elements that most often leads to an increased risk to human health.
Bromine Market Dynamics
The Surge of Bromine Market: Riding on the Wave of Technological Advancements, Growing Demand in Manufacturing, and Essential Role in Oil, Gas, and Flame Retardant Industries
The growing demand for Technology has led to an increase in the manufacturing, residential, and automotive sectors, and this has resulted in a surge in market growth. The bromine market is likely to grow since more people are using disinfectants and biocides. The growth of oil and gas-related activities like drilling fluids is another big thing that is driving the growth of the bromine market. In the oil and gas drilling process, bromine is often used to make clear brines. All of these are expected to help the bromine market grow over the forecast period. The growing global flame retardants market highlights the importance of fire safety to prevent injuries and trauma, protect property, and save lives while ensuring extended product lifecycles contribute to sustainability. Bromine-based products are ideal solutions for water treatment applications thanks to bromine’s ability to kill harmful contaminants by combining with bacteria and other living organisms in water. Neogen is a leading manufacturer of bromine- and lithium-based specialty chemicals, which go into a host of end-user industries like pharma, agrochemicals, engineering liquids, electronic chemicals, aroma chemicals, flavors and fragrances, specialty polymers, and cooling Medium.
Bromine-Based Storage Technologies Revolutionize Renewable Energy Integration and Grid Stability
Bromine-based storage technologies are a highly efficient and cost-effective, electro-chemical energy storage solution providing a range of options to successfully manage energy from renewable sources, minimizing energy loss, reducing overall energy use, cost, and safeguarding the security of supply. Typical bromine-based flow batteries include zinc-bromine (Zn-Br) and more recently hydrogen bromide (HBr). Other variants in flow battery technology using bromine are also under development. Bromine-based storage technologies are typically used in stationary storage applications for grid, facility, or backup/standby storage. There are some large sites around the world using Bromine flow batteries to help balance energy deficiency.
1. For example, the US Department of Defense uses zinc-bromine batteries for its military microgrid at the Marine Corps Air Station in Miramar California.
Bromine Market Segment Analysis:
By Application, the Flame Retardants segment is expected to grow at a CAGR of 5.2% in the forecast period (2024-2030). The total global Flame Retardant market has an estimated annual volume of approximately 2.0 billion lb. (about 909,000 t), valued at USD 2.2 billion. The growing demand for flame retardants highlights the importance of fire safety to prevent injuries and trauma, protect property, and save lives while ensuring extended product lifecycles contribute to sustainability. The consumption of bromine in FRs has risen steadily over the last several decades, mostly because of the increased use of electronics and communications products. Concerns about environmental issues have led to regulations and restrictions in various regions. The plastics industry is a significant consumer of nitrogen-based flame retardants. A wide variety of construction applications, including residential dwellings, apartment buildings, commercial structures, and industrial facilities, use flame-retardant materials.
By type, the Organobromine Market is the highest-growing market with a CAGR of 5.20% and an estimated value is USD 2.5 Billion by 2030. Pharmaceuticals like nicergolone and brotizolam as well as the anticancer drug pipobroman are made using organobromines as intermediates. The increase in the oil and gas exploration activities in the U.S., Brazil, Mexico, Saudi Arabia, China, Russia, Norway, and other oil-gas-rich nations has led to growth in the Bromine market.

Bromine Market Regional Insights:
Asia Pacific region holds a significant share in the bromine derivatives market with a market share of 45% in 2025 and is expected to grow with a CAGR of 5.10%, driven by rapid industrialization and urbanization in countries like China and India. In India, according to the Ministry of Statistics and Program Implementation's Infrastructure and Project Monitoring Division, the government had 1,559 projects in the pipeline valued at INR 26.7 trillion (USD 314.22 billion) as of May 2023. Also, the Indian construction industry is expected to grow at a rate of 6.2% per year from 2023 to 2026, thanks to a strong pipeline of infrastructure projects in many sectors. The Chinese Bromine production is expected to reduce driven by a reduction in capacity owing to depleting resources that was about 4% per annum. The environmental issues and corresponding crackdowns by the authorities have also led to some production plants being shut down due to regulatory scrutiny. This will lead to China importing more volumes of Bromine
1. According to the MMR analysis, the typical cost of production of elemental Bromine is $500-600 per Metric Ton (MT) for Israel and Jordan, $800-1,000 per MT for Arkansas, $900-1,100 per MT for India, $1,500- 1,700 per MT for China and $2,500 or above per MT for Japan.
The United States imports a wide range of bromine-containing chemicals, including bromide salts such as ammonium bromide, calcium bromide, potassium bromide, and sodium bromide, as well as sodium bromate and potassium bromate. Exports of bromine chemicals from the United States to other countries have been estimated to be about 49,000 to 51,000 t (gross weight)
Bromine Market Competitive landscape
1. In May 2023, Anson Resources Limited announced a letter of intent to buy 0.568 square kilometres of property for industrial use. At the Green River Project, the company estimated an exploration target of 2.0-2.6 billion tonnes of brine with a grade of 100 to 150 ppm lithium and 2000 to 3000 ppm bromine.
2. In Nov 2023, BSEF (The International Bromine Council) presented a new study on brominated flame retardants in WEEE plastics and their integration into Europe’s circular. Specialized firms can currently eliminate >95% of BFRs in these plastics, and new techniques such as solvent-based recycling, thermolysis, and gasification are showing potential in converting plastics to fundamental elements and fresh materials.
Bromine industry Ecosystem
Bromine Market Scope: Inquire before buying
| Global Bromine Market | |||
|---|---|---|---|
| Report Coverage | Details | ||
| Base Year: | 2025 | Forecast Period: | 2026-2032 |
| Historical Data: | 2020 to 2025 | Market Size in 2025: | USD 5.34 Bn. |
| Forecast Period 2026 to 2032 CAGR: | 5.5% | Market Size in 2032: | USD 7.77 Bn. |
| Segments Covered: | by Type | Organobromines Clear Brine Fluids Hydrogen Bromide |
|
| by Application | Flame Retardants Fine Chemicals Agriculture Products Biocides Others |
||
| by End Use Industry | Flame Retardants Fine Chemicals Agriculture Products Biocides Others |
||
Bromine Market, by Region
North America (United States, Canada and Mexico)
Europe (UK, France, Germany, Italy, Spain, Sweden, Austria and Rest of Europe)
Asia Pacific (China, South Korea, Japan, India, Australia, Indonesia, Malaysia, Vietnam, Taiwan, Bangladesh, Pakistan and Rest of APAC)
Middle East and Africa (South Africa, GCC, Egypt, Nigeria and Rest of ME&A)
South America (Brazil, Argentina Rest of South America)
Bromine Market, Key Players:
1. ICL Group Ltd (Israel)
2. Albemarle Corporation (US)
3. LANXESS AG (Germany)
4. Tosoh Corporation (Japan)
5. TETRA Technologies, Inc. (US)
6. Solaris Chemtech Industries Ltd (India)
7. TATA Chemicals Ltd. (India)
8. Hindustan Salts Ltd. (India)
9. Honeywell International Inc. (US)
10. Gulf Resources, Inc. (China)
11. Agrocel Industries Pvt Ltd. (India)
12. Satyesh Brinechem Pvt. Ltd. (India)
13. Perekop Bromine
14. Yuyuan Group
15. Haiwang Chemical
16. Lubei Chemical
17. Runke Chemical
18. Dadi Salt Chemical Group
19. Neogen Chemicals Ltd
20. IsraelChemicalsLtd
Frequently Asked Questions:
1] What is the projected market size & and growth rate of the Bromine Market?
Ans. The Bromine Market size was valued at USD 5.34 Bn in 2025 and the total Bromine revenue is expected to grow at a CAGR of 4.7% from 2025 to 2032, reaching nearly USD 7.77 Bn by 2032.
2] What segments are covered in the Global Bromine Market report?
Ans. The segments covered in the Bromine Market report are based on Type, Application, and End-use Industry.
3] Which region is expected to hold the highest share in the Global Bromine Market?
Ans. The APAC region is expected to hold the highest share in the Bromine Market.
4] What are the growth drivers for the Bromine market?
Ans. Innovation in technology, Rising Health Concerns, etc. are expected to be the major drivers for the Bromine market.
5] What is the forecast period for the Global Bromine Market?
Ans. The forecast period for the Bromine Market is 2026-2032.