
Biogas Blending Market Size – Industry Structure Evaluation, Demand Drivers Analysis, Regional Growth Analysis and Identification, Competitive Positioning Review & Global Market Size Forecast to 2032
Overview
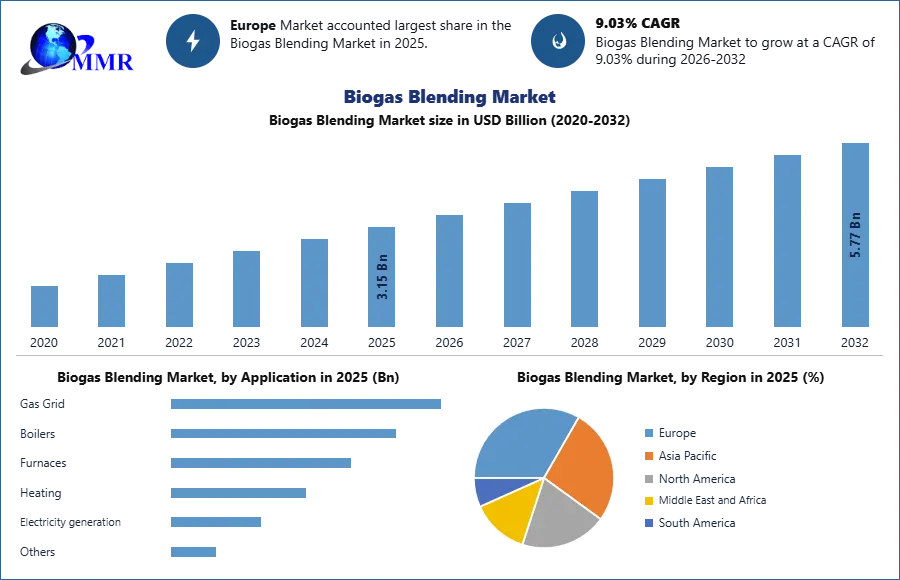
The Biogas Blending Market was valued at USD 3.15 Billion in 2025 and is estimated to grow at a CAGR of 9.03% over the forecast period, reaching USD 5.77 Billion by 2032.
Biogas Blending Market Overview
The biogas Blending industry has production and distribution of blended biogas, which is a mixture of renewable biogas and conventional natural gas. Biogas is derived from the breakdown of organic materials, such as agricultural waste, food waste, and sewage through a process called anaerobic digestion. It contains methane, carbon dioxide, and trace amounts of other gases. Biogas blending market with natural gas has benefits it helps to reduce greenhouse gas emissions by replacing a portion of fossil fuel-based natural gas with renewable alternatives. Blending biogas with natural gas helps diversify the energy mix and enhance energy security by utilizing locally available organic waste resources.
To know about the Research Methodology :- Request Free Sample Report
Biogas Blending Market Dynamics
Renewable Energy Transition and Environmental Concerns Drive the Growth of Biogas Blending Market
Biogas Blending Market is a relatively clean and sustainable energy source derived from waste gases generated in various industries. It offers the potential for reducing greenhouse gas emissions and promoting a circular economy. The inconsistency in biogas flow and quality stems from variations in gas composition, impurities, moisture content, and contaminants present in the feedstock these factors are driving the market growth. Biogas blending market influences combustion performance, efficiency, and equipment reliability.
Biogas blending systems require careful monitoring and control to ensure a consistent blending ratio and quality of the biogas. Furthermore, combustion units are typically designed to accept a constant fuel source, such as natural gas. They may not be optimized for variable biogas compositions, leading to operational constraints and suboptimal performance. This limitation hampers the broader adoption of biogas blending systems. To address these challenges, research and development efforts focus on improving biogas purification and upgrading technologies. Purification processes remove impurities and contaminants, ensuring a more consistent biogas quality. Upgrading technologies, such as pressure swing adsorption or membrane separation, enhance the methane content of biogas, improving its energy value and compatibility with combustion units.
Innovative monitoring and control systems enable real-time analysis of biogas composition and flow rate, facilitating adjustments to maintain optimal combustion conditions. Additionally, advancements in combustion unit design are being explored to accommodate variable biogas compositions and ensure efficient and reliable operations. The biogas blending market is expected to witness growth as countries and industries seek to diversify their energy sources and reduce carbon footprints. Government incentives, favorable policies, and increased environmental awareness drive the market's expansion. Technological advancements and collaborations between stakeholders, including biogas producers, equipment manufacturers, and energy providers, will play a crucial role in overcoming the limitations and unlocking the full potential of biogas blending as a clean energy solution. While challenges exist, the biogas blending market holds significant promise for sustainable energy production and waste management. Continued innovation, research, and collaboration are expected to drive the development of efficient and reliable biogas blending systems, enabling the widespread adoption of this clean energy source in diverse sectors.
Biogas as a blending gas to decarbonize natural gas networks to boost the market growth
The worldwide emphasis on the reduction of carbon emissions, biofuels as an important alternative to conventional fuels. the biofuels is biogas or biomethane which has a variety of advantages including automotive fuels, agricultural waste management, reduction of landfills, reduced burden on the incineration plants, production of organic fertilizer for farms, and promoting the economy are driving the market growth during the forecast period. The biogas blending market is used as an alternative to natural gas in small-scale applications such as cooking fuel, localized heating and or electricity production. The biogas blending Market is conventional gas could also upscale the biogas production and utilize the already existing robust infrastructure of the energy sector. The decarburization of the natural gas networks, make biogas competitive to natural gas and as the ‘green’ regulations becomes stringent, biogas blending
In Some countries such as Germany, Austria, Netherlands, and Denmark have already started feeding biogas blending market into natural gas grids and have announced ‘subsidy programs to promote the production of biogas. It has been reported that the blending of biogas could also result in the use off-spec natural gas which will reduce flaring in the industry contributing to lesser carbon emissions industries have also started working on the removal of carbon dioxide from biogas using a ‘methanation’ process to enhance the quality of ‘green gas’ and thus its associated use in the end applications. In methanation, usually, hydrogen (produced from electrolysis) is added to biogas which results in additional methane production. the comparison between the conventional biogas production process and with the methanation step to produce 60% more renewable/green gas.
Trends in Biogas Blending Market
Increasing Renewable Energy Targets: Many countries and regions have set ambitious renewable energy targets as part of their climate change mitigation strategies. Biogas blending is gaining prominence as a means to achieve these targets. Governments and energy regulators are actively promoting the blending of biogas with natural gas to reduce carbon emissions and increase the share of renewable energy in the overall energy mix.
Advancements in Biogas Upgrading Technologies: Technological advancements in biogas upgrading are enabling the production of high-quality biomethane suitable for blending with natural gas. Upgrading technologies such as pressure swing adsorption (PSA), water scrubbing, and membrane separation have become more efficient, cost-effective, and scalable. These advancements have contributed to the increased availability and reliability of biomethane for blending purposes.
Growing Investments and Partnerships: The biogas blending market is attracting significant investments from both public and private sectors. Governments, energy companies, and financial institutions are recognizing the potential of biogas blending and providing funding support for biogas upgrading infrastructure and grid injection facilities. Partnerships and collaborations between biogas producers, gas grid operators, and energy companies are also increasing, leading to the development of integrated value chains and expanded market opportunities.
Adoption in Various End-Use Sectors: Biogas blending is finding applications in various sectors such as transportation, residential heating, industrial processes, and power generation. In the transportation sector, biogas is being used as a renewable alternative to fossil fuels in compressed natural gas (CNG) and liquefied natural gas (LNG) vehicles. In the residential and industrial sectors, biogas blending is providing clean and sustainable heating options. The flexibility of biogas blending allows it to cater to diverse end-use requirements.
Focus on Circular Economy and Waste Valorization: The concept of a circular economy is gaining traction globally, and biogas blending aligns well with this principle. Biogas production utilizes organic waste materials, diverting them from landfills and reducing environmental pollution. By blending biogas with natural gas, the circularity of waste management is enhanced, creating a valuable energy resource from organic waste.
Biogas Blending Market Segment Analysis
Biogas Blending Market Segmentation, by Type
Based on type, the market has been divided into Biogas Blending with Natural Gas and Biogas Blending with Other Renewable Gases. Among these, Biogas Blending with Natural Gas is projected to generate the maximum revenue. This segment dominated the market in 2025 due to the widespread infrastructure for natural gas distribution and the ability to seamlessly integrate biogas into existing natural gas grids. Biogas blending with natural gas is also favored due to its compatibility with existing transportation and power generation systems. The ease of integrating biogas with natural gas infrastructure makes it the preferred choice for many utilities and industries, driving its dominance in the market.
Biogas Blending Market Segmentation, by Application
Based on application, the market has been divided into Power Generation, Transportation, Industrial, and Residential. Among these, Power Generation generated the maximum revenue in 2025. This segment dominated because biogas blending is increasingly being used in power plants to produce electricity in a more sustainable manner. The use of biogas in power generation reduces the reliance on fossil fuels, helping utilities meet renewable energy targets and reduce emissions. As governments around the world continue to push for cleaner energy production, the demand for biogas blending in power generation is expected to rise, further consolidating its position as the dominant application in the market.
Biogas Blending Market Regional Analysis
Europe held the largest biogas blending market share with 78% in 2025. And dominating the market during the forecast period. In the market increasing the demand of renewable energy has implemented robust policies and incentives to promote biogas blending. The dominance of Europe in the biogas blending market is due to the well-established natural gas infrastructure, which provides a ready platform for biogas blending integration the existing pipeline network and gas storage facilities enable the efficient blending and distribution of biogas. Europe leads the way for many uses of biogas blending it has 10 gigawatts of electricity production across 17,400 biogas plants and generated 61 terawatt-hours of biogas electricity in 2025. About half of Europe’s biogas use was for heating that same year. Europe's commitment to renewable energy targets and stringent environmental regulations have spurred the adoption of biogas blending as a means to reduce greenhouse gas emissions and achieve sustainability goals.
Countries around the world are taking advantage of biogas for use as a biofuel, but Europe is currently the most prominent user of this resource. There is good reason for that. Making the switch to it is relatively straightforward since it can use much of the same infrastructure as natural gas, and it also offers substantial environmental an economic benefits. The other countries in Europe, including Germany, Australia, the Netherlands, and Denmark, have made progress in integrating biogas into their natural grids. The German government provides feed-in tariffs and long-term contracts for biogas producers, ensuring a stable and favorable market environment. As a result, Germany has witnessed substantial growth in biogas production and blending, with biogas plants injecting biomethane into the natural gas grid.
North America is another region that is witnessing significant growth in the biogas blending market specifically the United States. The United States has immense potential for biogas production, also given abundant agricultural resources and waste streams. The country has been exploring the biogas blending market as a source of renewable energy solutions. North America driving the market growth due to several factors such as favorable policy frameworks, established infrastructure, and strong support for renewable energy developments are boosting the market growth during the forecast period. Highlights the dominance of these regions in the biogas blending market is the partnership between Bright Biomethane, a Dutch biogas upgrading technology provider, and Total, a major energy company based in France. The two companies announced a collaboration to develop and operate biomethane production facilities in France. The partnership aims to produce biomethane from agricultural waste and inject it into the natural gas grid. This collaboration demonstrates the growing interest in biogas blending in Europe and the commitment of industry players to expand the market.
Biogas Blending Market Competitive Landscape
The competitiveness of the Biogas Blending industry is increasing due to the ultimate innovations and productions, in order to remain competitive and maintain market share, companies must continually innovate and adapt to changing industry trends and consumer demands. Companies are focusing on improving their product offerings and increasing their distribution networks through partnerships and collaboration to get a larger portion of the market growing start-ups, mergers, and increasing trends of organic and inorganic growth is being witnessed. The key players in the Biogas Blending Market include Atoms Power PVT. ltd, Enbridge Inc., Biogas System, 2G energy expand, and AAT Biogas Technology.
These major key players are using strategies such as acquisition and mergers, partnerships, and investment and divestment, geographical expansion, collaboration to enhance the Biogas Blending Market penetration. Furthermore, large and medium-scale companies are offering highly improved product-type portfolios and customer services. The company uses both hot and cold rolled processes to manufacture Biogas Blending material and products for customers. Moreover, the company is also involved in the acquisition, R&D activity, and Biogas Blending innovation to meet customer’s demand this trend is projected to positively impact the Global Market during the forecast period.
Biogas Blending Market Scope: Inquire before buying
| Biogas Blending Market | |||
|---|---|---|---|
| Report Coverage | Details | ||
| Base Year: | 2025 | Forecast Period: | 2026-2032 |
| Historical Data: | 2020 to 2025 | Market Size in 2025: | USD 3.15 Billion |
| Forecast Period 2026-2032 CAGR: | 9.03% | Market Size in 2032: | USD 5.77 Billion |
| Segments Covered: | by Application | Gas Grid Boilers Furnaces Heating Electricity generation Others |
|
| by End-use | Residential Commercial Industrial |
||
Recent Developments
January 2025: VERBIO Vereinigte BioEnergie AG launched a new biogas upgrading facility in Europe that will increase the capacity for biogas blending with natural gas for commercial use in the energy sector.
March 2025: Greenlane Biogas signed a strategic partnership with a leading European utility company to enhance biogas upgrading technologies and expand biogas blending operations for sustainable power generation.
April 2025: Clean Energy Fuels Corp. introduced an innovative biogas blending technology designed to reduce methane emissions in the transportation sector, aiming to support the transition to cleaner fuels.
Biogas Blending Market, by Region
North America (United States, Canada and Mexico)
Europe (UK, France, Germany, Italy, Spain, Sweden, Austria and Rest of Europe)
Asia Pacific (China, South Korea, Japan, India, Australia, Indonesia, Malaysia, Vietnam, Taiwan, Bangladesh, Pakistan and Rest of APAC)
Middle East and Africa (South Africa, GCC, Egypt, Nigeria and Rest of ME&A)
South America (Brazil, Argentina Rest of South America)
Biogas Blending Market, key players
- EnviTec Biogas AG
- VERBIO Vereinigte BioEnergie AG
- AB Holding SPA
- Biogas Nord AG
- WELTEC BIOPOWER GmbH
- Greenlane Biogas
- Air Liquide
- Xebec Adsorption Inc.
- SUEZ Recycling & Recovery
- Veolia Environnement
- Clean Energy Fuels Corp.
- BioMethan GmbH
- REPOWER GmbH
- Schneider Electric
- Siemens AG
- ENGIE
- STX Corp.
- Mitsubishi Heavy Industries
- Linde Group
- DMT Environmental Technology
- Cummins Inc.
- Ramboll Group
- National Grid
- ON
- Gasunie