
Biochar Market – Global Market Size, Strategic Growth Drivers, Risk Assessment Framework, Regulatory Landscape Review, Competitive Intensity Mapping & Long-Term Industry Outlook to 2032
Overview
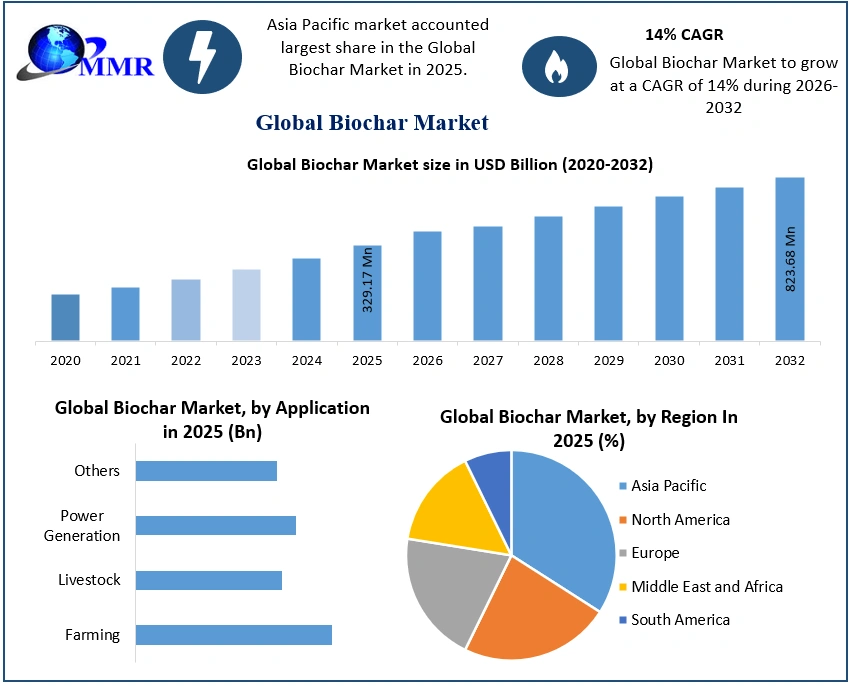
The Biochar Market size was valued at USD 329.17 Million in 2025 and the total Biochar revenue is expected to grow at a CAGR of 14% from 2025 to 2032, reaching nearly USD 823.68 Million by 2032.
Biochar Market Overview
A form of charcoal known as "biochar" is produced primarily by pyrolyzing biomass in an oxygen-free environment. It is a carbon-rich, sustainable solid material that is frequently applied as a soil supplement to improve crop output, plant growth, and soil quality. Additionally, it is utilized as a primary animal feed supplement to increase the efficiency of cattle's nutrient intake, blood values, and digestion (cows and goats).
To know about the Research Methodology :- Request Free Sample Report
Growing populations have boosted crop demand, which has in turn prompted farmers to become more oriented toward using biochar to boost crop productivity. During the forecast period, this is one of the major factors to boost the biochar market. Additionally, adding biochar to the diet of animals like cattle, goats, fowl, pigs, and fish has produced favourable results. It is a feed additive used in a variety of ruminants, including cattle and goats, to enhance blood profiles, growth performance, and disease resistance. Moreover, it contains significant amounts of calcium, potassium, and magnesium, which lower the likelihood of cracked eggs in chickens. These elements have increased the use of biochar in animal nutrition, which has increased the demand for it.
Biochar Market Dynamics
Biochar Market Drivers
Growing Environmental Protection Government Policies to Drive Market Growth. The world is becoming ever more aware of the need to safeguard the environment. To safeguard the environment from garbage and carbon pollution, people are calling for tougher regulations. The usage of this product is being promoted by the government for a number of uses, including the production of electricity and the feeding of cattle, in an effort to protect the environment. by lowering waste and moving in the direction of sustainable aims. It is added to the soil and used efficiently as fertilizer. During the forecast period, rising environmental protection legislation supports the growth of the biochar market.
Growing Livestock Feed Use of Biochar to Drive Market Growth is another driving factor. There are several benefits and applications for biochar in the market. It is economical, waste is decreased, there is no pollution, and the cost of raw materials is lower. It is used for a variety of things, one of which is livestock feed. Because it helps animals live healthier lives and gives them organic nutrients, the usage of this product for livestock feed is growing quickly around the world. When used as feed, this chemical aids in digestion and helps animals absorb toxins from their bodies. In other places, farmers have started giving this to the cows every day. Thus, rising demand in this sector fuels market growth over the forecast period.
Biochar Market Restraints
Lack of product knowledge and technological inefficiencies are hampering market growth. One of the main obstacles preventing the development potential consumption of this product continue to be the lack of a sustainable char manufacturing technique. The market value has been limited by a lack of efficient low-emission char synthesis technology, particularly for remote or mobile production.
The high cost of these goods and underlying structural limitations such a lack of producer financing, an underdeveloped carbon market, and accelerated mining land rehabilitation bonds continue to restrain market growth. The lack of uniformity and standardisation in this difficult-to-sell product restricts biochar market growth even though commercialisation is still in its early phases.
Biochar Market Opportunities
In contrast, growing R&D efforts have boosted the potential applications of biochar in a number of Application industries. For instance, biochar is now being used as a fabric addition in the textile sector. Additionally, it is quite good at adsorbing colour from the wastewater produced during textile washing. Additionally, while plastering bricks and concrete components, it is frequently utilized as an additive in the mortar that also contains clay, lime, and cement. These elements are expected to create new opportunities in the biochar market for biochar on a global scale.
Increasing demand for water treatment facilities, particularly in emerging nations, is expected to boost the use of biochar in the water treatment process as another significant use in the near future. Additionally, during the course of the forecast period, the production of biochar from crop residue and biogas is expected to support market growth.
Biochar Market Trends
Growing Demand for Biochar to Boost Market Growth in Energy Production Waste resources, including agricultural trash, forest waste, and other contaminants, are used in the production of this product. This Production Technology of charcoal has a lot of potential for application in various parts of the world to produce electricity. As a result of its efficiency in producing energy, this product is being used more and more frequently all over the world. This char is also incredibly simple and practical to produce. During the forecast period, the biochar market benefited from the increased usage of this char for energy production.
Biochar Market Segment Analysis
Based on Production Technology: The market is segmented into Pyrolysis and Gasification. The Pyrolysis segment held the largest Biochar Market share in 2025 and is expected to retain its dominance during the forecast period. The segment is also expected to grow at a high CAGR during the forecast period. This is attributed to its affordable, convenient, and capable of processing a wide range of feedstock, pyrolysis is a widely used technology. This innovation reduces greenhouse gas emissions. During the forecast period, this promotes growth in the pyrolysis technology segment. During the expected term, the gasification segment is expected to experience significant growth. Smaller amounts of this char are produced using this technology in a reaction vessel that is directly heated and has air added. Owing to its ability to emit fewer air pollutants, this technology is becoming more and more popular. This method is, however, a little less effectual than others.
Based on Application: The market is segmented into Farming, Livestock, Power Generation and Others. The farming segment is expected to grow rapidly during the forecast period. The Biochar market is mostly controlled by the farming industry. Such char is widely used in agriculture as fertilisers since it enhances soil quality and speeds up natural rates of carbon appropriation. Along with minimising greenhouse gas emissions from the soil, it also aids in reducing farm waste. Such char is increasingly being used by farmers, which stimulates growth in the farming sector during the course of the forecast period. During the forecast period, the power generating segment is expected to grow at a high rate. The production of electricity from such char has been promoted by governments all over the world because it lowers carbon emissions and waste from various industries, including agriculture, forestry, etc.
Biochar Market Regional Insights
In 2025, Asia Pacific biochar market dominated the global market. The main driver of market is the potential value of the land in terms of soil enhancement and carbon appropriation. Market growth has also benefited from the area's remarkable economic and agricultural development. China is the top producer of this type of char in the Asia-Pacific region. The area is grappling with problems such as the disposal of crop residue, soil contamination, declining quality, field burning, and greenhouse gas emissions. In order to address these concerns, the conversion of agricultural wastes into this product and the use of this product as a soil conditioner on cropland are fueling growth in this area. According to nature communication, widespread adoption of negative emission technologies (NETs) is necessary to achieve China's carbon reduction and renewable energy goals for the year 2050 in order to cost-effectively meet the Paris Agreement's targets of keeping global temperature increases to 3°C or possibly 2°C. Under a "moderate" scenario, which calls for converting 75 % of agricultural residues into char using BIPP in the short term (2020–2030) and then coordinating deployment with BECCS after 2030, the overall GHG emissions reduction reach as high as 8620 Mt CO2-eq by 2050.
North American Biochar market was the second-largest Biochar market in the world for such char due to the increased desire for organic foods and high meat consumption. Numerous local and large-scale producers operating on a national and international scale have contributed to the sector's growth. According to USBI (US Biochar Initiative), the survey participants' domestic char production ranges from 37,000 to 71,000 tons annually. For a North American total of 19,700 to 77,600 TPY, Canadian production contributes 1,800 to 7,600 TPY. Although a substantial percentage of respondents have been using such char for at least two years, and the majority of the top tier has over five years of expertise, a large percentage of users have been in business longer than smaller users. Additionally, as this area develops, cheap feed costs for cattle are emerging.
The European Biochar market is growing as a result of its large supply of forestry waste. The strict European restrictions on the disposal of organic waste and the high disposal costs help make money from the garbage and promote market growth. Around 18.000 tonnes of this char were produced in Europe in 2021, and 15 new systems had been set up and put into operation. The largest market share in Europe is held by Germany. The widespread use of this type of char in horticultural and agricultural applications is a result of its qualities, which include soil improvement and carbon sequestration.
The government has adopted a number of measures to reduce annual greenhouse gas emissions by around 56 % by 2030, and it plans to build 72 new plants by the end of 2022 to speed up regional growth. Significant market growth is also being seen in the rest of the world. The market's overall growth has been aided by the rising demand for this product in the energy generating and greenhouse gas remediation industries. The public's growing environmental awareness and concerns about this char are also boosting demand for biochar on a global scale.
Biochar Market Scope: Inquire before buying
| Global Biochar Market | |||
|---|---|---|---|
| Report Coverage | Details | ||
| Base Year: | 2025 | Forecast Period: | 2026-2032 |
| Historical Data: | 2020 to 2025 | Market Size in 2025: | USD 329.17 Mn. |
| Forecast Period 2026 to 2032 CAGR: | 14% | Market Size in 2032: | USD 823.68 Mn. |
| Segments Covered: | by Production Technology | Pyrolysis Gasification |
|
| by Application | Farming Livestock Power Generation Others |
||
| by Feedstock | Woody Biomass Agricultural Waste Animal Manure Others |
||
Biochar Market by Region:
North America (United States, Canada, and Mexico)
Europe (UK, France, Germany, Italy, Spain, Sweden, Austria, and the Rest of Europe)
Asia Pacific (China, South Korea, Japan, India, Australia, Indonesia, Malaysia, Vietnam, Taiwan, Bangladesh, Pakistan, and the Rest of APAC)
Middle East and Africa (South Africa, GCC, Egypt, Nigeria, and the Rest of ME&A)
South America (Brazil, Argentina Rest of South America)
Biochar Key Players
North America
1. Biochar Life
2. Black Owl Biochar
3. BioForceTech
4. Coaltec Energy
5. Pacific Biochar
6. Phoenix Energy
7. SynTech Bioenergy
8. EarthSpring Biochar
Europe
9. Airex Energy Inc. [Canada]
10. Eternal Power
11. Black Bull Biochar
12. Biochar Innovations
13. Carbofex
14. Mash Makes
15. NetZero
APAC
16. ArSta eco
17. Ecoera
18. Biofuels Junction
19. Farm2Energy Pvt. Ltd
20. Huaqing Carbon
Middle East and Africa
21. VeggiTech
22. Winich Farms
23. Releaf
South America
24. Brazil Biomass Energy
25. Inbioar
FAQs:
1. Which is the potential market for the Biochar in terms of the region?
Ans. The Asia Pacific Biochar Market is the potential market in terms of the region.
2. What are the opportunities for new market entrants?
Ans. The key opportunity in the market is new initiatives from governments that provide funding for Biochar Markets.
3. What is expected to drive the growth of the Biochar Market in the forecast period?
Ans. A factor that is expected to drive the Biochar Market is the supportive policies and incentives that promote sustainable agricultural practices, carbon sequestration, and waste management.
4. What is the projected Biochar market size and growth rate?
Ans. The Biochar Market size was valued at USD 329.17 Million in 2025 and the total Biochar revenue is expected to grow at a CAGR of 14% from 2025 to 2032, reaching nearly USD 823.68 Million by 2032.
5. What segments are covered in the Biochar Market report?
Ans. The segments covered are Production Technology, Application and Region.