Automotive Energy Recovery Systems Market – Industry Analysis And Forecast (2023-2029)

Automotive Energy Recovery Systems Market size is expected to reach US$ 319.2 Mn. by 2029, at a CAGR of 8.52 % during the forecast period. Energy recovery systems assist in changing a substantial amount of waste energy and store and reuse in another useful form for driving vehicle functions or giving the extra boost to the engine when required. For example, a regenerative braking system changes some of its kinetic energy into charging the battery of electric vehicles. The major factors driving the demand for Automotive Energy Recovery Systems Market are eco-friendly systems, an expedition for improved vehicle performance, and strict fuel economy standards.Automotive Energy Recovery Systems Market
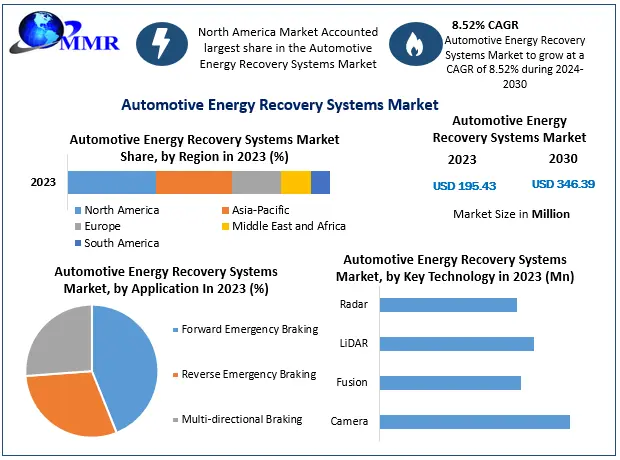
To know about the Research Methodology :- Request Free Sample Report Progressively strict government rules for emission and performance in the passenger car segment in various regions such as Europe and Asia-Pacific, mainly in China, India, and Japan is projected to increase as well. This, in turn, is projected to drive the automotive energy recovery systems market. Supportable growth in the market will largely depend upon the upcoming rules in various countries. In the future, these systems are to become compulsory in developed countries providing more growth opportunities for the market. The report includes the analysis of impact of COVID-19 lock-down on the revenue of market leaders, followers, and disrupters. Since lock down was implemented differently in different regions and countries, impact of same is also different by regions and segments. The report has covered the current short term and long term impact on the market, same will help decision makers to prepare the outline for short term and long term strategies for companies by region. The objective of the report is to present comprehensive  Automotive Energy Recovery Systems Market   including all the stakeholders of the industry. The past and current status of the industry with forecasted market size and trends are presented in the report with analysis of complicated data in simple language. The report covers all the aspects of industry with dedicated study of key players that includes market leaders, followers and new entrants by region. PORTER, SVOR, PESTEL analysis with the potential impact of micro-economic factors by region on the market have been presented in the report. External as well as internal factors that are supposed to affect the business positively or negatively have been analyzed, which will give clear futuristic view of the industry to the decision makers. The report also helps in understanding  Automotive Energy Recovery Systems Market   North America for Asia Pacific dynamics, structure by analyzing the market segments, and project the market   North America for Asia Pacific  size. Clear representation of competitive analysis of key players by type, price, financial position, product portfolio, growth strategies, and regional presence in the market   North America for Asia Pacific make the report investor’s guide.

Automotive Energy Recovery Systems Market Scope: Inquire before buying

Automotive Energy Recovery Systems Market
Report Coverage Details
Base Year: 2022 Forecast Period: 2023-2029
Historical Data: 2018 to 2022 Market Size in 2022: US $ 180.1 Mn.
Forecast Period 2023 to 2029 CAGR: 8.52 % Market Size in 2029: US $ 319.2 Mn.
Segments Covered: by Vehicle Type PV CV
by Key Technology Camera Fusion LiDAR Radar
by Operating Speed High Speed-Inter Urban AEB Systems Low Speed-City AEB Systems Pedestrian-VRU (Vulnerable Road Users) AEB Systems
by Application Forward Emergency Braking Reverse Emergency Braking Multi-directional Braking
by Level of Automation Driving Autonomous Passenger Car Semi-Autonomous Passenger Car
by Component Actuators Audible Buzzers Controllers Sensors Visual Indicators

Automotive Energy Recovery Systems Market, by Region

North America (United States, Canada and Mexico) Europe (UK, France, Germany, Italy, Spain, Sweden, Austria and Rest of Europe) Asia Pacific (China, South Korea, Japan, India, Australia, Indonesia, Malaysia, Vietnam, Taiwan, Bangladesh, Pakistan and Rest of APAC) Middle East and Africa (South Africa, GCC, Egypt, Nigeria and Rest of ME&A) South America (Brazil, Argentina Rest of South America)

Key Players:

1. BMW AG 2. Robert Bosch GmbH 3. Continental AG 4. Tenneco 5. GenTherm 6. Visteon Corporation 7. Continental 8. Daimler 9. Volkswagen 10.General Motors Company 11.Denso Corporation 12.Delphi Automotive PLC 13.Nippon Seiki Co., Ltd 14.Denso Corporation 15.Continental 16.Daimler Frequently Asked Questions: 1. Which region has the largest share in Global Automotive Energy Recovery Systems Market? Ans: North-America region held the highest share in 2022. 2. What is the growth rate of Global Automotive Energy Recovery Systems Market? Ans: The Global market is growing at a CAGR of 8.52% during forecasting period 2023-2029. 3. What is scope of the Global market report? Ans: Global market report helps with the PESTEL, PORTER, COVID-19 Impact analysis, Recommendations for Investors & Leaders, and market estimation of the forecast period. 4. Who are the key players in Global Automotive Energy Recovery Systems market? Ans: The important key players in the Global market are – BMW AG, Robert Bosch GmbH, Continental AG, Tenneco, GenTherm, Visteon Corporation, Continental, Daimler, Volkswagen, General Motors Company, Denso Corporation, Delphi Automotive PLC, Nippon Seiki Co., Ltd, Denso Corporation, Continental, Daimler, and Volkswagen 5. What is the study period of this market? Ans: The Global Automotive Energy Recovery Systems Market is studied from 2022 to 2029.
1. INTRODUCTION 1.1. Market description & Scope (2022-2029) 1.2. Objectives 1.2.1. Key Takeaways 1.2.2. Abbreviations & Acronyms 2. RESEARCH METHODOLOGY 2.1. Methods used for market forecasting 2.2. Data Sources 2.2.1. Paid Databases 2.2.2. Primary Sources 2.2.3. Secondary Sources 3. EXECUTIVE SUMMARY 3.1. Major Findings 3.1.1. Key Segment Trends 3.1.1.1. Vehicle Type 3.1.1.2. Key Technology 3.1.1.3. Operating Speed 3.1.1.4. Application 3.1.1.5. Level Of Automation Driving 3.1.1.6. Component 3.1.2. Key Regional Trends 3.1.2.1. North America 3.1.2.2. Europe 3.1.2.3. Asia Pacific 3.1.2.4. Middle-East 3.1.2.5. Latin America 3.2. Key Companies and their Strategies 4. MARKET OVERVIEW 4.1. Automotive Energy Recovery Systems Concept & Definition 4.2. Segments Overview 4.2.1.1. By Vehicle Type 4.2.1.1.1. PV 4.2.1.1.2. CV 4.2.1.2. By Key Technology 4.2.1.2.1. Camera 4.2.1.2.2. Fusion 4.2.1.2.3. LiDAR 4.2.1.2.4. Radar 4.2.1.3. By Operating Speed 4.2.1.3.1. High Speed-Inter Urban AEB Systems 4.2.1.3.2. Low Speed-City AEB Systems 4.2.1.3.3. Pedestrian-VRU (Vulnerable Road Users) AEB Systems 4.2.1.4. By Application 4.2.1.4.1. Forward Emergency Braking 4.2.1.4.2. Reverse Emergency Braking 4.2.1.4.3. Multi-directional Braking 4.2.1.5. By Level of Automation Driving 4.2.1.5.1. Autonomous Passenger Car 4.2.1.5.2. Semi-Autonomous Passenger Car 4.2.1.6. By Component 4.2.1.6.1. Actuators 4.2.1.6.2. Audible Buzzers 4.2.1.6.3. Controllers 4.2.1.6.4. Sensors 4.2.1.6.5. Visual Indicators 4.3. Market Dynamics 4.3.1. Drivers 4.3.2. Restraints 4.3.3. Opportunities 4.4. Porter’s Analysis 4.5. PESTLE Analysis 4.6. Fragmentation 4.6.1. Key strategic Alliances of companies (inorganic & organic) 4.6.2. Company Market Share (Top 10 Players) 4.6.3. Comparative Analysis of Key players in Automotive Energy Recovery Systems 4.7. Key Trends 5. AUTOMOTIVE ENERGY RECOVERY SYSTEMS MARKET VEHICLE TYPE ESTIMATES & TREND ANALYSIS (2022-2029) 5.1. Automotive Energy Recovery Systems Market: Vehicle Type Analysis 5.1.1. PV 5.1.1.1. Market Share and growth forecasts, 2022-2029 (USD Billion) 5.1.2. CV 5.1.2.1. Market Share and growth forecasts, 2022-2029 (USD Billion) 5.2. Automotive Energy Recovery Systems Market: Vehicle Type Trends 6. AUTOMOTIVE ENERGY RECOVERY SYSTEMS MARKET KEY TECHNOLOGY ESTIMATES & TREND ANALYSIS (2022-2029) 6.1. Automotive Energy Recovery Systems Market: Key Technology Analysis 6.1.1. Camera 6.1.1.1. Market Share and growth forecasts, 2022-2029 (USD Billion) 6.1.2. Fusion 6.1.2.1. Market Share and growth forecasts, 2022-2029 (USD Billion) 6.1.3. LiDAR 6.1.3.1. Market Share and growth forecasts, 2022-2029 (USD Billion) 6.1.4. Radar 6.1.4.1. Market Share and growth forecasts, 2022-2029 (USD Billion) 6.2. Automotive Energy Recovery Systems Market: Key Technology Trends 7. AUTOMOTIVE ENERGY RECOVERY SYSTEMS MARKET: OPERATING SPEED ESTIMATES & TREND ANALYSIS (2022-2029) 7.1. Automotive Energy Recovery Systems Market: Operating Speed Analysis 7.1.1. High Speed-Inter Urban AEB Systems 7.1.1.1. Market Share and growth forecasts, 2022-2029 (USD Billion) 7.1.2. Low Speed-City AEB Systems 7.1.2.1. Market Share and growth forecasts, 2022-2029 (USD Billion) 7.1.3. Pedestrian-VRU (Vulnerable Road Users) AEB Systems 7.1.3.1. Market Share and growth forecasts, 2022-2029 (USD Billion) 7.2. Automotive Energy Recovery Systems Market: Operating Speed Trends 8. AUTOMOTIVE ENERGY RECOVERY SYSTEMS MARKET: APPLICATION ESTIMATES & TREND ANALYSIS (2022-2029) 8.1. Automotive Energy Recovery Systems Market: Application Analysis 8.1.1. Forward Emergency Braking 8.1.1.1. Market Share and growth forecasts, 2022-2029 (USD Billion) 8.1.2. Reverse Emergency Braking 8.1.2.1. Market Share and growth forecasts, 2022-2029 (USD Billion) 8.1.3. Multi-directional Braking 8.1.3.1. Market Share and growth forecasts, 2022-2029 (USD Billion) 8.2. Automotive Energy Recovery Systems Market: Application Trends 9. AUTOMOTIVE ENERGY RECOVERY SYSTEMS MARKET: LEVEL OF AUTOMATION DRIVING ESTIMATES & TREND ANALYSIS (2022-2029) 9.1. Automotive Energy Recovery Systems Market: Level Of Automation Driving Analysis 9.1.1. Autonomous Passenger Car 9.1.1.1. Market Share and growth forecasts, 2022-2029 (USD Billion) 9.1.2. Semi-Autonomous Passenger Car 9.1.2.1. Market Share and growth forecasts, 2022-2029 (USD Billion) 9.2. Automotive Energy Recovery Systems Market: Level Of Automation Driving Trends 10. AUTOMOTIVE ENERGY RECOVERY SYSTEMS MARKET: COMPONENT ESTIMATES & TREND ANALYSIS (2022-2029) 10.1. Automotive Energy Recovery Systems Market: Component Analysis 10.1.1. Actuators 10.1.1.1. Market Share and growth forecasts, 2022-2029 (USD Billion) 10.1.2. Audible Buzzers 10.1.2.1. Market Share and growth forecasts, 2022-2029 (USD Billion) 10.1.3. Controllers 10.1.3.1. Market Share and growth forecasts, 2022-2029 (USD Billion) 10.1.4. Sensors 10.1.4.1. Market Share and growth forecasts, 2022-2029 (USD Billion) 10.1.5. Visual Indicators 10.1.5.1. Market Share and growth forecasts, 2022-2029 (USD Billion) 10.2. Automotive Energy Recovery Systems Market: Component Trends 11. REGIONAL ESTIMATES & TREND ANALYSIS (2022-2029) 11.1. Automotive Energy Recovery Systems market share by Region, 2022-2029 11.2. North America 11.2.1. North America Automotive Energy Recovery Systems market, Market Share and growth forecasts, 2022-2029 (USD Billion) 11.2.2. Automotive Energy Recovery Systems Drivers For North America Market 11.2.3. Market Share Analysis and Growth Forecast, by Country 11.2.3.1. US 11.2.3.2. Canada 11.2.4. Country-wise GDP Growth Forecast 11.2.5. Automotive Energy Recovery Systems Trends In North America Market 11.3. Europe 11.3.1. Europe Automotive Energy Recovery Systems market, Market Share and growth forecasts, 2022-2029 (USD Billion) 11.3.2. Automotive Energy Recovery Systems Drivers For Europe Market 11.3.3. Market Share Analysis and Growth Forecast, by Country 11.3.3.1. UK 11.3.3.2. Germany 11.3.3.3. France 11.3.3.4. Russia 11.3.3.5. Spain 11.3.3.6. Italy 11.3.3.7. Others 11.3.4. Country-wise GDP Growth Forecast 11.3.5. Automotive Energy Recovery Systems Trends In Europe Market 11.4. Asia Pacific 11.4.1. Asia Pacific Automotive Energy Recovery Systems market, Market Share and growth forecasts, 2022-2029 (USD Billion) 11.4.2. Automotive Energy Recovery Systems Drivers For Asia Pacific Market 11.4.3. Market Share Analysis and Growth Forecast, by Country 11.4.3.1. China 11.4.3.2. Japan 11.4.3.3. India 11.4.3.4. South Korea 11.4.3.5. Australia 11.4.3.6. Others 11.4.4. Country-wise GDP Growth Forecast 11.4.5. Automotive Energy Recovery Systems Trends In Asia Pacific Market 11.5. Middle-east 11.5.1. Middle-east Automotive Energy Recovery Systems market, Market Share and growth forecasts, 2022-2029 (USD Billion) 11.5.2. Automotive Energy Recovery Systems Drivers For Middle-east Market 11.5.3. Market Share Analysis and Growth Forecast, by Country 11.5.3.1. GCC Countries 11.5.3.2. Saudi Arabia 11.5.4. Country-wise GDP Growth Forecast 11.5.5. Automotive Energy Recovery Systems Trends In Middle-east Market 11.6. Latin America 11.6.1. Latin America Automotive Energy Recovery Systems market, Market Share and growth forecasts, 2022-2029 (USD Billion) 11.6.2. Automotive Energy Recovery Systems Drivers For Latin America Market 11.6.3. Market Share Analysis and Growth Forecast, by Country 11.6.3.1. Brazil 11.6.3.2. Mexico 11.6.3.3. Others 11.6.4. Country-wise GDP Growth Forecast 11.6.5. Automotive Energy Recovery Systems Trends In Latin America Market 12. MARKET SHARE ANALYSIS 12.1. Key Players Regional Market share Analysis 12.1.1. North America 12.1.2. Europe 12.1.3. Asia Pacific 12.1.4. Middle-east 12.1.5. Latin America 13. MARKET COMPETITION ANALYSIS 13.1. Strategy Framework 13.2. Consolidation 13.2.1. Patent Analysis 13.2.2. Mergers & Acquisitions 13.2.2.1. Source Based 13.2.2.2. Services Based 13.2.2.3. Region Based 13.2.2.4. List of Mergers & Acquisitions 13.2.3. Company Benchmarking (Revenue & Profit Based) 13.2.4. Strategic Assessment of Company Consolidations 13.2.5. Emerging Business Models 13.3. Company Profiles 13.3.1. BMW AG 13.3.1.1. Company overview 13.3.1.2. Key financials 13.3.1.3. Geographical presence 13.3.1.4. Source and Business Segments 13.3.1.5. Strategic initiatives 13.3.1.6. SWOT analysis 13.3.1.7. Competitive positioning and landscape 13.3.2. Robert Bosch GmbH 13.3.2.1. Company overview 13.3.2.2. Key financials 13.3.2.3. Geographical presence 13.3.2.4. Source and Business Segments 13.3.2.5. Strategic initiatives 13.3.2.6. SWOT analysis 13.3.2.7. Competitive positioning and landscape 13.3.3. Continental AG 13.3.3.1. Company overview 13.3.3.2. Key financials 13.3.3.3. Geographical presence 13.3.3.4. Source and Business Segments 13.3.3.5. Strategic initiatives 13.3.3.6. SWOT analysis 13.3.3.7. Competitive positioning and landscape 13.3.4. Tenneco 13.3.4.1. Company overview 13.3.4.2. Key financials 13.3.4.3. Geographical presence 13.3.4.4. Source and Business Segments 13.3.4.5. Strategic initiatives 13.3.4.6. SWOT analysis 13.3.4.7. Competitive positioning and landscape 13.3.5. GenTherm 13.3.5.1. Company overview 13.3.5.2. Key financials 13.3.5.3. Geographical presence 13.3.5.4. Source and Business Segments 13.3.5.5. Strategic initiatives 13.3.5.6. SWOT analysis 13.3.5.7. Competitive positioning and landscape 13.3.6. Visteon Corporation 13.3.6.1. Company overview 13.3.6.2. Key financials 13.3.6.3. Geographical presence 13.3.6.4. Source and Business Segments 13.3.6.5. Strategic initiatives 13.3.6.6. SWOT analysis 13.3.6.7. Competitive positioning and landscape 13.3.7. Continental 13.3.7.1. Company overview 13.3.7.2. Key financials 13.3.7.3. Geographical presence 13.3.7.4. Source and Business Segments 13.3.7.5. Strategic initiatives 13.3.7.6. SWOT analysis 13.3.7.7. Competitive positioning and landscape 13.3.8. Daimler 13.3.8.1. Company overview 13.3.8.2. Key financials 13.3.8.3. Geographical presence 13.3.8.4. Source and Business Segments 13.3.8.5. Strategic initiatives 13.3.8.6. SWOT analysis 13.3.8.7. Competitive positioning and landscape 13.3.9. Volkswagen 13.3.9.1. Company overview 13.3.9.2. Key financials 13.3.9.3. Geographical presence 13.3.9.4. Source and Business Segments 13.3.9.5. Strategic initiatives 13.3.9.6. SWOT analysis 13.3.9.7. Competitive positioning and landscape 13.3.10. General Motors Company 13.3.10.1. Company overview 13.3.10.2. Key financials 13.3.10.3. Geographical presence 13.3.10.4. Source and Business Segments 13.3.10.5. Strategic initiatives 13.3.10.6. SWOT analysis 13.3.10.7. Competitive positioning and landscape 13.3.11. Denso Corporation 13.3.11.1. Company overview 13.3.11.2. Key financials 13.3.11.3. Geographical presence 13.3.11.4. Source and Business Segments 13.3.11.5. Strategic initiatives 13.3.11.6. SWOT analysis 13.3.11.7. Competitive positioning and landscape 13.3.12. Delphi Automotive PLC 13.3.12.1. Company overview 13.3.12.2. Key financials 13.3.12.3. Geographical presence 13.3.12.4. Source and Business Segments 13.3.12.5. Strategic initiatives 13.3.12.6. SWOT analysis 13.3.12.7. Competitive positioning and landscape 13.3.13. Nippon Seiki Co., Ltd 13.3.13.1. Company overview 13.3.13.2. Key financials 13.3.13.3. Geographical presence 13.3.13.4. Source and Business Segments 13.3.13.5. Strategic initiatives 13.3.13.6. SWOT analysis 13.3.13.7. Competitive positioning and landscape 13.3.14. Denso Corporation 13.3.14.1. Company overview 13.3.14.2. Key financials 13.3.14.3. Geographical presence 13.3.14.4. Source and Business Segments 13.3.14.5. Strategic initiatives 13.3.14.6. SWOT analysis 13.3.14.7. Competitive positioning and landscape 13.3.15. Continental 13.3.15.1. Company overview 13.3.15.2. Key financials 13.3.15.3. Geographical presence 13.3.15.4. Source and Business Segments 13.3.15.5. Strategic initiatives 13.3.15.6. SWOT analysis 13.3.15.7. Competitive positioning and landscape 13.3.16. Daimler 13.3.16.1. Company overview 13.3.16.2. Key financials 13.3.16.3. Geographical presence 13.3.16.4. Source and Business Segments 13.3.16.5. Strategic initiatives 13.3.16.6. SWOT analysis 13.3.16.7. Competitive positioning and landscape 13.3.17. Volkswagen 13.3.17.1. Company overview 13.3.17.2. Key financials 13.3.17.3. Geographical presence 13.3.17.4. Source and Business Segments 13.3.17.5. Strategic initiatives 13.3.17.6. SWOT analysis 13.3.17.7. Competitive positioning and landscape
  • INQUIRE BEFORE BUYING