
Application Server Market Size by Type, Deployment, End-User, Region – Revenue Pool Analysis, Margin Structure Assessment, Capital Flow Trends, Competitive Benchmarking & Forecast to 2032
Overview
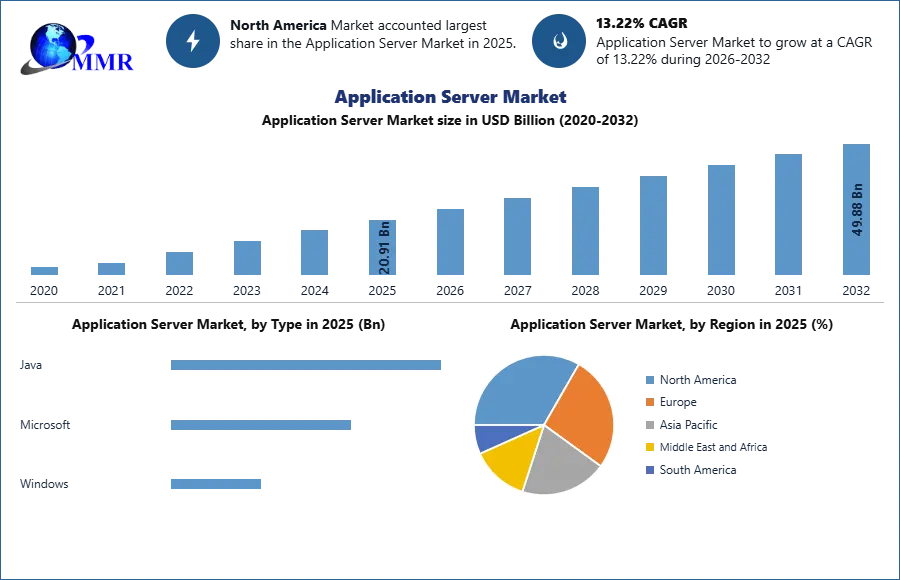
Application Server Market size was valued at US$ 20.91 Bn. in 2025 and the total revenue is expected to grow at 13.22% through 2026 to 2032, reaching nearly US$ 49.88 Bn.
Application Server Market Overview:
System framework in the form of an application server is a newer type of platform logic. It is the software that facilitates between the operating system (OS), external resources (such as database management systems [DBMS], communications, and Internet services), and applications running on the reference line. The application server's job is to act as a host (or container) for user business logic and to improve business application access and performance. Application servers must function despite the fluctuating and conflicting traffic of client requests, hardware and software faults, the dispersed nature of large-scale applications, and the possible heterogeneity of data and processing resources necessary to satisfy the business objectives of applications.
To know about the Research Methodology :- Request Free Sample Report
Application Server Market Dynamics:
Increasing need for high-end interfaces and portable software across various companies will fuel the global application server market's rise throughout the forecast period. Another factor estimated to enhance the global application server market's growth is the rise of complex applications that assist data management and the development of advanced application tools across various business sectors. Due to application server attributes that play a key role in business-to-business integration (B2Bi) and enterprise application integration, rising demands to support java application, structure, and database integration with advanced technologies among numerous organisations is another factor expected to drive growth of the global application server market (EAI).
Due to benefits such as consolidation of core functionality by single server unit, improved performance of large applications on client's server model, and centralised control on access, manpower, and data integrity, the global application server market is expected to grow during the forecast period due to rising digitalization across multiple sectors. Furthermore, there is a growing requirement to handle greater data traffic on networks in order to improve overall system performance of application service.
As web-integration interaction is a major component of application server, growing integration of evolving technology such as internet of things (IoT) with a wide range of applications to assist and run diverse uses such as for smart, easy, and presentative graphical user interfaces in smartphones is expected to support market growth. As of Dec 2019, Nginx serviced or driven mainly over 38% of the world's websites and over 25% of the million busiest sites, according to the internet research and cybercrime prevention firm Netcraft (Link sits outside IBM). Dropbox, Netflix, and Zynga are just a few of the well-known enterprise Nginx users.
However, High maintenance costs associated with application servers are likely to limit global market growth. A rise in the difficulty of large-scale application integration, as well as high server costs, is another reason that is likely to limit the target market's growth.
Web Server Vs Application Server:
The server is a storage place on a network where programmers may access data and computer applications. Websites are served by two types of servers: web servers and application servers. The latter is in charge of application interactions between users and the company's back-end business applications.
Web Server: It's a programme that receives data requests and sends out certain files. A web server is a computer that stores internet data. Internet servers are mostly used to host websites, although there are also other types of web servers, such as entertainment, storage, FTP, and email.
Example: Apache, Resin.
Apache is now the most prevalent web server in the industry, with 318,377 of the top 1 million websites using it. Nginx, like Apache, is extensively employed by website visitors, as evidenced by the fact that it is being used by 293,816 websites. LiteSpeed has 56,758 sites, IIS has 105,238 sites, Varnish has 30,730 webpages, and so forth.
Application Server: A Web container and an EJB container are included. The application server manages the framework in which enterprise applications are run. The term "application server" tends to refer to a server that can be used to describe how to set up operating systems and host applications and services for consumers, corporations, and IT professionals. In this illustration, the new platform is used in the same way as the protocol, which is the RPC/RMI protocol.
Example: JBoss, Websphere, Weblogic, Jetty.
Application Server Market Segment Analysis:
Based on the Type, the global Application Server market is sub-segmented into Java, Microsoft and Windows. The Java Based segment held the largest market share of 55% in 2020. Oracle Web Logic and IBM Web Sphere are used by Java-based application servers. Currently, IBM leads the global application server market and has made a significant contribution to the overall market share. From the perspective of IBM's growth in the application server market, the company is expected to gain defacto standard status in the market. Tomcat, Jonas, Resin, Jetty, and JBoss are some examples of other open source application servers.
Based on the End-User, the global Application Server market is sub-segmented into BFSI, Government, Healthcare, IT & Telecom, Manufacturing, Retail and Others. The BFSI segment held the largest market share of 18.6% in 2022. The market is estimated to increase due to the implementation of cutting-edge technology in the banking and financial sectors to improve service quality. Application servers are used in the BFSI business to design better banking applications that provide different services on a single platform. For example, the Indian government has launched the Digital India initiative, which incorporates digital payments and services. The BFSI sector is modernising its applications with the help of application servers to allow mobile banking and easy funds transfers for customers.
Recent Development: Application Server Market
| Exact Date | Company | Development | Impact |
|---|---|---|---|
| 19 May 2025 | Microsoft | Microsoft launched the App Service Premium v4 (Pv4) plan in public preview at Microsoft Build 2025, featuring NVMe temporary storage and faster x64 processors. | The new plan delivers a 25% performance uplift over previous generations, enabling enterprises to scale high-demand applications more cost-effectively on the cloud. |
| 16 December 2025 | IBM | IBM released WebSphere Application Server Liberty 25.0.0.12 along with updates to WebSphere Automation to streamline threat remediation and security operations. | These updates significantly reduce vulnerability exposure time and simplify the management of hybrid cloud Java deployments for large-scale enterprises. |
| 22 January 2026 | SentinelOne / IBM | Security researchers published a major fix for CVE-2025-36097, a stack-based buffer overflow vulnerability affecting IBM WebSphere Application Server 9.0. | The patch prevents remote denial-of-service (DoS) attacks, reinforcing the critical need for automated patch management in legacy application server environments. |
| 02 February 2026 | Oracle | Oracle introduced deep-level JVM optimization techniques for WebLogic Server 2026, including refined G1 Garbage Collection algorithms for heaps exceeding 8GB. | Enterprises implementing these optimizations can achieve a 25% reduction in infrastructure costs and a 40% improvement in response times for modern Java apps. |
| 20 February 2026 | Broadcom (VMware Tanzu) | Broadcom released a major update for VMware Tanzu Application Services, integrating Spring Boot 3.5.10 and Spring Cloud 2025.0.1 dependencies. | The integration provides enhanced cloud-native capabilities and better observability for microservices-based architectures running on the Tanzu platform. |
| 11 March 2026 | Amazon Web Services (AWS) | AWS released the March 2026 platform updates for Elastic Beanstalk, including the latest Amazon Linux 2023 runtime patches and EB CLI enhancements. | These updates ensure continuous compliance and security for managed application deployments, maintaining AWS’s leadership in Platform-as-a-Service (PaaS) reliability. |
Regional Insights:
North America held the largest market share of 43% with such revenue of US$ 2.9 Billion in 2022. The incorporation of a well-established communications infrastructure, the presence of several key players, market players investing heavily in R&D activities to create application servers with innovative features, early adoption of technology, growing smartphone penetration, the presence of a well-established business, rising usage of smartphones communication systems, and growing adoption in the United States are all factors contributing to the global application server market's growth during the forecast period . Europe held the 2nd largest market share of xx% in 2022. Growing federal programs in Europe to implement cloud-based m-commerce and e-commerce, as well as improvements in various technologies for high application services use across various business sectors are all contributing to the region's global application server market growth.
Asia Pacific is expected to grow at a highest CAGR of 20.41% in the global Application Server market during the forecast period. The growing demand for mobile commerce and e-commerce applications, the increasing popularity of Internet of Things technology, the emergence of skilled experts, the growth of services and manufacturing, the increasing penetration of smart phones, the development of high-speed wireless Internet network infrastructure, and the development of cloud Advances in computing and network technologies, the rise of IT service and software providers in China and India, and the increasing number of service and technology-based start-ups are driving the growth of the global application server market in the region.
The objective of the report is to present a comprehensive analysis of the global Application Server Market to the stakeholders in the industry. The past and current status of the industry with the forecasted market size and trends are presented in the report with the analysis of complicated data in simple language. The report covers all the aspects of the industry with a dedicated study of key players that include market leaders, followers, and new entrants.
PORTER, PESTEL analysis with the potential impact of micro-economic factors of the market has been presented in the report. External as well as internal factors that are supposed to affect the business positively or negatively have been analyzed, which will give a clear futuristic view of the industry to the decision-makers.
The reports also helps in understanding the global Application Server Market dynamic, structure by analyzing the market segments and project the global Application Server Market size. Clear representation of competitive analysis of key players by product, price, financial position, product portfolio, growth strategies, and regional presence in the global Application Server Market make the report investor’s guide.
Global Application Server Market Scope: Inquire before buying
| Application Server Market | |||
|---|---|---|---|
| Report Coverage | Details | ||
| Base Year: | 2025 | Forecast Period: | 2026-2032 |
| Historical Data: | 2020 to 2025 | Market Size in 2025: | 20.91 USD Billion |
| Forecast Period 2026-2032 CAGR: | 13.22% | Market Size in 2032: | 49.88 USD Billion |
| Segments Covered: | by Type | Java Microsoft Windows |
|
| by Deployment | Hosted On-premise |
||
| by Organization Size | Small & Medium Enterprises (SMEs) Large Enterprises |
||
| by End-User | BFSI Government Healthcare IT & Telecom Manufacturing Retail Others |
||
Application Server Market, by Region
North America (United States, Canada and Mexico)
Europe (UK, France, Germany, Italy, Spain, Sweden, Austria and Rest of Europe)
Asia Pacific (China, South Korea, Japan, India, Australia, Indonesia, Malaysia, Vietnam, Taiwan, Bangladesh, Pakistan and Rest of APAC)
Middle East and Africa (South Africa, GCC, Egypt, Nigeria and Rest)
Key Players are:
- Oracle Corporation
- IBM
- Microsoft
- Red Hat
- SAP
- Amazon Web Services
- Fujitsu
- TmaxSoft
- Progress Software
- VMware
- Broadcom
- Adobe
- Payara Services
- OmniFish
- Apache Software Foundation
- Eclipse Foundation
- NGINX
- Nginx Inc.
- CloudBees
- TIBCO Software
- Software AG
- Hitachi
- NEC Corporation
- Huawei
- Alibaba Cloud
- Tencent Cloud
- Zoho Corporation
- Rackspace Technology
- Salesforce
Frequently Asked Questions:
1] What segments are covered in Application Server Market report?
Ans. The segments covered in Application Server Market report are based on Type, Deployment, and End-User.
2] Which region is expected to hold the highest share in the global Application Server Market?
Ans. North America is expected to hold the highest share in the global Application Server Market.
3] What is the market size of global Application Server Market by 2032?
Ans. The market size of global Application Server Market is expected to reach US $ 49.88 Bn. by 2032.
4] Who are the top key players in the global Application Server Market?
Ans. Microsoft Corporation, International Business Machines Corp., Oracle Corporation, Red Hat, Inc., TIBCO Software Inc., and The Apache Software Foundation are the top key players in the global Application Server Market.
5] What was the market size of global Application Server Market in 2025?
Ans. The market size of global Application Server Market in 2025 was US $ 20.91 Bn.