Aluminum Cans Recycling Market Size by Recycling Source, Technology, Type, End-user, Region – Revenue Pool Analysis, Margin Structure Assessment, Capital Flow Trends, Competitive Benchmarking & Forecast to 2034

4.7%
CAGR (2026-2034)
4.01 USD Bn.
Forecast Market Size
323
Report Pages
152
Market Tables

Overview

Global Aluminum Cans Recycling Market was valued at USD 4.01 Bn in 2025 and is expected to reach USD 6.06 Bn by 2034, growing at a CAGR of 4.7% during the forecast period.

Aluminum Cans Recycling Market Overview

Aluminum is the most recyclable material recycled into another object by melting and pouring into new molds with some refinement. Aluminum cans are widely used in the production of beverage cans. Recycling of aluminum cans is a wide range of sources, including various industries and private households. Aluminum Cans Recycling helps to reduce virgin aluminum by conserving energy and resources. Aluminum Cans Recycling requires 5% of energy to make new aluminum raw ore. Stringent environmental regulations by the government is expected to boost the Aluminum Cans Recycling market growth.

The Aluminum Cans Recycling Market is gaining momentum as beverage manufacturers increasingly adopt sustainable packaging solutions to reduce environmental impact. Recycled aluminum can be processed repeatedly without significant loss of its inherent properties, making it a valuable resource for circular economy initiatives. Growing consumer awareness of waste reduction, increasing demand for eco-friendly packaging, and corporate sustainability commitments are encouraging beverage companies to incorporate recycled aluminum into their production processes. Additionally, improvements in collection systems, sorting technologies, and recycling infrastructure are helping increase the availability of recyclable aluminum cans across different regions.

Technological advancements in aluminum recovery and processing are further supporting market development by improving material quality and operational efficiency. Government initiatives promoting waste segregation, extended producer responsibility, and landfill waste reduction are encouraging businesses and consumers to participate in recycling programs. Furthermore, the expansion of the beverage industry, particularly in canned soft drinks, energy drinks, and other ready-to-drink products, is creating a consistent supply of recyclable aluminum packaging. These factors are expected to strengthen investment in recycling facilities and support the long-term growth of the Aluminum Cans Recycling Market.

Global Aluminum Cans Recycling Market Growth Outlook
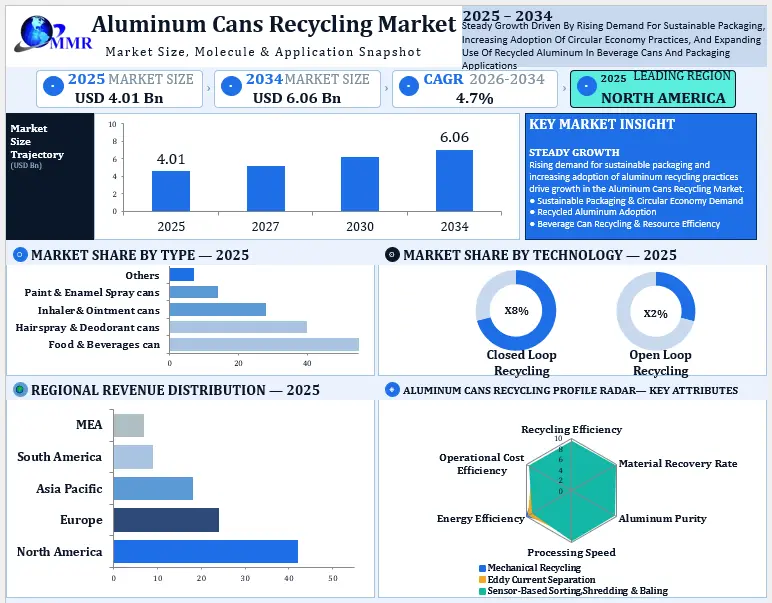
Aluminum Cans Recycling Market Growth

To know about the Research Methodology :- Request Free Sample Report

Aluminum Cans Recycling Market Dynamics

Technological Advancement in Recycling Technology to boost the Aluminum Cans Recycling Market growth

The advancement in recycling technology has made the production process easier, more efficient and more cost-effective. This process enables various end use industries to influence energy efficiency, reduce waste and improve the productivity of Aluminum Cans and is expected to boost the Aluminum Cans Recycling Market growth. Recycling of Aluminum cans, particularly beverage cans is important due to economic and environmental reasons. The aluminum recycling process requires 5% of the energy for primary aluminum production. Recycling of 1Kg of aluminum cans saves 8kg of bauxite 4 kg of chemical products and 14 kWh of electricity, which helps to prevent the environment and is expected to influence the Aluminum Cans Recycling Market share.

Aluminum is a recyclable material that takes up to 95% less energy to recycle the cans to produce primary aluminum, which helps to limit the emission of greenhouse gases and is expected to boost the Aluminum Cans Recycling industry growth. Recycling aluminum can is cost saving process to produce new aluminum cans. The recycling of aluminum cans decreases the need for mining and refining bauxite. The Aluminum Cans Recycling industry pays USD 800 Mn for empty aluminum cans each year, which helps to boost the market. According to the U.S. EPA, recycling aluminum products reduces the amount ending up in landfills by almost 55%.

Aluminum Cans Recycling helps to generate revenues from the sale of the recycled Aluminum, reduce labor costs related with the handling of Aluminum Cans during the waste disposal process, and helps streamlining overall waste processing operations, which significantly contribute for the growth of Aluminum Cans Recycling Market share.

Benefits of Aluminum Cans Recycling

1. Saves Energy
2. Prevents Depletion of a Valuable Commodity
3. It’s Profitable
4. Prevents Environmental Degradation
5. Helps in Satisfying the Increasing Demand
6. Reduction of Landfill

Environmental regulations to restrain the Aluminum Cans Recycling Market growth

Local recycling programs have changed the material they accept in response to international regulations around waste import and export. The most common material is paper and plastic among habitual recyclers. The aluminum commodity is impacted about 15% to 20% less recycling for last few decades, which is expected to hamper the Aluminum Cans Recycling Market growth over the forecast period. Environmental problems due to recycling of aluminum cans is major factor challenging the growth of the Aluminum Cans Recycling Market. Recycling aluminum cans uses minimum energy to produce new aluminum from bauxite, which may harm the environment is expected to restrain the market growth.
Aluminum Cans Recycling Market Trends

Technological advancement in recycling aluminum cans has led to sorting and processing of waste. The technological innovation adopted helps to speed up the process of manually sorting things and to handle the changing nature of complexity of the material.

Initiatives by an environmental group and public awareness about the environment has increased awareness among users globally. Aluminum cans are 100% recyclable which is expected to boost the market growth over the forecast period.

Aluminum Cans Recycling Market Segment Analysis

Based on End User, the market is segmented into Transportation, Packaging, Electrical & Electronics, Building & Construction, and Others. Packaging segment held the largest Aluminum Cans Recycling market share in 2025 and is expected to dominate the market over the forecast period. Aluminum cans are the largest most recycled packaging container. Recycling of aluminum is cost-saving and reduces the capital cost associated with landfills, mines, and international shipping of raw aluminum. Recycled Aluminum can are used in aluminum foil, which is further widely used food industry. Groceries are affected by sunlight, which damages the appearance and worsen the taste where core packaging material is used to protect the things. Benefits of aluminum are pushing brands to look how they can transit the material from accent piece to larger portion of the package. Aluminum packaging is used to reduce denting, which is expected to fuel the Aluminum Cans Recycling Market share.
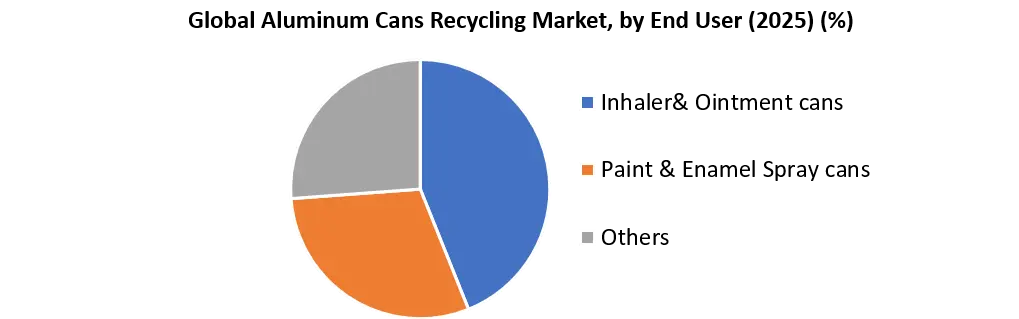
Aluminum Cans Recycling Market by Enduser
Based on Type, the Food & Beverages Can segment holds a significant share of the Aluminum Cans Recycling Market due to the widespread use of aluminum cans for soft drinks, energy drinks, beer, and other beverages. Their lightweight structure, durability, and high recyclability make them suitable for repeated material recovery. The Hairspray & Deodorant Cans segment contributes to market demand through the extensive use of aluminum aerosol containers in personal care products. Increasing consumer demand for convenient packaging and manufacturers’ focus on incorporating recycled aluminum are supporting this segment.

The Inhaler & Ointment Cans segment is supported by the use of aluminum packaging in pharmaceutical and healthcare applications, where product protection and packaging reliability are important. The Paint & Enamel Spray Cans segment generates recyclable aluminum waste from aerosol packaging used in construction, automotive, and household applications. Meanwhile, the Others segment includes aluminum cans used for specialty products, industrial applications, and other consumer goods. Growing environmental awareness, improved waste collection systems, and stricter packaging waste management practices are creating opportunities for recycling across these segments.

Aluminum Cans Recycling Market Regional Insight

North America dominated the market in 2025 and is expected to continue the dominance over the forecast period. United States has shown great efforts to increase the Aluminum Cans recycling. Aluminum Cans are most recycled package in the United States with 10 to 20 point recycling rate with high advantage rate against glass and plastic. The recycling rate for aluminum cans, which is in large amount of domestic aluminum cans recycled upto 49.4 percent. The recycling rate of aluminum cans in US in 2020 was 45.2% compared to glass bottles and polyethylene terephthalate. The Can Manufacturers Institute plans to increase the recycling rate of cans from 45.2% to 70% by 2030 and 90% by 2050. Investments by the government to generate high revenue through recycling and energy saving is expected to boost the regional Aluminum Cans Recycling Market growth.

In European region, the recovery rate of wastes is between 40% to 70% indicating that the recycling of aluminum cans reaches approximately 65%. The European Recycling Tour was executed in 15 European countries at different 19 landmarks in 2021. 50% of total recycling is done through recycled aluminum can. Austria, UK, Italy are the major countries, which are the part of campaign. In UK the campaign helps the local authorities about the value and benefits of recycling, which helps to boost the regional Aluminum Cans Recycling industry. Scotland is also implementing the Deposit Return Scheme to boost the regional recycling rate.

In Asia Pacific, China is the largest producer of Recycled cans taking up about one third of global market. The aluminum recycling capacity is 76% including aluminium recovery, reprocessing and melting. China's aluminium recycling has certain deviations in social concepts with low concentration, lack of systematic operation and industry standards, etc. All these factors are expected to increase the Aluminum Cans Recycling Market size.

South America: South America is experiencing growing opportunities in aluminum can recycling as environmental awareness and demand for sustainable packaging increase. Brazil plays a significant role due to its well-established aluminum can collection network and high recycling performance. Argentina, Chile, and Colombia also offer opportunities to expand recycling infrastructure and improve post-consumer waste recovery. Increasing beverage consumption, the economic value of recovered aluminum, and efforts to reduce packaging waste are expected to support regional market development.

Middle East and Africa: The Middle East and Africa region presents emerging opportunities for the Aluminum Cans Recycling Market as governments and businesses increasingly focus on waste management and resource conservation. The United Arab Emirates and Saudi Arabia are investing in sustainability initiatives and recycling infrastructure, while South Africa and Nigeria offer opportunities to strengthen aluminum collection and processing capabilities. However, limited collection networks in some countries, infrastructure gaps, and inconsistent waste segregation remain challenges. Continued investment in recycling facilities and public awareness programs is expected to improve regional market prospects.

Aluminum Cans Recycling Market Recent Development:

Date Company Development Impact
21 January 2026 NITI Aayog NITI Aayog released a roadmap for aluminium sector decarbonisation, emphasizing scrap utilization and renewable energy. The roadmap supports greater use of recycled aluminium and could encourage investment in India's aluminium recycling infrastructure.
04 March 2026 Every Can Counts U.S. Every Can Counts U.S. partnered with local organizations for New Orleans' RecycleDAT! campaign, collecting nearly 197,000 used beverage cans during the 2026 Carnival season. The initiative increased aluminum can recovery and strengthened community-led recycling efforts.
04 March 2026 Ball Corporation Ball showcased circular packaging innovations at Paris Packaging Week 2026, including a refillable personal-care packaging system and Elysis technology for aluminium decarbonisation. The innovations highlight opportunities to improve packaging circularity and reduce the environmental footprint of aluminium packaging.
15 May 2026 The Recycling Society The Recycling Society and Can Manufacturers Institute announced that students from 56 schools across 14 U.S. states recycled more than 3 million aluminum beverage cans in the 2025–2026 Million Cans Recycling Contest. The program diverted more than 87,000 pounds of aluminium from landfills and expanded public participation in beverage-can recycling.

Aluminum Cans Recycling Market Competitive Landscape

The Global Aluminum Cans Recycling industry is consolidated with the presence of a large sized companies and also small sized regional Aluminum cans recycling companies. Each Aluminum Cans Recycling key players are profiled in the market report based on the different parameters. Key vendors are establishing networks and partnerships with companies in the Aluminum Cans Recycling industry. This allows to collect data efficiently from the market and recycle used aluminum cans on large scale. The key players in the market are investing in Research & Development activities for new processes. The strategies adopted by the major player, such as expansion of product portfolio, mergers & acquisitions, geographical expansion, and collaborations, to enhance the Aluminum Cans Recycling market penetration.

In March 2025, the Can Manufacturers Institute and The Aluminum Association released research showing that recycled aluminum beverage cans in the United States can be converted into new cans in less than 60 days on average, highlighting the efficiency of aluminum can recycling.

Aluminum Cans Recycling Market Scope: Inquire before buying

Global Aluminum Cans Recycling Market
Report Coverage Details
Base Year: 2025 Forecast Period: 2026-2034
Historical Data: 2020 to 2025 Market Size in 2025: USD 4.01 Bn
Forecast Period 2026-2034 CAGR: 4.7% Market Size in 2034: USD 6.06 Bn
Segments Covered: by Recycling Source Curbside Pickup Spots
Community Drop off sites
Buyback Centers
Others
by Technology Closed Loop Recycling
Open Loop Recycling
by Type Food & Beverages can
Hairspray & Deodorant cans
Inhaler& Ointment cans
Paint & Enamel Spray cans
Others
by End-user Inhaler& Ointment cans
Paint & Enamel Spray cans
Others

Aluminum Cans Recycling Market by Region

North America (United States, Canada and Mexico)
Europe (UK, France, Germany, Italy, Spain, Sweden, Austria and Rest of Europe)
Asia Pacific (China, South Korea, Japan, India, Australia, Indonesia, Malaysia, Vietnam, Taiwan, Bangladesh, Pakistan and Rest of APAC)
Middle East and Africa (South Africa, GCC, Egypt, Nigeria and Rest of ME&A)
South America (Brazil, Argentina Rest of South America)

Key Players /Competitor Profiles Covered in the Global Aluminum Cans Recycling Market Report from a Strategic Perspective.

1. Novelis Inc.
2. Ball Corporation
3. Crown Holdings, Inc.
4. Ardagh Metal Packaging S.A.
5. CANPACK S.A.
6. Toyo Seikan Group Holdings, Ltd.
7. Silgan Holdings Inc.
8. CPMC Holdings Limited
9. Norsk Hydro ASA
10. Speira GmbH
11. REAL ALLOY
12. Constellium SE
13. Gränges AB
14. UACJ Corporation
15. Rexam Limited
16. Emirates Global Aluminium
17. Hindalco Industries Limited
18. Vedanta Aluminium
19. Nupur Recyclers Limited
20. Gravita India Limited
21. Jain Resource Recycling Limited
22. Latasa Reciclagem
23. Aurubis AG
24. Sims Limited
25. European Metal Recycling (EMR)
26. TSR Recycling GmbH & Co. KG
27. TOMRA Systems ASA
28. Stena Recycling AB
29. Befesa S.A.
30. Kuusakoski Group Oy
31. OmniSource Corporation
32. Alter Trading Corporation
33. Commercial Metals Company
34. Novelis Recycling
35. Real Alloy Recycling
36. Matalco Inc.
37. Kaiser Aluminum Corporation
38. Constellium Recycling
39. Alcoa Corporation
40. AMAG Austria Metall AG

Frequently Asked Questions:

1] What is the growth rate of the Global Aluminum Cans Recycling Market?
Ans. The Global Aluminum Cans Recycling Market is growing at a significant rate of 4.7% over the forecast period.

2] Which region is expected to dominate the Global Aluminum Cans Recycling Market?
Ans. North America region is expected to dominate the Aluminum Cans Recycling Market over the forecast period.

3] What is the expected Global Aluminum Cans Recycling Market size by 2034?
Ans. The market size of the Aluminum Cans Recycling Market is expected to reach USD 6.06 Bn by 2034.

4] Who are the top players in the Global Aluminum Cans Recycling Industry?
Ans. The major key players in the Global Aluminum Cans Recycling Market are Steinert, Eldan Recycling A/S, Reliance Scrap Metal, Bottleman Recycling Services, and Tal Metal Inc.

5] Which factors are expected to drive the Global Aluminum Cans Recycling Market growth by 2034?
Ans. Increasing demand from the packaging industry is expected to drive the Aluminum Cans Recycling Market growth over the forecast period (2026-2034).

Table of Contents

1. Aluminum Cans Recycling Market Introduction 1.1. Study Assumption and Market Definition 1.2. Scope of the Study 1.3. Executive Summary 2. Global Aluminum Cans Recycling Market: Competitive Landscape 2.1. MMR Competition Matrix 2.2. Competitive Landscape 2.3. Key Players Benchmarking 2.3.1. Company Name 2.3.2. Business Segment 2.3.3. End-user Segment 2.3.4. Revenue (2025) 2.3.5. Company Locations 2.4. Leading Aluminum Cans Recycling Market Companies, by market capitalization 2.5. Market Structure 2.5.1. Market Leaders 2.5.2. Market Followers 2.5.3. Emerging Players 2.6. Mergers and Acquisitions Details 3. Aluminum Cans Recycling Market: Dynamics 3.1. Aluminum Cans Recycling Market Trends by Region 3.1.1. North America Aluminum Cans Recycling Market Trends 3.1.2. Europe Aluminum Cans Recycling Market Trends 3.1.3. Asia Pacific Aluminum Cans Recycling Market Trends 3.1.4. Middle East and Africa Aluminum Cans Recycling Market Trends 3.1.5. South America Aluminum Cans Recycling Market Trends 3.2. Aluminum Cans Recycling Market Dynamics by Region 3.2.1. North America 3.2.1.1. North America Aluminum Cans Recycling Market Drivers 3.2.1.2. North America Aluminum Cans Recycling Market Restraints 3.2.1.3. North America Aluminum Cans Recycling Market Opportunities 3.2.1.4. North America Aluminum Cans Recycling Market Challenges 3.2.2. Europe 3.2.2.1. Europe Aluminum Cans Recycling Market Drivers 3.2.2.2. Europe Aluminum Cans Recycling Market Restraints 3.2.2.3. Europe Aluminum Cans Recycling Market Opportunities 3.2.2.4. Europe Aluminum Cans Recycling Market Challenges 3.2.3. Asia Pacific 3.2.3.1. Asia Pacific Aluminum Cans Recycling Market Drivers 3.2.3.2. Asia Pacific Aluminum Cans Recycling Market Restraints 3.2.3.3. Asia Pacific Aluminum Cans Recycling Market Opportunities 3.2.3.4. Asia Pacific Aluminum Cans Recycling Market Challenges 3.2.4. Middle East and Africa 3.2.4.1. Middle East and Africa Aluminum Cans Recycling Market Drivers 3.2.4.2. Middle East and Africa Aluminum Cans Recycling Market Restraints 3.2.4.3. Middle East and Africa Aluminum Cans Recycling Market Opportunities 3.2.4.4. Middle East and Africa Aluminum Cans Recycling Market Challenges 3.2.5. South America 3.2.5.1. South America Aluminum Cans Recycling Market Drivers 3.2.5.2. South America Aluminum Cans Recycling Market Restraints 3.2.5.3. South America Aluminum Cans Recycling Market Opportunities 3.2.5.4. South America Aluminum Cans Recycling Market Challenges 3.3. PORTER's Five Forces Analysis 3.4. PESTLE Analysis 3.5. Technology Roadmap 3.6. Regulatory Landscape by Region 3.6.1. North America 3.6.2. Europe 3.6.3. Asia Pacific 3.6.4. Middle East and Africa 3.6.5. South America 3.7. Key Opinion Leader Analysis in the Aluminum Cans Recycling Market 3.8. Analysis of Government Schemes and Initiatives For Global Industry 3.9. Aluminum Cans Recycling Market Trade Analysis 3.10. The Global Pandemic Impact on Aluminum Cans Recycling Market 4. Aluminum Cans Recycling Market: Global Market Size and Forecast by Segmentation (in USD Million) 2025-2034 4.1. Aluminum Cans Recycling Market Size and Forecast, by Recycling Source (2025-2034) 4.1.1. Curbside Pickup Spots 4.1.2. Community Drop off sites 4.1.3. Buyback Centers 4.1.4. Others 4.2. Aluminum Cans Recycling Market Size and Forecast, by Technology (2025-2034) 4.2.1. Closed Loop Recycling 4.2.2. Open Loop Recycling 4.3. Aluminum Cans Recycling Market Size and Forecast, by Type (2025-2034) 4.3.1. Food & Beverages can 4.3.2. Hairspray & Deodorant cans 4.3.3. Inhaler& Ointment cans 4.3.4. Paint & Enamel Spray cans 4.3.5. Others 4.4. Aluminum Cans Recycling Market Size and Forecast, by End-user (2025-2034) 4.4.1. Inhaler& Ointment cans 4.4.2. Paint & Enamel Spray cans 4.4.3. Others 4.5. Aluminum Cans Recycling Market Size and Forecast, by Region (2025-2034) 4.5.1. North America 4.5.2. Europe 4.5.3. Asia Pacific 4.5.4. Middle East and Africa 4.5.5. South America 5. North America Aluminum Cans Recycling Market Size and Forecast by Segmentation (in USD Million) 2025-2034 5.1. North America Aluminum Cans Recycling Market Size and Forecast, by Recycling Source (2025-2034) 5.1.1. Curbside Pickup Spots 5.1.2. Community Drop off sites 5.1.3. Buyback Centers 5.1.4. Others 5.2. North America Aluminum Cans Recycling Market Size and Forecast, by Technology (2025-2034) 5.2.1. Closed Loop Recycling 5.2.2. Open Loop Recycling 5.3. North America Aluminum Cans Recycling Market Size and Forecast, by Type (2025-2034) 5.3.1. Food & Beverages can 5.3.2. Hairspray & Deodorant cans 5.3.3. Inhaler& Ointment cans 5.3.4. Paint & Enamel Spray cans 5.3.5. Others 5.4. North America Aluminum Cans Recycling Market Size and Forecast, by End-user (2025-2034) 5.4.1. Inhaler& Ointment cans 5.4.2. Paint & Enamel Spray cans 5.4.3. Others 5.5. North America Aluminum Cans Recycling Market Size and Forecast, by Country (2025-2034) 5.5.1. United States 5.5.1.1. United States Aluminum Cans Recycling Market Size and Forecast, by Recycling Source (2025-2034) 5.5.1.1.1. Curbside Pickup Spots 5.5.1.1.2. Community Drop off sites 5.5.1.1.3. Buyback Centers 5.5.1.1.4. Others 5.5.1.2. United States Aluminum Cans Recycling Market Size and Forecast, by Technology (2025-2034) 5.5.1.2.1. Closed Loop Recycling 5.5.1.2.2. Open Loop Recycling 5.5.1.3. United States Aluminum Cans Recycling Market Size and Forecast, by Type (2025-2034) 5.5.1.3.1. Food & Beverages can 5.5.1.3.2. Hairspray & Deodorant cans 5.5.1.3.3. Inhaler& Ointment cans 5.5.1.3.4. Paint & Enamel Spray cans 5.5.1.3.5. Others 5.5.1.4. United States Aluminum Cans Recycling Market Size and Forecast, by End-user (2025-2034) 5.5.1.4.1. Inhaler& Ointment cans 5.5.1.4.2. Paint & Enamel Spray cans 5.5.1.4.3. Others 5.5.2. Canada 5.5.2.1. Canada Aluminum Cans Recycling Market Size and Forecast, by Recycling Source (2025-2034) 5.5.2.1.1. Curbside Pickup Spots 5.5.2.1.2. Community Drop off sites 5.5.2.1.3. Buyback Centers 5.5.2.1.4. Others 5.5.2.2. Canada Aluminum Cans Recycling Market Size and Forecast, by Technology (2025-2034) 5.5.2.2.1. Closed Loop Recycling 5.5.2.2.2. Open Loop Recycling 5.5.2.3. Canada Aluminum Cans Recycling Market Size and Forecast, by Type (2025-2034) 5.5.2.3.1. Food & Beverages can 5.5.2.3.2. Hairspray & Deodorant cans 5.5.2.3.3. Inhaler& Ointment cans 5.5.2.3.4. Paint & Enamel Spray cans 5.5.2.3.5. Others 5.5.2.4. Canada Aluminum Cans Recycling Market Size and Forecast, by End-user (2025-2034) 5.5.2.4.1. Inhaler& Ointment cans 5.5.2.4.2. Paint & Enamel Spray cans 5.5.2.4.3. Others 5.5.3. Mexico 5.5.3.1. Mexico Aluminum Cans Recycling Market Size and Forecast, by Recycling Source (2025-2034) 5.5.3.1.1. Curbside Pickup Spots 5.5.3.1.2. Community Drop off sites 5.5.3.1.3. Buyback Centers 5.5.3.1.4. Others 5.5.3.2. Mexico Aluminum Cans Recycling Market Size and Forecast, by Technology (2025-2034) 5.5.3.2.1. Closed Loop Recycling 5.5.3.2.2. Open Loop Recycling 5.5.3.3. Mexico Aluminum Cans Recycling Market Size and Forecast, by Type (2025-2034) 5.5.3.3.1. Food & Beverages can 5.5.3.3.2. Hairspray & Deodorant cans 5.5.3.3.3. Inhaler& Ointment cans 5.5.3.3.4. Paint & Enamel Spray cans 5.5.3.3.5. Others 5.5.3.4. Mexico Aluminum Cans Recycling Market Size and Forecast, by End-user (2025-2034) 5.5.3.4.1. Inhaler& Ointment cans 5.5.3.4.2. Paint & Enamel Spray cans 5.5.3.4.3. Others 6. Europe Aluminum Cans Recycling Market Size and Forecast by Segmentation (in USD Million) 2025-2034 6.1. Europe Aluminum Cans Recycling Market Size and Forecast, by Recycling Source (2025-2034) 6.1.1. Curbside Pickup Spots 6.1.2. Community Drop off sites 6.1.3. Buyback Centers 6.1.4. Others 6.2. Europe Aluminum Cans Recycling Market Size and Forecast, by Technology (2025-2034) 6.2.1. Closed Loop Recycling 6.2.2. Open Loop Recycling 6.3. Europe Aluminum Cans Recycling Market Size and Forecast, by Type (2025-2034) 6.3.1. Food & Beverages can 6.3.2. Hairspray & Deodorant cans 6.3.3. Inhaler& Ointment cans 6.3.4. Paint & Enamel Spray cans 6.3.5. Others 6.4. Europe Aluminum Cans Recycling Market Size and Forecast, by End-user (2025-2034) 6.4.1. Inhaler& Ointment cans 6.4.2. Paint & Enamel Spray cans 6.4.3. Others 6.5. Europe Aluminum Cans Recycling Market Size and Forecast, by Country (2025-2034) 6.5.1. United Kingdom 6.5.1.1. United Kingdom Aluminum Cans Recycling Market Size and Forecast, by Recycling Source (2025-2034) 6.5.1.1.1. Curbside Pickup Spots 6.5.1.1.2. Community Drop off sites 6.5.1.1.3. Buyback Centers 6.5.1.1.4. Others 6.5.1.2. United Kingdom Aluminum Cans Recycling Market Size and Forecast, by Technology (2025-2034) 6.5.1.2.1. Closed Loop Recycling 6.5.1.2.2. Open Loop Recycling 6.5.1.3. United Kingdom Aluminum Cans Recycling Market Size and Forecast, by Type (2025-2034) 6.5.1.3.1. Food & Beverages can 6.5.1.3.2. Hairspray & Deodorant cans 6.5.1.3.3. Inhaler& Ointment cans 6.5.1.3.4. Paint & Enamel Spray cans 6.5.1.3.5. Others 6.5.1.4. United Kingdom Aluminum Cans Recycling Market Size and Forecast, by End-user (2025-2034) 6.5.1.4.1. Inhaler& Ointment cans 6.5.1.4.2. Paint & Enamel Spray cans 6.5.1.4.3. Others 6.5.2. France 6.5.2.1. France Aluminum Cans Recycling Market Size and Forecast, by Recycling Source (2025-2034) 6.5.2.1.1. Curbside Pickup Spots 6.5.2.1.2. Community Drop off sites 6.5.2.1.3. Buyback Centers 6.5.2.1.4. Others 6.5.2.2. France Aluminum Cans Recycling Market Size and Forecast, by Technology (2025-2034) 6.5.2.2.1. Closed Loop Recycling 6.5.2.2.2. Open Loop Recycling 6.5.2.3. France Aluminum Cans Recycling Market Size and Forecast, by Type (2025-2034) 6.5.2.3.1. Food & Beverages can 6.5.2.3.2. Hairspray & Deodorant cans 6.5.2.3.3. Inhaler& Ointment cans 6.5.2.3.4. Paint & Enamel Spray cans 6.5.2.3.5. Others 6.5.2.4. France Aluminum Cans Recycling Market Size and Forecast, by End-user (2025-2034) 6.5.2.4.1. Inhaler& Ointment cans 6.5.2.4.2. Paint & Enamel Spray cans 6.5.2.4.3. Others 6.5.3. Germany 6.5.3.1. Germany Aluminum Cans Recycling Market Size and Forecast, by Recycling Source (2025-2034) 6.5.3.1.1. Curbside Pickup Spots 6.5.3.1.2. Community Drop off sites 6.5.3.1.3. Buyback Centers 6.5.3.1.4. Others 6.5.3.2. Germany Aluminum Cans Recycling Market Size and Forecast, by Technology (2025-2034) 6.5.3.2.1. Closed Loop Recycling 6.5.3.2.2. Open Loop Recycling 6.5.3.3. Germany Aluminum Cans Recycling Market Size and Forecast, by Type (2025-2034) 6.5.3.3.1. Food & Beverages can 6.5.3.3.2. Hairspray & Deodorant cans 6.5.3.3.3. Inhaler& Ointment cans 6.5.3.3.4. Paint & Enamel Spray cans 6.5.3.3.5. Others 6.5.3.4. Germany Aluminum Cans Recycling Market Size and Forecast, by End-user (2025-2034) 6.5.3.4.1. Inhaler& Ointment cans 6.5.3.4.2. Paint & Enamel Spray cans 6.5.3.4.3. Others 6.5.4. Italy 6.5.4.1. Italy Aluminum Cans Recycling Market Size and Forecast, by Recycling Source (2025-2034) 6.5.4.1.1. Curbside Pickup Spots 6.5.4.1.2. Community Drop off sites 6.5.4.1.3. Buyback Centers 6.5.4.1.4. Others 6.5.4.2. Italy Aluminum Cans Recycling Market Size and Forecast, by Technology (2025-2034) 6.5.4.2.1. Closed Loop Recycling 6.5.4.2.2. Open Loop Recycling 6.5.4.3. Italy Aluminum Cans Recycling Market Size and Forecast, by Type (2025-2034) 6.5.4.3.1. Food & Beverages can 6.5.4.3.2. Hairspray & Deodorant cans 6.5.4.3.3. Inhaler& Ointment cans 6.5.4.3.4. Paint & Enamel Spray cans 6.5.4.3.5. Others 6.5.4.4. Italy Aluminum Cans Recycling Market Size and Forecast, by End-user (2025-2034) 6.5.4.4.1. Inhaler& Ointment cans 6.5.4.4.2. Paint & Enamel Spray cans 6.5.4.4.3. Others 6.5.5. Spain 6.5.5.1. Spain Aluminum Cans Recycling Market Size and Forecast, by Recycling Source (2025-2034) 6.5.5.1.1. Curbside Pickup Spots 6.5.5.1.2. Community Drop off sites 6.5.5.1.3. Buyback Centers 6.5.5.1.4. Others 6.5.5.2. Spain Aluminum Cans Recycling Market Size and Forecast, by Technology (2025-2034) 6.5.5.2.1. Closed Loop Recycling 6.5.5.2.2. Open Loop Recycling 6.5.5.3. Spain Aluminum Cans Recycling Market Size and Forecast, by Type (2025-2034) 6.5.5.3.1. Food & Beverages can 6.5.5.3.2. Hairspray & Deodorant cans 6.5.5.3.3. Inhaler& Ointment cans 6.5.5.3.4. Paint & Enamel Spray cans 6.5.5.3.5. Others 6.5.5.4. Spain Aluminum Cans Recycling Market Size and Forecast, by End-user (2025-2034) 6.5.5.4.1. Inhaler& Ointment cans 6.5.5.4.2. Paint & Enamel Spray cans 6.5.5.4.3. Others 6.5.6. Sweden 6.5.6.1. Sweden Aluminum Cans Recycling Market Size and Forecast, by Recycling Source (2025-2034) 6.5.6.1.1. Curbside Pickup Spots 6.5.6.1.2. Community Drop off sites 6.5.6.1.3. Buyback Centers 6.5.6.1.4. Others 6.5.6.2. Sweden Aluminum Cans Recycling Market Size and Forecast, by Technology (2025-2034) 6.5.6.2.1. Closed Loop Recycling 6.5.6.2.2. Open Loop Recycling 6.5.6.3. Sweden Aluminum Cans Recycling Market Size and Forecast, by Type (2025-2034) 6.5.6.3.1. Food & Beverages can 6.5.6.3.2. Hairspray & Deodorant cans 6.5.6.3.3. Inhaler& Ointment cans 6.5.6.3.4. Paint & Enamel Spray cans 6.5.6.3.5. Others 6.5.6.4. Sweden Aluminum Cans Recycling Market Size and Forecast, by End-user (2025-2034) 6.5.6.4.1. Inhaler& Ointment cans 6.5.6.4.2. Paint & Enamel Spray cans 6.5.6.4.3. Others 6.5.7. Austria 6.5.7.1. Austria Aluminum Cans Recycling Market Size and Forecast, by Recycling Source (2025-2034) 6.5.7.1.1. Curbside Pickup Spots 6.5.7.1.2. Community Drop off sites 6.5.7.1.3. Buyback Centers 6.5.7.1.4. Others 6.5.7.2. Austria Aluminum Cans Recycling Market Size and Forecast, by Technology (2025-2034) 6.5.7.2.1. Closed Loop Recycling 6.5.7.2.2. Open Loop Recycling 6.5.7.3. Austria Aluminum Cans Recycling Market Size and Forecast, by Type (2025-2034) 6.5.7.3.1. Food & Beverages can 6.5.7.3.2. Hairspray & Deodorant cans 6.5.7.3.3. Inhaler& Ointment cans 6.5.7.3.4. Paint & Enamel Spray cans 6.5.7.3.5. Others 6.5.7.4. Austria Aluminum Cans Recycling Market Size and Forecast, by End-user (2025-2034) 6.5.7.4.1. Inhaler& Ointment cans 6.5.7.4.2. Paint & Enamel Spray cans 6.5.7.4.3. Others 6.5.8. Rest of Europe 6.5.8.1. Rest of Europe Aluminum Cans Recycling Market Size and Forecast, by Recycling Source (2025-2034) 6.5.8.1.1. Curbside Pickup Spots 6.5.8.1.2. Community Drop off sites 6.5.8.1.3. Buyback Centers 6.5.8.1.4. Others 6.5.8.2. Rest of Europe Aluminum Cans Recycling Market Size and Forecast, by Technology (2025-2034) 6.5.8.2.1. Closed Loop Recycling 6.5.8.2.2. Open Loop Recycling 6.5.8.3. Rest of Europe Aluminum Cans Recycling Market Size and Forecast, by Type (2025-2034) 6.5.8.3.1. Food & Beverages can 6.5.8.3.2. Hairspray & Deodorant cans 6.5.8.3.3. Inhaler& Ointment cans 6.5.8.3.4. Paint & Enamel Spray cans 6.5.8.3.5. Others 6.5.8.4. Rest of Europe Aluminum Cans Recycling Market Size and Forecast, by End-user (2025-2034) 6.5.8.4.1. Inhaler& Ointment cans 6.5.8.4.2. Paint & Enamel Spray cans 6.5.8.4.3. Others 7. Asia Pacific Aluminum Cans Recycling Market Size and Forecast by Segmentation (in USD Million) 2025-2034 7.1. Asia Pacific Aluminum Cans Recycling Market Size and Forecast, by Recycling Source (2025-2034) 7.1.1. Curbside Pickup Spots 7.1.2. Community Drop off sites 7.1.3. Buyback Centers 7.1.4. Others 7.2. Asia Pacific Aluminum Cans Recycling Market Size and Forecast, by Technology (2025-2034) 7.2.1. Closed Loop Recycling 7.2.2. Open Loop Recycling 7.3. Asia Pacific Aluminum Cans Recycling Market Size and Forecast, by Type (2025-2034) 7.3.1. Food & Beverages can 7.3.2. Hairspray & Deodorant cans 7.3.3. Inhaler& Ointment cans 7.3.4. Paint & Enamel Spray cans 7.3.5. Others 7.4. Asia Pacific Aluminum Cans Recycling Market Size and Forecast, by End-user (2025-2034) 7.4.1. Inhaler& Ointment cans 7.4.2. Paint & Enamel Spray cans 7.4.3. Others 7.5. Asia Pacific Aluminum Cans Recycling Market Size and Forecast, by Country (2025-2034) 7.5.1. China 7.5.1.1. China Aluminum Cans Recycling Market Size and Forecast, by Recycling Source (2025-2034) 7.5.1.1.1. Curbside Pickup Spots 7.5.1.1.2. Community Drop off sites 7.5.1.1.3. Buyback Centers 7.5.1.1.4. Others 7.5.1.2. China Aluminum Cans Recycling Market Size and Forecast, by Technology (2025-2034) 7.5.1.2.1. Closed Loop Recycling 7.5.1.2.2. Open Loop Recycling 7.5.1.3. China Aluminum Cans Recycling Market Size and Forecast, by Type (2025-2034) 7.5.1.3.1. Food & Beverages can 7.5.1.3.2. Hairspray & Deodorant cans 7.5.1.3.3. Inhaler& Ointment cans 7.5.1.3.4. Paint & Enamel Spray cans 7.5.1.3.5. Others 7.5.1.4. China Aluminum Cans Recycling Market Size and Forecast, by End-user (2025-2034) 7.5.1.4.1. Inhaler& Ointment cans 7.5.1.4.2. Paint & Enamel Spray cans 7.5.1.4.3. Others 7.5.2. S Korea 7.5.2.1. S Korea Aluminum Cans Recycling Market Size and Forecast, by Recycling Source (2025-2034) 7.5.2.1.1. Curbside Pickup Spots 7.5.2.1.2. Community Drop off sites 7.5.2.1.3. Buyback Centers 7.5.2.1.4. Others 7.5.2.2. S Korea Aluminum Cans Recycling Market Size and Forecast, by Technology (2025-2034) 7.5.2.2.1. Closed Loop Recycling 7.5.2.2.2. Open Loop Recycling 7.5.2.3. S Korea Aluminum Cans Recycling Market Size and Forecast, by Type (2025-2034) 7.5.2.3.1. Food & Beverages can 7.5.2.3.2. Hairspray & Deodorant cans 7.5.2.3.3. Inhaler& Ointment cans 7.5.2.3.4. Paint & Enamel Spray cans 7.5.2.3.5. Others 7.5.2.4. S Korea Aluminum Cans Recycling Market Size and Forecast, by End-user (2025-2034) 7.5.2.4.1. Inhaler& Ointment cans 7.5.2.4.2. Paint & Enamel Spray cans 7.5.2.4.3. Others 7.5.3. Japan 7.5.3.1. Japan Aluminum Cans Recycling Market Size and Forecast, by Recycling Source (2025-2034) 7.5.3.1.1. Curbside Pickup Spots 7.5.3.1.2. Community Drop off sites 7.5.3.1.3. Buyback Centers 7.5.3.1.4. Others 7.5.3.2. Japan Aluminum Cans Recycling Market Size and Forecast, by Technology (2025-2034) 7.5.3.2.1. Closed Loop Recycling 7.5.3.2.2. Open Loop Recycling 7.5.3.3. Japan Aluminum Cans Recycling Market Size and Forecast, by Type (2025-2034) 7.5.3.3.1. Food & Beverages can 7.5.3.3.2. Hairspray & Deodorant cans 7.5.3.3.3. Inhaler& Ointment cans 7.5.3.3.4. Paint & Enamel Spray cans 7.5.3.3.5. Others 7.5.3.4. Japan Aluminum Cans Recycling Market Size and Forecast, by End-user (2025-2034) 7.5.3.4.1. Inhaler& Ointment cans 7.5.3.4.2. Paint & Enamel Spray cans 7.5.3.4.3. Others 7.5.4. India 7.5.4.1. India Aluminum Cans Recycling Market Size and Forecast, by Recycling Source (2025-2034) 7.5.4.1.1. Curbside Pickup Spots 7.5.4.1.2. Community Drop off sites 7.5.4.1.3. Buyback Centers 7.5.4.1.4. Others 7.5.4.2. India Aluminum Cans Recycling Market Size and Forecast, by Technology (2025-2034) 7.5.4.2.1. Closed Loop Recycling 7.5.4.2.2. Open Loop Recycling 7.5.4.3. India Aluminum Cans Recycling Market Size and Forecast, by Type (2025-2034) 7.5.4.3.1. Food & Beverages can 7.5.4.3.2. Hairspray & Deodorant cans 7.5.4.3.3. Inhaler& Ointment cans 7.5.4.3.4. Paint & Enamel Spray cans 7.5.4.3.5. Others 7.5.4.4. India Aluminum Cans Recycling Market Size and Forecast, by End-user (2025-2034) 7.5.4.4.1. Inhaler& Ointment cans 7.5.4.4.2. Paint & Enamel Spray cans 7.5.4.4.3. Others 7.5.5. Australia 7.5.5.1. Australia Aluminum Cans Recycling Market Size and Forecast, by Recycling Source (2025-2034) 7.5.5.1.1. Curbside Pickup Spots 7.5.5.1.2. Community Drop off sites 7.5.5.1.3. Buyback Centers 7.5.5.1.4. Others 7.5.5.2. Australia Aluminum Cans Recycling Market Size and Forecast, by Technology (2025-2034) 7.5.5.2.1. Closed Loop Recycling 7.5.5.2.2. Open Loop Recycling 7.5.5.3. Australia Aluminum Cans Recycling Market Size and Forecast, by Type (2025-2034) 7.5.5.3.1. Food & Beverages can 7.5.5.3.2. Hairspray & Deodorant cans 7.5.5.3.3. Inhaler& Ointment cans 7.5.5.3.4. Paint & Enamel Spray cans 7.5.5.3.5. Others 7.5.5.4. Australia Aluminum Cans Recycling Market Size and Forecast, by End-user (2025-2034) 7.5.5.4.1. Inhaler& Ointment cans 7.5.5.4.2. Paint & Enamel Spray cans 7.5.5.4.3. Others 7.5.6. Indonesia 7.5.6.1. Indonesia Aluminum Cans Recycling Market Size and Forecast, by Recycling Source (2025-2034) 7.5.6.1.1. Curbside Pickup Spots 7.5.6.1.2. Community Drop off sites 7.5.6.1.3. Buyback Centers 7.5.6.1.4. Others 7.5.6.2. Indonesia Aluminum Cans Recycling Market Size and Forecast, by Technology (2025-2034) 7.5.6.2.1. Closed Loop Recycling 7.5.6.2.2. Open Loop Recycling 7.5.6.3. Indonesia Aluminum Cans Recycling Market Size and Forecast, by Type (2025-2034) 7.5.6.3.1. Food & Beverages can 7.5.6.3.2. Hairspray & Deodorant cans 7.5.6.3.3. Inhaler& Ointment cans 7.5.6.3.4. Paint & Enamel Spray cans 7.5.6.3.5. Others 7.5.6.4. Indonesia Aluminum Cans Recycling Market Size and Forecast, by End-user (2025-2034) 7.5.6.4.1. Inhaler& Ointment cans 7.5.6.4.2. Paint & Enamel Spray cans 7.5.6.4.3. Others 7.5.7. Malaysia 7.5.7.1. Malaysia Aluminum Cans Recycling Market Size and Forecast, by Recycling Source (2025-2034) 7.5.7.1.1. Curbside Pickup Spots 7.5.7.1.2. Community Drop off sites 7.5.7.1.3. Buyback Centers 7.5.7.1.4. Others 7.5.7.2. Malaysia Aluminum Cans Recycling Market Size and Forecast, by Technology (2025-2034) 7.5.7.2.1. Closed Loop Recycling 7.5.7.2.2. Open Loop Recycling 7.5.7.3. Malaysia Aluminum Cans Recycling Market Size and Forecast, by Type (2025-2034) 7.5.7.3.1. Food & Beverages can 7.5.7.3.2. Hairspray & Deodorant cans 7.5.7.3.3. Inhaler& Ointment cans 7.5.7.3.4. Paint & Enamel Spray cans 7.5.7.3.5. Others 7.5.7.4. Malaysia Aluminum Cans Recycling Market Size and Forecast, by End-user (2025-2034) 7.5.7.4.1. Inhaler& Ointment cans 7.5.7.4.2. Paint & Enamel Spray cans 7.5.7.4.3. Others 7.5.8. Vietnam 7.5.8.1. Vietnam Aluminum Cans Recycling Market Size and Forecast, by Recycling Source (2025-2034) 7.5.8.1.1. Curbside Pickup Spots 7.5.8.1.2. Community Drop off sites 7.5.8.1.3. Buyback Centers 7.5.8.1.4. Others 7.5.8.2. Vietnam Aluminum Cans Recycling Market Size and Forecast, by Technology (2025-2034) 7.5.8.2.1. Closed Loop Recycling 7.5.8.2.2. Open Loop Recycling 7.5.8.3. Vietnam Aluminum Cans Recycling Market Size and Forecast, by Type (2025-2034) 7.5.8.3.1. Food & Beverages can 7.5.8.3.2. Hairspray & Deodorant cans 7.5.8.3.3. Inhaler& Ointment cans 7.5.8.3.4. Paint & Enamel Spray cans 7.5.8.3.5. Others 7.5.8.4. Vietnam Aluminum Cans Recycling Market Size and Forecast, by End-user (2025-2034) 7.5.8.4.1. Inhaler& Ointment cans 7.5.8.4.2. Paint & Enamel Spray cans 7.5.8.4.3. Others 7.5.9. Taiwan 7.5.9.1. Taiwan Aluminum Cans Recycling Market Size and Forecast, by Recycling Source (2025-2034) 7.5.9.1.1. Curbside Pickup Spots 7.5.9.1.2. Community Drop off sites 7.5.9.1.3. Buyback Centers 7.5.9.1.4. Others 7.5.9.2. Taiwan Aluminum Cans Recycling Market Size and Forecast, by Technology (2025-2034) 7.5.9.2.1. Closed Loop Recycling 7.5.9.2.2. Open Loop Recycling 7.5.9.3. Taiwan Aluminum Cans Recycling Market Size and Forecast, by Type (2025-2034) 7.5.9.3.1. Food & Beverages can 7.5.9.3.2. Hairspray & Deodorant cans 7.5.9.3.3. Inhaler& Ointment cans 7.5.9.3.4. Paint & Enamel Spray cans 7.5.9.3.5. Others 7.5.9.4. Taiwan Aluminum Cans Recycling Market Size and Forecast, by End-user (2025-2034) 7.5.9.4.1. Inhaler& Ointment cans 7.5.9.4.2. Paint & Enamel Spray cans 7.5.9.4.3. Others 7.5.10. Rest of Asia Pacific 7.5.10.1. Rest of Asia Pacific Aluminum Cans Recycling Market Size and Forecast, by Recycling Source (2025-2034) 7.5.10.1.1. Curbside Pickup Spots 7.5.10.1.2. Community Drop off sites 7.5.10.1.3. Buyback Centers 7.5.10.1.4. Others 7.5.10.2. Rest of Asia Pacific Aluminum Cans Recycling Market Size and Forecast, by Technology (2025-2034) 7.5.10.2.1. Closed Loop Recycling 7.5.10.2.2. Open Loop Recycling 7.5.10.3. Rest of Asia Pacific Aluminum Cans Recycling Market Size and Forecast, by Type (2025-2034) 7.5.10.3.1. Food & Beverages can 7.5.10.3.2. Hairspray & Deodorant cans 7.5.10.3.3. Inhaler& Ointment cans 7.5.10.3.4. Paint & Enamel Spray cans 7.5.10.3.5. Others 7.5.10.4. Rest of Asia Pacific Aluminum Cans Recycling Market Size and Forecast, by End-user (2025-2034) 7.5.10.4.1. Inhaler& Ointment cans 7.5.10.4.2. Paint & Enamel Spray cans 7.5.10.4.3. Others 8. Middle East and Africa Aluminum Cans Recycling Market Size and Forecast by Segmentation (in USD Million) 2025-2034 8.1. Middle East and Africa Aluminum Cans Recycling Market Size and Forecast, by Recycling Source (2025-2034) 8.1.1. Curbside Pickup Spots 8.1.2. Community Drop off sites 8.1.3. Buyback Centers 8.1.4. Others 8.2. Middle East and Africa Aluminum Cans Recycling Market Size and Forecast, by Technology (2025-2034) 8.2.1. Closed Loop Recycling 8.2.2. Open Loop Recycling 8.3. Middle East and Africa Aluminum Cans Recycling Market Size and Forecast, by Type (2025-2034) 8.3.1. Food & Beverages can 8.3.2. Hairspray & Deodorant cans 8.3.3. Inhaler& Ointment cans 8.3.4. Paint & Enamel Spray cans 8.3.5. Others 8.4. Middle East and Africa Aluminum Cans Recycling Market Size and Forecast, by End-user (2025-2034) 8.4.1. Inhaler& Ointment cans 8.4.2. Paint & Enamel Spray cans 8.4.3. Others 8.5. Middle East and Africa Aluminum Cans Recycling Market Size and Forecast, by Country (2025-2034) 8.5.1. South Africa 8.5.1.1. South Africa Aluminum Cans Recycling Market Size and Forecast, by Recycling Source (2025-2034) 8.5.1.1.1. Curbside Pickup Spots 8.5.1.1.2. Community Drop off sites 8.5.1.1.3. Buyback Centers 8.5.1.1.4. Others 8.5.1.2. South Africa Aluminum Cans Recycling Market Size and Forecast, by Technology (2025-2034) 8.5.1.2.1. Closed Loop Recycling 8.5.1.2.2. Open Loop Recycling 8.5.1.3. South Africa Aluminum Cans Recycling Market Size and Forecast, by Type (2025-2034) 8.5.1.3.1. Food & Beverages can 8.5.1.3.2. Hairspray & Deodorant cans 8.5.1.3.3. Inhaler& Ointment cans 8.5.1.3.4. Paint & Enamel Spray cans 8.5.1.3.5. Others 8.5.1.4. South Africa Aluminum Cans Recycling Market Size and Forecast, by End-user (2025-2034) 8.5.1.4.1. Inhaler& Ointment cans 8.5.1.4.2. Paint & Enamel Spray cans 8.5.1.4.3. Others 8.5.2. GCC 8.5.2.1. GCC Aluminum Cans Recycling Market Size and Forecast, by Recycling Source (2025-2034) 8.5.2.1.1. Curbside Pickup Spots 8.5.2.1.2. Community Drop off sites 8.5.2.1.3. Buyback Centers 8.5.2.1.4. Others 8.5.2.2. GCC Aluminum Cans Recycling Market Size and Forecast, by Technology (2025-2034) 8.5.2.2.1. Closed Loop Recycling 8.5.2.2.2. Open Loop Recycling 8.5.2.3. GCC Aluminum Cans Recycling Market Size and Forecast, by Type (2025-2034) 8.5.2.3.1. Food & Beverages can 8.5.2.3.2. Hairspray & Deodorant cans 8.5.2.3.3. Inhaler& Ointment cans 8.5.2.3.4. Paint & Enamel Spray cans 8.5.2.3.5. Others 8.5.2.4. GCC Aluminum Cans Recycling Market Size and Forecast, by End-user (2025-2034) 8.5.2.4.1. Inhaler& Ointment cans 8.5.2.4.2. Paint & Enamel Spray cans 8.5.2.4.3. Others 8.5.3. Nigeria 8.5.3.1. Nigeria Aluminum Cans Recycling Market Size and Forecast, by Recycling Source (2025-2034) 8.5.3.1.1. Curbside Pickup Spots 8.5.3.1.2. Community Drop off sites 8.5.3.1.3. Buyback Centers 8.5.3.1.4. Others 8.5.3.2. Nigeria Aluminum Cans Recycling Market Size and Forecast, by Technology (2025-2034) 8.5.3.2.1. Closed Loop Recycling 8.5.3.2.2. Open Loop Recycling 8.5.3.3. Nigeria Aluminum Cans Recycling Market Size and Forecast, by Type (2025-2034) 8.5.3.3.1. Food & Beverages can 8.5.3.3.2. Hairspray & Deodorant cans 8.5.3.3.3. Inhaler& Ointment cans 8.5.3.3.4. Paint & Enamel Spray cans 8.5.3.3.5. Others 8.5.3.4. Nigeria Aluminum Cans Recycling Market Size and Forecast, by End-user (2025-2034) 8.5.3.4.1. Inhaler& Ointment cans 8.5.3.4.2. Paint & Enamel Spray cans 8.5.3.4.3. Others 8.5.4. Rest of ME&A 8.5.4.1. Rest of ME&A Aluminum Cans Recycling Market Size and Forecast, by Recycling Source (2025-2034) 8.5.4.1.1. Curbside Pickup Spots 8.5.4.1.2. Community Drop off sites 8.5.4.1.3. Buyback Centers 8.5.4.1.4. Others 8.5.4.2. Rest of ME&A Aluminum Cans Recycling Market Size and Forecast, by Technology (2025-2034) 8.5.4.2.1. Closed Loop Recycling 8.5.4.2.2. Open Loop Recycling 8.5.4.3. Rest of ME&A Aluminum Cans Recycling Market Size and Forecast, by Type (2025-2034) 8.5.4.3.1. Food & Beverages can 8.5.4.3.2. Hairspray & Deodorant cans 8.5.4.3.3. Inhaler& Ointment cans 8.5.4.3.4. Paint & Enamel Spray cans 8.5.4.3.5. Others 8.5.4.4. Rest of ME&A Aluminum Cans Recycling Market Size and Forecast, by End-user (2025-2034) 8.5.4.4.1. Inhaler& Ointment cans 8.5.4.4.2. Paint & Enamel Spray cans 8.5.4.4.3. Others 9. South America Aluminum Cans Recycling Market Size and Forecast by Segmentation (in USD Million) 2025-2034 9.1. South America Aluminum Cans Recycling Market Size and Forecast, by Recycling Source (2025-2034) 9.1.1. Curbside Pickup Spots 9.1.2. Community Drop off sites 9.1.3. Buyback Centers 9.1.4. Others 9.2. South America Aluminum Cans Recycling Market Size and Forecast, by Technology (2025-2034) 9.2.1. Closed Loop Recycling 9.2.2. Open Loop Recycling 9.3. South America Aluminum Cans Recycling Market Size and Forecast, by Type (2025-2034) 9.3.1. Food & Beverages can 9.3.2. Hairspray & Deodorant cans 9.3.3. Inhaler& Ointment cans 9.3.4. Paint & Enamel Spray cans 9.3.5. Others 9.4. South America Aluminum Cans Recycling Market Size and Forecast, by End-user (2025-2034) 9.4.1. Inhaler& Ointment cans 9.4.2. Paint & Enamel Spray cans 9.4.3. Others 9.5. South America Aluminum Cans Recycling Market Size and Forecast, by Country (2025-2034) 9.5.1. Brazil 9.5.1.1. Brazil Aluminum Cans Recycling Market Size and Forecast, by Recycling Source (2025-2034) 9.5.1.1.1. Curbside Pickup Spots 9.5.1.1.2. Community Drop off sites 9.5.1.1.3. Buyback Centers 9.5.1.1.4. Others 9.5.1.2. Brazil Aluminum Cans Recycling Market Size and Forecast, by Technology (2025-2034) 9.5.1.2.1. Closed Loop Recycling 9.5.1.2.2. Open Loop Recycling 9.5.1.3. Brazil Aluminum Cans Recycling Market Size and Forecast, by Type (2025-2034) 9.5.1.3.1. Food & Beverages can 9.5.1.3.2. Hairspray & Deodorant cans 9.5.1.3.3. Inhaler& Ointment cans 9.5.1.3.4. Paint & Enamel Spray cans 9.5.1.3.5. Others 9.5.1.4. Brazil Aluminum Cans Recycling Market Size and Forecast, by End-user (2025-2034) 9.5.1.4.1. Inhaler& Ointment cans 9.5.1.4.2. Paint & Enamel Spray cans 9.5.1.4.3. Others 9.5.2. Argentina 9.5.2.1. Argentina Aluminum Cans Recycling Market Size and Forecast, by Recycling Source (2025-2034) 9.5.2.1.1. Curbside Pickup Spots 9.5.2.1.2. Community Drop off sites 9.5.2.1.3. Buyback Centers 9.5.2.1.4. Others 9.5.2.2. Argentina Aluminum Cans Recycling Market Size and Forecast, by Technology (2025-2034) 9.5.2.2.1. Closed Loop Recycling 9.5.2.2.2. Open Loop Recycling 9.5.2.3. Argentina Aluminum Cans Recycling Market Size and Forecast, by Type (2025-2034) 9.5.2.3.1. Food & Beverages can 9.5.2.3.2. Hairspray & Deodorant cans 9.5.2.3.3. Inhaler& Ointment cans 9.5.2.3.4. Paint & Enamel Spray cans 9.5.2.3.5. Others 9.5.2.4. Argentina Aluminum Cans Recycling Market Size and Forecast, by End-user (2025-2034) 9.5.2.4.1. Inhaler& Ointment cans 9.5.2.4.2. Paint & Enamel Spray cans 9.5.2.4.3. Others 9.5.3. Rest Of South America 9.5.3.1. Rest Of South America Aluminum Cans Recycling Market Size and Forecast, by Recycling Source (2025-2034) 9.5.3.1.1. Curbside Pickup Spots 9.5.3.1.2. Community Drop off sites 9.5.3.1.3. Buyback Centers 9.5.3.1.4. Others 9.5.3.2. Rest Of South America Aluminum Cans Recycling Market Size and Forecast, by Technology (2025-2034) 9.5.3.2.1. Closed Loop Recycling 9.5.3.2.2. Open Loop Recycling 9.5.3.3. Rest Of South America Aluminum Cans Recycling Market Size and Forecast, by Type (2025-2034) 9.5.3.3.1. Food & Beverages can 9.5.3.3.2. Hairspray & Deodorant cans 9.5.3.3.3. Inhaler& Ointment cans 9.5.3.3.4. Paint & Enamel Spray cans 9.5.3.3.5. Others 9.5.3.4. Rest Of South America Aluminum Cans Recycling Market Size and Forecast, by End-user (2025-2034) 9.5.3.4.1. Inhaler& Ointment cans 9.5.3.4.2. Paint & Enamel Spray cans 9.5.3.4.3. Others 10. Company Profile: Key Players 10.1. Novelis Inc. 10.1.1. Company Overview 10.1.2. Business Portfolio 10.1.3. Financial Overview 10.1.4. SWOT Analysis 10.1.5. Strategic Analysis 10.1.6. Scale of Operation (small, medium, and large) 10.1.7. Details on Partnership 10.1.8. Regulatory Accreditations and Certifications Received by Them 10.1.9. Awards Received by the Firm 10.1.10. Recent Developments 10.2. Ball Corporation 10.3. Crown Holdings, Inc. 10.4. Ardagh Metal Packaging S.A. 10.5. CANPACK S.A. 10.6. Toyo Seikan Group Holdings, Ltd. 10.7. Silgan Holdings Inc. 10.8. CPMC Holdings Limited 10.9. Norsk Hydro ASA 10.10. Speira GmbH 10.11. REAL ALLOY 10.12. Constellium SE 10.13. Gränges AB 10.14. UACJ Corporation 10.15. Rexam Limited 10.16. Emirates Global Aluminium 10.17. Hindalco Industries Limited 10.18. Vedanta Aluminium 10.19. Nupur Recyclers Limited 10.20. Gravita India Limited 10.21. Jain Resource Recycling Limited 10.22. Latasa Reciclagem 10.23. Aurubis AG 10.24. Sims Limited 10.25. European Metal Recycling (EMR) 10.26. TSR Recycling GmbH & Co. KG 10.27. TOMRA Systems ASA 10.28. Stena Recycling AB 10.29. Befesa S.A. 10.30. Kuusakoski Group Oy 10.31. OmniSource Corporation 10.32. Alter Trading Corporation 10.33. Commercial Metals Company 10.34. Novelis Recycling 10.35. Real Alloy Recycling 10.36. Matalco Inc. 10.37. Kaiser Aluminum Corporation 10.38. Constellium Recycling 10.39. Alcoa Corporation 10.40. AMAG Austria Metall AG 11. Key Findings 12. Industry Recommendations 13. Aluminum Cans Recycling Market: Research Methodology 14. Terms and Glossary

Custom Market Research Services

We Will Customise The Research For You, In Case The Report Listed Above Does Not Meet With Your Requirements