Wires and cables Market – Global Industry Analysis and Forecast (2023-2029)

Wires and cables Market is expected to grow at a CAGR of 5.5% during the forecast period and market is expected to reach US$ 297.05 Bn. by 2029. The report includes the analysis of impact of COVID-19 lock-down on the revenue of market leaders, followers, and disrupters. Since lock down was implemented differently in different regions and countries, impact of same is also different by regions and segments. The report has covered the current short term and long term impact on the market, same will help decision makers to prepare the outline for short term and long term strategies for companies by region.Wires and cables Market
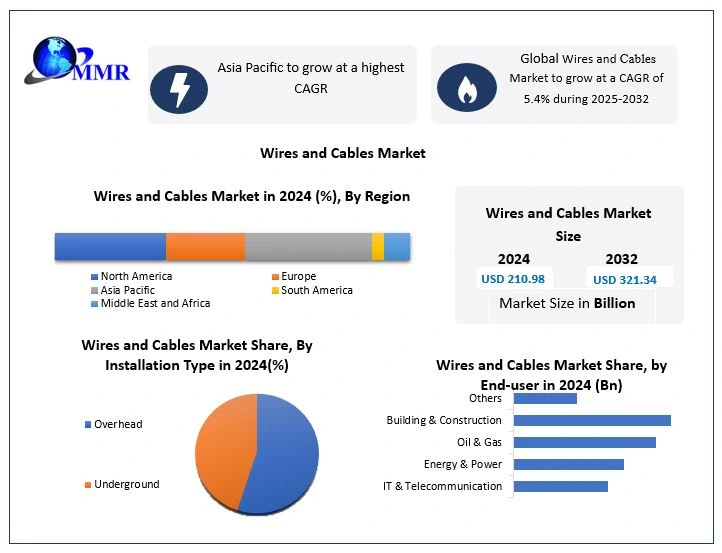
To know about the Research Methodology :- Request Free Sample Report Global wires and cables are segmented into by voltage, by installation, by an end user, and by region. Based on the voltage wires and cables market is divided into low, high and extra high. Installation is split into the overhead, underground. End users are classified as aerospace & defense, automotive, building & construction, oil & gas, energy & power, IT & telecommunication. Region wise the market is divided into North America, Europe, Asia Pacific, Middle East & Africa, and Latin America. Growing reserves in smart grid technology, increasing renewable energy production, and government initiatives for upgrading the transmission and distribution systems are expected to drive this market. Adoption of smart grid technology has fulfilled the increasing need for grid interconnections, significantly resulting in growing investments in the new submarine and underground cables. Additionaly, the market growth is attributed to the rising offshore wind farms and high voltage direct current links. Another drivers of the market are, Need for good aesthetics, safety and, functional flexibility. Request From data centers and IT facilities. Rapid growth into construction sector. Opportunities of the market is growing demand from renewable power generation sector. Based on the voltage, low voltage segment dominating the market. Low voltage cables have high tensile strength and superior conductivity. So, used in industrial and domestic home appliances wiring, internal wiring for lighting circuits, power supply, automotive applications, telecommunication lines, and power generation cables. On the basis of end user, Energy and power segment hold the largest share of the overall market. With increasing awareness, the manufacturers are actively seeking chances to invest in renewable energy generation, such as solar and wind power. In terms of region, Asia Pacific most dominated the wires and cable market in 2017. The dominance of the region in the market is attributed to its large population base, rising industrialization and urbanization, development in transmission and distribution networks, growing renewable energy production, large automobile production, and supportive governmental initiatives for expansion or upgrade of existing infrastructure. Key players operating on the market are, Prysmian Group, Hengtong Optic-Electric Co Ltd., Furukawa Electric Co., Ltd., Sumitomo Electric Industries, Ltd., General Cable Corporation, Jiagnan Group, TPC Wires & Cable Corp, LS Cable & System Ltd, Polycab Wires Private Limited, Southwires Company, LLC, Hitachi Metals Ltd, Nexans S.A., Leoni AG, and Far East Cable Co., Ltd.

Scope of the Wires and cables Market: Inquire before buying

Wires and cables Market
Report Coverage Details
Base Year: 2022 Forecast Period: 2023-2029
Historical Data: 2018 to 2022 Market Size in 2022: US $ 204.20 Bn.
Forecast Period 2023 to 2029 CAGR: 5.5% Market Size in 2029: US $ 297.05 Bn.
Segments Covered: by Voltage Low High Extra high
by Installation Overhead Underground
by End User Aerospace & Defence Automotive Building & Construction Oil & Gas Energy & Power IT & Telecommunication

Wires and Cables Market, by Region

North America (United States, Canada and Mexico) Europe (UK, France, Germany, Italy, Spain, Sweden, Austria and Rest of Europe) Asia Pacific (China, South Korea, Japan, India, Australia, Indonesia, Malaysia, Vietnam, Taiwan, Bangladesh, Pakistan and Rest of APAC) Middle East and Africa (South Africa, GCC, Egypt, Nigeria and Rest of ME&A) South America (Brazil, Argentina Rest of South America)

Key players operating on the Wires and Cables Market are:

1. Prysmian Group 2. Hengtong Optic-Electric Co Ltd. 3. Furukawa Electric Co., Ltd. 4. Sumitomo Electric Industries, Ltd. 5. General Cable Corporation 6. Jiagnan Group 7. TPC Wires & Cable Corp 8. LS Cable & System Ltd 9. Polycab Wires Private Limited 10.Southwires Company 11.LLC 12.Hitachi Metals Ltd 13.Nexans S.A. 14.Leoni AG 15.Far East Cable Co., Ltd Frequently Asked Questions: 1. Which region has the largest share in Global Wires and Cables Market? Ans: Asia Pacific region holds the highest share in 2022. 2. What is the growth rate of Global Wires and Cables Market? Ans: The Global Wires and Cables Market is growing at a CAGR of 5.5% during forecasting period 2023-2029. 3. What is scope of the Global Wires and Cables market report? Ans: Global Wires and Cables Market report helps with the PESTEL, PORTER, COVID-19 Impact analysis, Recommendations for Investors & Leaders, and market estimation of the forecast period. 4. Who are the key players in Global Wires and Cables market? Ans: The important key players in the Global Wires and Cables Market are – Prysmian Group, Hengtong Optic-Electric Co Ltd., Furukawa Electric Co., Ltd., Sumitomo Electric Industries, Ltd., General Cable Corporation, Jiagnan Group, TPC Wires & Cable Corp, LS Cable & System Ltd, Polycab Wires Private Limited, Southwires Company, LLC, Hitachi Metals Ltd, Nexans S.A., Leoni AG, Far East Cable Co., and Ltd 5. What is the study period of this market? Ans: The Global Wires and Cables Market is studied from 2022 to 2029.

Global Wires and cables Market

1. Preface 1.1. Report Scope and Market Segmentation 1.2. Research Highlights 1.3. Research Objectives 1.4. Key Questions Answered 2. Assumptions and Research Methodology 2.1. Report Assumptions 2.2. Abbreviations Used 2.3. Research Methodology 3. Executive Summary 3.1. Global Wires and Cables Market Size, by Market Value (US$ Bn) and Market, by Region 4. Market Overview 4.1. Introduction 4.2. Market Indicator 4.3. Drivers and Restraints Snapshot Analysis 4.3.1. Drivers 4.3.2. Restraints 4.3.3. Opportunities 4.3.4. Porter’s Analysis 4.3.5. Value Chain Analysis 4.3.6. SWOT Analysis 4.4. Global Wires and Cables Market Industry Trends 5. Global Wires and Cables Market Analysis and Forecast 5.1. Global Wires and Cables Market Analysis and Forecast 5.2. Global Wires and Cables Market Size& Y-o-Y Growth Analysis 5.2.1. North America 5.2.2. Europe 5.2.3. Asia Pacific 5.2.4. Middle East & Africa 5.2.5. Latin America 6. Global Wires and Cables Market Analysis and Forecast, by Installation 6.1. Introduction and Definition 6.2. Key Findings 6.3. Global Wires and Cables Market Value Share Analysis, by Installation 6.4. Global Wires and Cables Market Size (US$ Bn) Forecast, by Installation 6.5. Global Wires and Cables Market Analysis, by Installation 6.6. Wires and Cables Market Attractiveness Analysis, by Installation 7. Global Wires and Cables Market Analysis and Forecast, by Voltage 7.1. Introduction and Definition 7.2. Global Wires and Cables Market Value Share Analysis, by Voltage 7.3. Global Wires and Cables Market Size (US$ Bn) Forecast, by Voltage 7.4. Global Wires and Cables Market Analysis, by Voltage 7.5. Global Wires and Cables Market Attractiveness Analysis, by Voltage 8. Global Wires and Cables Market Analysis and Forecast, by End user 8.1. Introduction and Definition 8.2. Global Wires and Cables Market Value Share Analysis, by End user 8.3. Global Wires and Cables Market Size (US$ Bn) Forecast, by End user 8.4. Global Wires and Cables Market Analysis, by End user 8.5. Global Wires and Cables Market Attractiveness Analysis, by End user 9. Global Wires and Cables Market Analysis, by Region 9.1. Global Wires and Cables Market Value Share Analysis, by Region 9.2. Global Wires and Cables Market Size (US$ Bn) Forecast, by Region 9.3. Global Wires and Cables Market Attractiveness Analysis, by Region 10. North America Wires and Cables Market Analysis 10.1. Key Findings 10.2. North America Wires and Cables Market Overview 10.3. North America Wires and Cables Market Value Share Analysis, by Installation 10.4. North America Wires and Cables Market Forecast, by Installation 10.4.1. Overhead 10.4.2. Underground 10.5. North America Wires and Cables Market Value Share Analysis, by Voltage 10.6. North America Wires and Cables Market Forecast, by Voltage 10.6.1. Low 10.6.2. High 10.6.3. Extra high 10.7. North America Wires and Cables Market Value Share Analysis, by End user 10.8. North America Wires and Cables Market Forecast, by End user 10.8.1. Aerospace & Defence 10.8.2. Automotive 10.8.3. Building & Construction 10.8.4. Oil & Gas 10.8.5. Energy & Power 10.8.6. IT & Telecommunication 10.9. North America Wires and Cables Market Value Share Analysis, by Country 10.10. North America Wires and Cables Market Forecast, by Country 10.10.1. U.S. 10.10.2. Canada 10.11. North America Wires and Cables Market Analysis, by Country 10.12. U.S. Wires and Cables Market Forecast, by Installation 10.12.1. Overhead 10.12.2. Underground 10.13. U.S. Wires and Cables Market Forecast, by Voltage 10.13.1. Low 10.13.2. High 10.13.3. Extra high 10.14. U.S. Wires and Cables Market Forecast, by End user 10.14.1. Aerospace & Defence 10.14.2. Automotive 10.14.3. Building & Construction 10.14.4. Oil & Gas 10.14.5. Energy & Power 10.14.6. IT & Telecommunication 10.15. Canada Wires and Cables Market Forecast, by Installation 10.15.1. Overhead 10.15.2. Underground 10.16. Canada Wires and Cables Market Forecast, by Voltage 10.16.1. Low 10.16.2. High 10.16.3. Extra high 10.17. Canada Wires and Cables Market Forecast, by End user 10.17.1. Aerospace & Defence 10.17.2. Automotive 10.17.3. Building & Construction 10.17.4. Oil & Gas 10.17.5. Energy & Power 10.17.6. IT & Telecommunication 10.18. North America Wires and Cables Market Attractiveness Analysis 10.18.1. By Installation 10.18.2. By Voltage 10.18.3. By End user 10.19. PEST Analysis 11. Europe Wires and Cables Market Analysis 11.1. Key Findings 11.2. Europe Wires and Cables Market Overview 11.3. Europe Wires and Cables Market Value Share Analysis, by Installation 11.4. Europe Wires and Cables Market Forecast, by Installation 11.4.1. Overhead 11.4.2. Underground 11.5. Europe Wires and Cables Market Value Share Analysis, by Voltage 11.6. Europe Wires and Cables Market Forecast, by Voltage 11.6.1. Low 11.6.2. High 11.6.3. Extra high 11.7. Europe Wires and Cables Market Value Share Analysis, by End user 11.8. Europe Wires and Cables Market Forecast, by End user 11.8.1. Aerospace & Defence 11.8.2. Automotive 11.8.3. Building & Construction 11.8.4. Oil & Gas 11.8.5. Energy & Power 11.8.6. IT & Telecommunication 11.9. Europe Wires and Cables Market Value Share Analysis, by Country 11.10. Europe Wires and Cables Market Forecast, by Country 11.10.1. Germany 11.10.2. U.K. 11.10.3. France 11.10.4. Italy 11.10.5. Spain 11.10.6. Rest of Europe 11.11. Europe Wires and Cables Market Analysis, by Country/ Sub-region 11.12. Germany Wires and Cables Market Forecast, by Installation 11.12.1. Overhead 11.12.2. Underground 11.13. Germany Wires and Cables Market Forecast, by Voltage 11.13.1. Low 11.13.2. High 11.13.3. Extra high 11.14. Germany Wires and Cables Market Forecast, by End user 11.14.1. Aerospace & Defence 11.14.2. Automotive 11.14.3. Building & Construction 11.14.4. Oil & Gas 11.14.5. Energy & Power 11.14.6. IT & Telecommunication 11.15. U.K. Wires and Cables Market Forecast, by Installation 11.15.1. Overhead 11.15.2. Underground 11.16. U.K. Wires and Cables Market Forecast, by Voltage 11.16.1. Low 11.16.2. High 11.16.3. Extra high 11.17. U.K. Wires and Cables Market Forecast, by End user 11.17.1. Aerospace & Defence 11.17.2. Automotive 11.17.3. Building & Construction 11.17.4. Oil & Gas 11.17.5. Energy & Power 11.17.6. IT & Telecommunication 11.18. France Wires and Cables Market Forecast, by Installation 11.18.1. Overhead 11.18.2. Underground 11.19. France Wires and Cables Market Forecast, by Voltage 11.19.1. Low 11.19.2. High 11.19.3. Extra high 11.20. France Wires and Cables Market Forecast, by End user 11.20.1. Aerospace & Defence 11.20.2. Automotive 11.20.3. Building & Construction 11.20.4. Oil & Gas 11.20.5. Energy & Power 11.20.6. IT & Telecommunication 11.21. Italy Wires and Cables Market Forecast, by Installation 11.21.1. Overhead 11.21.2. Underground 11.22. Italy Wires and Cables Market Forecast, by Voltage 11.22.1. Low 11.22.2. High 11.22.3. Extra high 11.23. Italy Wires and Cables Market Forecast, by End user 11.23.1. Aerospace & Defence 11.23.2. Automotive 11.23.3. Building & Construction 11.23.4. Oil & Gas 11.23.5. Energy & Power 11.23.6. IT & Telecommunication 11.24. Spain Wires and Cables Market Forecast, by Installation 11.24.1. Overhead 11.24.2. Underground 11.25. Spain Wires and Cables Market Forecast, by Voltage 11.25.1. Low 11.25.2. High 11.25.3. Extra high 11.26. Spain Wires and Cables Market Forecast, by End user 11.26.1. Aerospace & Defence 11.26.2. Automotive 11.26.3. Building & Construction 11.26.4. Oil & Gas 11.26.5. Energy & Power 11.26.6. IT & Telecommunication 11.27. Rest of Europe Wires and Cables Market Forecast, by Installation 11.27.1. Overhead 11.27.2. Underground 11.28. Rest of Europe Wires and Cables Market Forecast, by Voltage 11.28.1. Low 11.28.2. High 11.28.3. Extra high 11.29. Rest of Europe Wires and Cables Market Forecast, by End user 11.29.1. Aerospace & Defence 11.29.2. Automotive 11.29.3. Building & Construction 11.29.4. Oil & Gas 11.29.5. Energy & Power 11.29.6. IT & Telecommunication 11.30. Europe Wires and Cables Market Attractiveness Analysis 11.30.1. By Installation 11.30.2. By Voltage 11.30.3. By End user 11.31. PEST Analysis 12. Asia Pacific Wires and Cables Market Analysis 12.1. Key Findings 12.2. Asia Pacific Wires and Cables Market Overview 12.3. Asia Pacific Wires and Cables Market Value Share Analysis, by Installation 12.4. Asia Pacific Wires and Cables Market Forecast, by Installation 12.4.1. Overhead 12.4.2. Underground 12.5. Asia Pacific Wires and Cables Market Value Share Analysis, by Voltage 12.6. Asia Pacific Wires and Cables Market Forecast, by Voltage 12.6.1. Low 12.6.2. High 12.6.3. Extra high 12.7. Asia Pacific Wires and Cables Market Value Share Analysis, by End user 12.8. Asia Pacific Wires and Cables Market Forecast, by End user 12.8.1. Aerospace & Defence 12.8.2. Automotive 12.8.3. Building & Construction 12.8.4. Oil & Gas 12.8.5. Energy & Power 12.8.6. IT & Telecommunication 12.9. Asia Pacific Wires and Cables Market Value Share Analysis, by Country 12.10. Asia Pacific Wires and Cables Market Forecast, by Country 12.10.1. China 12.10.2. India 12.10.3. Japan 12.10.4. ASEAN 12.10.5. Rest of Asia Pacific 12.11. Asia Pacific Wires and Cables Market Analysis, by Country/ Sub-region 12.12. China Wires and Cables Market Forecast, by Installation 12.12.1. Overhead 12.12.2. Underground 12.13. China Wires and Cables Market Forecast, by Voltage 12.13.1. Low 12.13.2. High 12.13.3. Extra high 12.14. China Wires and Cables Market Forecast, by End user 12.14.1. Aerospace & Defence 12.14.2. Automotive 12.14.3. Building & Construction 12.14.4. Oil & Gas 12.14.5. Energy & Power 12.14.6. IT & Telecommunication 12.15. India Wires and Cables Market Forecast, by Installation 12.15.1. Overhead 12.15.2. Underground 12.16. India Wires and Cables Market Forecast, by Voltage 12.16.1. Low 12.16.2. High 12.16.3. Extra high 12.17. India Wires and Cables Market Forecast, by End user 12.17.1. Aerospace & Defence 12.17.2. Automotive 12.17.3. Building & Construction 12.17.4. Oil & Gas 12.17.5. Energy & Power 12.17.6. IT & Telecommunication 12.18. Japan Wires and Cables Market Forecast, by Installation 12.18.1. Overhead 12.18.2. Underground 12.19. Japan Wires and Cables Market Forecast, by Voltage 12.19.1. Low 12.19.2. High 12.19.3. Extra high 12.20. Japan Wires and Cables Market Forecast, by End user 12.20.1. Aerospace & Defence 12.20.2. Automotive 12.20.3. Building & Construction 12.20.4. Oil & Gas 12.20.5. Energy & Power 12.20.6. IT & Telecommunication 12.21. ASEAN Wires and Cables Market Forecast, by Installation 12.21.1. Overhead 12.21.2. Underground 12.22. ASEAN Wires and Cables Market Forecast, by Voltage 12.22.1. Low 12.22.2. High 12.22.3. Extra high 12.23. ASEAN Wires and Cables Market Forecast, by End user 12.23.1. Aerospace & Defence 12.23.2. Automotive 12.23.3. Building & Construction 12.23.4. Oil & Gas 12.23.5. Energy & Power 12.23.6. IT & Telecommunication 12.24. Rest of Asia Pacific Wires and Cables Market Forecast, by Installation 12.24.1. Overhead 12.24.2. Underground 12.25. Rest of Asia Pacific Wires and Cables Market Forecast, by Voltage 12.25.1. Low 12.25.2. High 12.25.3. Extra high 12.26. Rest of Asia Pacific Wires and Cables Market Forecast, by End user 12.26.1. Aerospace & Defence 12.26.2. Automotive 12.26.3. Building & Construction 12.26.4. Oil & Gas 12.26.5. Energy & Power 12.26.6. IT & Telecommunication 12.27. Asia Pacific Wires and Cables Market Attractiveness Analysis 12.27.1. By Installation 12.27.2. By Voltage 12.27.3. By End user 12.28. PEST Analysis 13. Middle East & Africa Wires and Cables Market Analysis 13.1. Key Findings 13.2. Middle East & Africa Wires and Cables Market Overview 13.3. Middle East & Africa Wires and Cables Market Value Share Analysis, by Installation 13.4. Middle East & Africa Wires and Cables Market Forecast, by Installation 13.4.1. Overhead 13.4.2. Underground 13.5. Middle East & Africa Wires and Cables Market Value Share Analysis, by Voltage 13.6. Middle East & Africa Wires and Cables Market Forecast, by Voltage 13.6.1. Low 13.6.2. High 13.6.3. Extra high 13.7. Middle East & Africa Wires and Cables Market Value Share Analysis, by End user 13.8. Middle East & Africa Wires and Cables Market Forecast, by End user 13.8.1. Aerospace & Defence 13.8.2. Automotive 13.8.3. Building & Construction 13.8.4. Oil & Gas 13.8.5. Energy & Power 13.8.6. IT & Telecommunication 13.9. Middle East & Africa Wires and Cables Market Value Share Analysis, by Country 13.10. Middle East & Africa Wires and Cables Market Forecast, by Country 13.10.1. GCC 13.10.2. South Africa 13.10.3. Rest of Middle East & Africa 13.11. Middle East & Africa Wires and Cables Market Analysis, by Country/ Sub-region 13.12. GCC Wires and Cables Market Forecast, by Installation 13.12.1. Overhead 13.12.2. Underground 13.13. GCC Wires and Cables Market Forecast, by Voltage 13.13.1. Low 13.13.2. High 13.13.3. Extra high 13.14. GCC Wires and Cables Market Forecast, by End user 13.14.1. Aerospace & Defence 13.14.2. Automotive 13.14.3. Building & Construction 13.14.4. Oil & Gas 13.14.5. Energy & Power 13.14.6. IT & Telecommunication 13.15. South Africa Wires and Cables Market Forecast, by Installation 13.15.1. Overhead 13.15.2. Underground 13.16. South Africa Wires and Cables Market Forecast, by Voltage 13.16.1. Low 13.16.2. High 13.16.3. Extra high 13.17. South Africa Wires and Cables Market Forecast, by End user 13.17.1. Aerospace & Defence 13.17.2. Automotive 13.17.3. Building & Construction 13.17.4. Oil & Gas 13.17.5. Energy & Power 13.17.6. IT & Telecommunication 13.18. Rest of Middle East & Africa Wires and Cables Market Forecast, by Installation 13.18.1. Overhead 13.18.2. Underground 13.19. Rest of Middle East & Africa Wires and Cables Market Forecast, by Voltage 13.19.1. Low 13.19.2. High 13.19.3. Extra high 13.20. Rest of Middle East & Africa Wires and Cables Market Forecast, by End user 13.20.1. Aerospace & Defence 13.20.2. Automotive 13.20.3. Building & Construction 13.20.4. Oil & Gas 13.20.5. Energy & Power 13.20.6. IT & Telecommunication 13.21. Middle East & Africa Wires and Cables Market Attractiveness Analysis 13.21.1. By Installation 13.21.2. By Voltage 13.21.3. By End user 13.22. PEST Analysis 14. Latin America Wires and Cables Market Analysis 14.1. Key Findings 14.2. Latin America Wires and Cables Market Overview 14.3. Latin America Wires and Cables Market Value Share Analysis, by Installation 14.4. Latin America Wires and Cables Market Forecast, by Installation 14.4.1. Overhead 14.4.2. Underground 14.5. Latin America Wires and Cables Market Value Share Analysis, by Voltage 14.6. Latin America Wires and Cables Market Forecast, by Voltage 14.6.1. Low 14.6.2. High 14.6.3. Extra high 14.7. Latin America Wires and Cables Market Value Share Analysis, by End user 14.8. Latin America Wires and Cables Market Forecast, by End user 14.8.1. Aerospace & Defence 14.8.2. Automotive 14.8.3. Building & Construction 14.8.4. Oil & Gas 14.8.5. Energy & Power 14.8.6. IT & Telecommunication 14.9. Latin America Wires and Cables Market Value Share Analysis, by Country 14.10. Latin America Wires and Cables Market Forecast, by Country 14.10.1. Brazil 14.10.2. Mexico 14.10.3. Rest of Latin America 14.11. Latin America Wires and Cables Market Analysis, by Country/ Sub-region 14.12. Brazil Wires and Cables Market Forecast, by Installation 14.12.1. Overhead 14.12.2. Underground 14.13. Brazil Wires and Cables Market Forecast, by Voltage 14.13.1. Low 14.13.2. High 14.13.3. Extra high 14.14. Brazil Wires and Cables Market Forecast, by End user 14.14.1. Aerospace & Defence 14.14.2. Automotive 14.14.3. Building & Construction 14.14.4. Oil & Gas 14.14.5. Energy & Power 14.14.6. IT & Telecommunication 14.15. Mexico Wires and Cables Market Forecast, by Installation 14.15.1. Overhead 14.15.2. Underground 14.16. Mexico Wires and Cables Market Forecast, by Voltage 14.16.1. Low 14.16.2. High 14.16.3. Extra high 14.17. Mexico Wires and Cables Market Forecast, by End user 14.17.1. Aerospace & Defence 14.17.2. Automotive 14.17.3. Building & Construction 14.17.4. Oil & Gas 14.17.5. Energy & Power 14.17.6. IT & Telecommunication 14.18. Rest of Latin America Wires and Cables Market Forecast, by Installation 14.18.1. Overhead 14.18.2. Underground 14.19. Rest of Latin America Wires and Cables Market Forecast, by Voltage 14.19.1. Low 14.19.2. High 14.19.3. Extra high 14.20. Rest of Latin America Wires and Cables Market Forecast, by End user 14.20.1. Aerospace & Defence 14.20.2. Automotive 14.20.3. Building & Construction 14.20.4. Oil & Gas 14.20.5. Energy & Power 14.20.6. IT & Telecommunication 14.21. Latin America Wires and Cables Market Attractiveness Analysis 14.21.1. By Installation 14.21.2. By Voltage 14.21.3. By End user 14.22. PEST Analysis 15. Company Profiles 15.1. Market Share Analysis, by Company 15.2. Competition Matrix 15.3. Company Profiles: Key Players 15.3.1. Prysmian Group 15.3.1.1. Company Overview 15.3.1.2. Financial Overview 15.3.1.3. Business Strategy 15.3.1.4. Recent Developments 15.3.1.5. Manufacturing Footprint 15.3.2. Hengtong Optic-Electric Co Ltd. 15.3.3. Furukawa Electric Co., Ltd. 15.3.4. Sumitomo Electric Industries, Ltd. 15.3.5. General Cable Corporation 15.3.6. Jiagnan Group 15.3.7. TPC Wires & Cable Corp 15.3.8. LS Cable & System Ltd 15.3.9. Polycab Wires Private Limited 15.3.10. Southwires Company 15.3.11. LLC 15.3.12. Hitachi Metals Ltd 15.3.13. Nexans S.A. 15.3.14. Leoni AG 15.3.15. Far East Cable Co., Ltd 16. Primary Key Insights
  • INQUIRE BEFORE BUYING