Wet Chemicals Market – Industry Structure Evaluation, Demand Drivers Analysis, Regional Growth Analysis and Identification, Competitive Positioning / Landscape Review & Global Market Size Forecast to 2032

6.5%
CAGR (2026-2032)
8.62 USD Bn.
Market Size
305
Report Pages
139
Market Tables

Overview

The Wet Chemicals Market size was valued at USD 8.62 Billion in 2025 and the total Wet Chemicals revenue is expected to grow at a CAGR of 6.5% from 2026 to 2032, reaching nearly USD 13.40 Billion.

The rapid growth of e-waste has resulted in severe environmental impact along with other challenges associated with multifaceted resource recovery. Therefore, recycling e-waste, such as semiconductors, is necessary, and it gives industries an opportunity to reuse their expensive metals recovered from the recycling processes. The exponential growth in consumer electronics over the last decade has significantly increased the amount of e-waste which needs to be recycled, as these materials can prove to be hazardous to the environment and human health. This is expected to increase the demand for wet chemicals, further driving the growth of the wet chemicals market during the forecast period.

E-waste is the electronics that are nearing the end of their useful life and are discarded. E-waste has grown significantly in recent years due to rapid growth in the electronics industry. Over 80% of the E-waste generated remains unaccounted, and only 20 percent is documented as having been collected and recycled. Global e-waste generated reached a record 53.6 million metric tonnes. The annual E-waste generated globally has been continuously rising, and in the period 2020 to 2025, global e-waste grew by 21%. In 2018, the highest policy-making body of the ITU, the Plenipotentiary Conference, established a target to increase the global e-waste recycling rate to 30 percent by 2024 from 17% in 2018. Factors like these are expected to create new avenues for the growth of the demand for wet chemicals used in electronics and semiconductor applications, further driving the wet chemicals market growth.
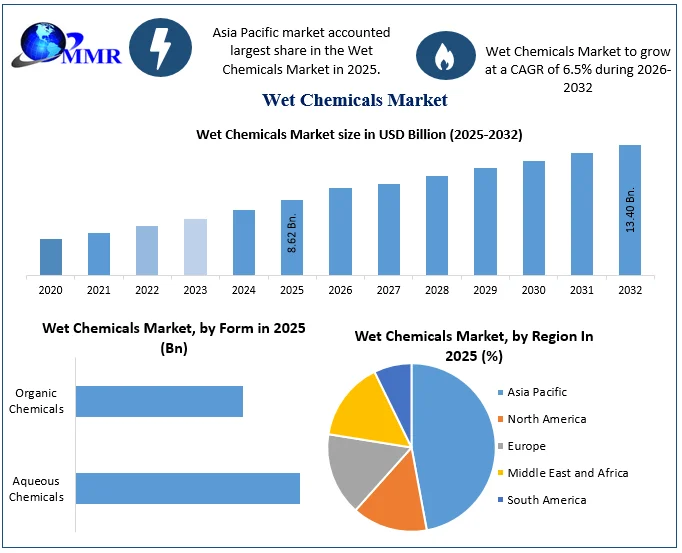
Wet Chemicals Market size

To know about the Research Methodology :- Request Free Sample Report

Favorable Wet Chemicals Market Growth for Semiconductors in Malaysia

Malaysia is more likely to attract multi-billion semiconductor investments from the United States, Japan, and Europe, where some of the niche FABs and supporting industries require to be relocated or have a ‘dual-location’ strategy. Malaysia has a long history of being a welcoming country for foreign investors, and it is one of the worldwide hubs for the electronic industry in Southeast Asia, with global reach. In February 2022, Leuze Electronic GmbH + Co. KG, a world-class optical sensor manufacturer, chose Malaysia as the location for its first Southeast Asian manufacturing facility. Factors like these are expected to create new avenues for the growth of the demand for wet chemicals, thus, driving the wet chemicals market growth during the forecast period.

Wet Chemicals Market Key Dynamics

Rising Demand from Industries Driven by Modern Technologies

In the electronics application, the demand for integrated circuit (IC) manufacturing and printed circuit boards (PCB) manufacturing is increasing at a steady rate, owing to the surging demand from smartphone production, automotive electronics, and a surge on the internet of things (IoT) applications. Smartphones account for a major chunk of the globally integrated circuits demand, and the increasing adoption of smartphones worldwide, especially in developing economies, is expected to further increase the production of, and demand for, ICs in the future, which may further increase the consumption of wet chemicals, further boosting the growth of the wet chemicals market during the forecast period.

Technological advancements in mobile service infrastructure and significant growth in the near field communication (NFC) services for purposes like mobile ticketing and access control are expected to provide growth opportunities for the wet chemicals market during the forecast period. This may increase the demand for wet chemicals during the forecast period. Countries like China, Germany, and India, among others, have witnessed continuous growth in the demand for electronics from various end-user industries in recent years. Regionally, The Asia-Pacific region is expected to be the key growth region for the wet chemicals market market, thanks to the increasing smartphone production base in China, India, and Taiwan.

Surging Demand for Hydrogen Peroxide from the Semiconductor Industry

Semiconductors are used in a wide range of applications and are becoming increasingly important to day-to-day life. Semiconductors are vital components in consumer electronics, including laptops and mobile phones, microwaves and refrigerators, game consoles, and others. The global sales of semiconductors have grown from USD 204.4 billion in 2000 to USD 440.4 billion in 2020, a compound annual growth rate of 3.91% per year. This is expected to drive the growth of the wet chemicals market. Regionally, Asia-pacific has the largest semiconductor manufacturing capacity. China, Taiwan, Japan, United States are the key countries engaged in semiconductor production. However, the share of the United States in the semiconductor manufacturing capacity has fallen in the last two decades, from 37% to around 12%. Whereas China's semiconductor production has experienced rapid growth in recent years.

China’s semiconductor device sales were just USD 13 billion in 2015, accounting for only 3.8% of global chip sales. In 2020, the Chinese semiconductor industry reached USD 39.8 billion in total annual sales, registering an annual growth rate of over 30%. European countries have also registered continuous growth in semiconductor sales. Semiconductor sales in July 2022 reached USD 4.465 billion, increasing by 2.7% compared to the previous month and registering a y-o-y growth rate of 7.2%.

Stringent Health and Environmental Regulations on the Use of Certain Chemicals

Acids are hazardous and corrosive in nature. The electronic grades of acids are the grades with the highest purity and concentration, thereby increasing the risk factor associated with them. For example, Sulphuric acid, which has a purity of over 90%, is used for electronic applications. This electronic-grade Sulphuric acid is highly corrosive in nature and capable of corroding skin, paper, metals, and even stone in some cases. Unprotected exposure to this acid is destructive to the skin, eyes, teeth, and lungs. Long unprotected exposure to electronic-grade sulphuric acid can even lead to death. Because of the risk factors associated with these chemicals' various regulatory bodies in many parts of the world have issued regulations for the safe handling of these chemicals. This is expected to restraint the wet chemicals market growth during the forecast period.

Due to the corrosive and hazardous nature of wet chemicals, various regulatory bodies like the National Institute for Occupational Safety and Health (NIOSH) in the United States, European Chemicals Agency (ECHA) in the EU, and the Canadian Center for Occupational Health and Safety (CCOHS) among others have placed regulations on the usage of these chemicals to reduce workplace hazards. In 2019, European Union further restricted the sale of key wet chemicals like Hydrogen peroxide, acetone, and sulfuric acid through regulatory reforms, as these substances are also used as explosive precursors. Regulations like these are expected to negatively affect the demand for certain wet chemicals, but as most of these regulations were enforced since the early 2000s, the impact of these on the wet chemicals will be low during the forecast period.

Wet Chemicals Market Segment Overview

Based on the grade, industrial grade segment held the largest share of more than 30% in the wet chemicals market in 2025. Wet chemicals of industrial grades are used as intermediates in the agrochemical industry to make insecticides and as an electrolyte in batteries. Increasing environmental concerns and rising demand for electric cars are driving up demand for lithium ion batteries, which is further driving the growth of wet chemicals industry. In 2025, the global stock of electric vehicles increased by 63%. As a result of the rise in electric cars, the usage of wet chemicals as an electrolyte in batteries has increased.

Based on application, the market is segmented into semiconductor and other electronic applications. Semiconductor is further segmented into cleaning and etching. Other electronic applications segment is sub segmented Integrated Circuit (IC) manufacturing and Printed Circuit Boards (PCB) manufacturing. Cleaning is expected to dominate the global wet chemicals market over the forecast period.

The cleaning process is expected to reach USD 555.12 million by 2025, with a CAGR of 7.89% during the forecast period. The cleaning process comprises removing impurities from the wafer surfaces as well as controlling the degree of developed oxide on the wafer. The etching segment is also likely to increase significantly in the near future. In 2025, the etching process accounted for a large portion of the entire semiconductor application in the global wet chemicals market. Etching is widely used in the development and manufacture of silicon devices, systems, and circuits.

Wet Chemicals Market Regional Insights

The Asia-Pacific region dominated the global Wet Chemicals market in 2025. With rising demand for electronics in nations such as China, India, and Japan, the region's use of wet chemicals is increasing. China has the world's largest electronics manufacturing base. China is a major producer of electronic items such as cellphones, televisions, wires and cables, portable computer devices, gaming systems, and other personal electronic gadgets. The previous year's export value of Chinese electronics] goods increased by about 11.4% in 2025. Due to continuous demand from the global market, prominent manufacturers' sales increased by 16.2% year on year.

China is a net importer of semiconductor chips, producing less than 20% of the semiconductors consumed. Because of the profitable demand in both local and foreign markets, 38 of 86 Chinese-listed semiconductor businesses declared net profits in their yearly sales in 2025, showing a favourable need for the industry's wet chemicals. China's integrated circuit sector has grown steadily in recent years, thanks to high market demand and favourable government policies. Chinese integrated circuit sales will surpass CNY 1 trillion (USD 157.08 billion) for the first time in 2025. Despite recent increases in manufacturing capacity, China continues to rely significantly on imports.

Furthermore, the domestic electronics manufacturing sector in India has been steadily expanding as a result of favourable government policies such as 100% Foreign Direct Investment (FDI), no industrial licence requirement, and the technological transition from manual to automatic production processes. New incentives, such as the Modified Incentive Special Package Scheme (M-SIPS) and the Electronics Development Fund (EDF), have been launched in the nation with a USD 114 million budget for domestic electronics production in India. By 2025, the country's semiconductor component industry is expected to be worth USD 32.35 billion. The government's continuing "Make in India" campaign is expected to result in investments in the country's semiconductor industry.

Furthermore, the Indian Ministry of Electronics and Information Technology said that during the next five years, firms will make smartphones and other electronic components worth more than USD 143 billion. Samsung and three Apple contract manufacturing partners, together with 16 other businesses, got USD 6.65 billion in incentives as part of India's goal to increase local smartphone production over the next five years. The country's increasing smartphone production is expected to boost demand for PCBs, driving the market for wet chemicals over the forecast period. During the forecast period, all of the aforementioned reasons are expected to increase overall demand for wet chemicals in the Asia-Pacific region.

Wet Chemicals Market Scope: Inquiry Before Buying 

Global Wet Chemicals Market
Report Coverage Details
Base Year: 2025 Forecast Period: 2026-2032
Historical Data: 2020 to 2025 Market Size in 2025: USD 8.62 Bn.
Forecast Period 2026 to 2032 CAGR: 6.5 % Market Size in 2032: USD 13.40 Bn.
Segments Covered: by Form 1. Aqueous Chemicals
2. Organic Chemicals
by Grade 1. Agriculture Grade
2. Electronic Grade
3. Food Grade
4. Industrial Grade
5. Others
by Product 1. Acids
2. Bases
3. Solvents
4.Oxidizers
5. Others
by Application 1. Semiconductor
1. Etching
2. Cleaning
2. Others
1. Integrated Circuity (IC) Manufacturing
2. Printed Circuit Boards (PCB) Manufacturing
by End-User Industry 1. Electronics
2. Consumer Goods
3. Agrochemicals
4. Automotive
5. Textile
6. Aerospace & Defense
7. Personal & Beauty Care
8. Medical
9. Others

Wet Chemicals Market, by Region

North America (United States, Canada and Mexico)
Europe (UK, France, Germany, Italy, Spain, Sweden, Austria and Rest of Europe)
Asia Pacific (China, South Korea, Japan, India, Australia, Indonesia, Malaysia, Vietnam, Taiwan, Bangladesh, Pakistan and Rest of APAC)
Middle East and Africa (South Africa, GCC, Egypt, Nigeria and Rest of ME&A)
South America (Brazil, Argentina Rest of South America)

Leading Companies in the Wet Chemicals Industry

1. BASF SE
2. Chang Chun Group
3. Dow
4. Eastman Chemical Company
5. Evonik Industries
6. Formosa Daikin Advanced Chemicals Co. Ltd.
7. Honeywell International Inc.
8. Hubei Xingfa Chemicals Group Co. Ltd.
9. KANTO KAGAKU
10. Mitsubishi Electric Corporation
11. Rin Kagaku Kogyo Co. Ltd.
12. Santoku Chemical Industries Co. Ltd.
13. Solvay Inc.
14. Yingpeng Chemical Co. Ltd.
15. Zhejiang Kaisn Fluorochemical Co. Ltd.
16. Avantor Inc.
17. CMC Materials
18. FUJIFILM Corporation
19. KMG Chemicals
20. Linde PLC
21. Songwon
22. Technic Inc.
23. T.N.C. Industrial Co. Ltd

Frequently Asked Questions:

1] What is the growth rate of the Global Wet Chemicals Market?
Ans. The Global Wet Chemicals Market is growing at a significant rate of 6.5% during the forecast period.

2] Which region is expected to have the highest growth rate in the Global Wet Chemicals Market?
Ans. The Asia Pacific region is expected to hold the highest growth rate in the Wet Chemicals Market during the forecast period.

3] What was the Global Wet Chemicals Market size in 2025?
Ans: The Global Wet Chemicals Market size was USD 8.62 Billion in 2025.

4] What are the major key players of the Global Wet Chemicals Market?
Ans. The major key players of the Global Wet Chemicals Market are BASF SE, Chang Chun Group, Dow, Eastman Chemical Company, Evonik Industries, Formosa Daikin Advanced Chemicals Co. Ltd., and Honeywell International Inc.

5] What factors are driving the growth of the Global Wet Chemicals Market in 2025?
Ans. Rising demand from industries driven by modern technologies and surging demand for hydrogen peroxide from the semiconductor industry are the major factors expected to drive the Global Wet Chemicals Market during the forecast period.

Table of Contents

1. Wet Chemicals Market Introduction 1.1. Study Assumption and Market Definition 1.2. Scope of the Study 1.3. Executive Summary 2. Global Wet Chemicals Market: Competitive Landscape 2.1. MMR Competition Matrix 2.2. Competitive Landscape 2.3. Key Players Benchmarking 2.3.1. Company Name 2.3.2. Business Segment 2.3.3. End-user Segment 2.3.4. Revenue (2025) 2.3.5. Company Locations 2.4. Leading Wet Chemicals Market Companies, by market capitalization 2.5. Market Structure 2.5.1. Market Leaders 2.5.2. Market Followers 2.5.3. Emerging Players 2.6. Mergers and Acquisitions Details 3. Wet Chemicals Market: Dynamics 3.1. Wet Chemicals Market Trends by Region 3.1.1. North America Wet Chemicals Market Trends 3.1.2. Europe Wet Chemicals Market Trends 3.1.3. Asia Pacific Wet Chemicals Market Trends 3.1.4. Middle East and Africa Wet Chemicals Market Trends 3.1.5. South America Wet Chemicals Market Trends 3.2. Wet Chemicals Market Dynamics by Region 3.2.1. North America 3.2.1.1. North America Wet Chemicals Market Drivers 3.2.1.2. North America Wet Chemicals Market Restraints 3.2.1.3. North America Wet Chemicals Market Opportunities 3.2.1.4. North America Wet Chemicals Market Challenges 3.2.2. Europe 3.2.2.1. Europe Wet Chemicals Market Drivers 3.2.2.2. Europe Wet Chemicals Market Restraints 3.2.2.3. Europe Wet Chemicals Market Opportunities 3.2.2.4. Europe Wet Chemicals Market Challenges 3.2.3. Asia Pacific 3.2.3.1. Asia Pacific Wet Chemicals Market Drivers 3.2.3.2. Asia Pacific Wet Chemicals Market Restraints 3.2.3.3. Asia Pacific Wet Chemicals Market Opportunities 3.2.3.4. Asia Pacific Wet Chemicals Market Challenges 3.2.4. Middle East and Africa 3.2.4.1. Middle East and Africa Wet Chemicals Market Drivers 3.2.4.2. Middle East and Africa Wet Chemicals Market Restraints 3.2.4.3. Middle East and Africa Wet Chemicals Market Opportunities 3.2.4.4. Middle East and Africa Wet Chemicals Market Challenges 3.2.5. South America 3.2.5.1. South America Wet Chemicals Market Drivers 3.2.5.2. South America Wet Chemicals Market Restraints 3.2.5.3. South America Wet Chemicals Market Opportunities 3.2.5.4. South America Wet Chemicals Market Challenges 3.3. PORTER's Five Forces Analysis 3.4. PESTLE Analysis 3.5. Technology Roadmap 3.6. Regulatory Landscape by Region 3.6.1. North America 3.6.2. Europe 3.6.3. Asia Pacific 3.6.4. Middle East and Africa 3.6.5. South America 3.7. Key Opinion Leader Analysis For Wet Chemicals Industry 3.8. Analysis of Government Schemes and Initiatives For Wet Chemicals Industry 3.9. Wet Chemicals Market Trade Analysis 3.10. The Global Pandemic Impact on Wet Chemicals Market 4. Wet Chemicals Market: Global Market Size and Forecast by Segmentation (in USD Billion) 2025-2032 4.1. Wet Chemicals Market Size and Forecast, by Form (2025-2032) 4.1.1. 1. Aqueous Chemicals 4.1.2. 2. Organic Chemicals 4.2. Wet Chemicals Market Size and Forecast, by Grade (2025-2032) 4.2.1. 1. Agriculture Grade 4.2.2. 2. Electronic Grade 4.2.3. 3. Food Grade 4.2.4. 4. Industrial Grade 4.2.5. 5. Others 4.3. Wet Chemicals Market Size and Forecast, by Product (2025-2032) 4.3.1. 1. Acids 4.3.2. 2. Bases 4.3.3. 3. Solvents 4.3.4. 4.Oxidizers 4.3.5. 5. Others 4.4. Wet Chemicals Market Size and Forecast, by Application (2025-2032) 4.4.1. 1. Semiconductor 4.4.2. 1. Etching 4.4.3. 2. Cleaning 4.4.4. 2. Others 4.4.5. 1. Integrated Circuity (IC) Manufacturing 4.4.6. 2. Printed Circuit Boards (PCB) Manufacturing 4.5. Wet Chemicals Market Size and Forecast, by End-User Industry (2025-2032) 4.5.1. 1. Electronics 4.5.2. 2. Consumer Goods 4.5.3. 3. Agrochemicals 4.5.4. 4. Automotive 4.5.5. 5. Textile 4.5.6. 6. Aerospace & Defense 4.5.7. 7. Personal & Beauty Care 4.5.8. 8. Medical 4.5.9. 9. Others 4.6. Wet Chemicals Market Size and Forecast, by Region (2025-2032) 4.6.1. North America 4.6.2. Europe 4.6.3. Asia Pacific 4.6.4. Middle East and Africa 4.6.5. South America 5. North America Wet Chemicals Market Size and Forecast by Segmentation (in USD Billion) 2025-2032 5.1. North America Wet Chemicals Market Size and Forecast, by Form (2025-2032) 5.1.1. 1. Aqueous Chemicals 5.1.2. 2. Organic Chemicals 5.2. North America Wet Chemicals Market Size and Forecast, by Grade (2025-2032) 5.2.1. 1. Agriculture Grade 5.2.2. 2. Electronic Grade 5.2.3. 3. Food Grade 5.2.4. 4. Industrial Grade 5.2.5. 5. Others 5.3. North America Wet Chemicals Market Size and Forecast, by Product (2025-2032) 5.3.1. 1. Acids 5.3.2. 2. Bases 5.3.3. 3. Solvents 5.3.4. 4.Oxidizers 5.3.5. 5. Others 5.4. North America Wet Chemicals Market Size and Forecast, by Application (2025-2032) 5.4.1. 1. Semiconductor 5.4.2. 1. Etching 5.4.3. 2. Cleaning 5.4.4. 2. Others 5.4.5. 1. Integrated Circuity (IC) Manufacturing 5.4.6. 2. Printed Circuit Boards (PCB) Manufacturing 5.5. North America Wet Chemicals Market Size and Forecast, by End-User Industry (2025-2032) 5.5.1. 1. Electronics 5.5.2. 2. Consumer Goods 5.5.3. 3. Agrochemicals 5.5.4. 4. Automotive 5.5.5. 5. Textile 5.5.6. 6. Aerospace & Defense 5.5.7. 7. Personal & Beauty Care 5.5.8. 8. Medical 5.5.9. 9. Others 5.6. North America Wet Chemicals Market Size and Forecast, by Country (2025-2032) 5.6.1. United States 5.6.1.1. United States Wet Chemicals Market Size and Forecast, by Form (2025-2032) 5.6.1.1.1. 1. Aqueous Chemicals 5.6.1.1.2. 2. Organic Chemicals 5.6.1.2. United States Wet Chemicals Market Size and Forecast, by Grade (2025-2032) 5.6.1.2.1. 1. Agriculture Grade 5.6.1.2.2. 2. Electronic Grade 5.6.1.2.3. 3. Food Grade 5.6.1.2.4. 4. Industrial Grade 5.6.1.2.5. 5. Others 5.6.1.3. United States Wet Chemicals Market Size and Forecast, by Product (2025-2032) 5.6.1.3.1. 1. Acids 5.6.1.3.2. 2. Bases 5.6.1.3.3. 3. Solvents 5.6.1.3.4. 4.Oxidizers 5.6.1.3.5. 5. Others 5.6.1.4. United States Wet Chemicals Market Size and Forecast, by Application (2025-2032) 5.6.1.4.1. 1. Semiconductor 5.6.1.4.2. 1. Etching 5.6.1.4.3. 2. Cleaning 5.6.1.4.4. 2. Others 5.6.1.4.5. 1. Integrated Circuity (IC) Manufacturing 5.6.1.4.6. 2. Printed Circuit Boards (PCB) Manufacturing 5.6.1.5. United States Wet Chemicals Market Size and Forecast, by End-User Industry (2025-2032) 5.6.1.5.1. 1. Electronics 5.6.1.5.2. 2. Consumer Goods 5.6.1.5.3. 3. Agrochemicals 5.6.1.5.4. 4. Automotive 5.6.1.5.5. 5. Textile 5.6.1.5.6. 6. Aerospace & Defense 5.6.1.5.7. 7. Personal & Beauty Care 5.6.1.5.8. 8. Medical 5.6.1.5.9. 9. Others 5.6.2. Canada 5.6.2.1. Canada Wet Chemicals Market Size and Forecast, by Form (2025-2032) 5.6.2.1.1. 1. Aqueous Chemicals 5.6.2.1.2. 2. Organic Chemicals 5.6.2.2. Canada Wet Chemicals Market Size and Forecast, by Grade (2025-2032) 5.6.2.2.1. 1. Agriculture Grade 5.6.2.2.2. 2. Electronic Grade 5.6.2.2.3. 3. Food Grade 5.6.2.2.4. 4. Industrial Grade 5.6.2.2.5. 5. Others 5.6.2.3. Canada Wet Chemicals Market Size and Forecast, by Product (2025-2032) 5.6.2.3.1. 1. Acids 5.6.2.3.2. 2. Bases 5.6.2.3.3. 3. Solvents 5.6.2.3.4. 4.Oxidizers 5.6.2.3.5. 5. Others 5.6.2.4. Canada Wet Chemicals Market Size and Forecast, by Application (2025-2032) 5.6.2.4.1. 1. Semiconductor 5.6.2.4.2. 1. Etching 5.6.2.4.3. 2. Cleaning 5.6.2.4.4. 2. Others 5.6.2.4.5. 1. Integrated Circuity (IC) Manufacturing 5.6.2.4.6. 2. Printed Circuit Boards (PCB) Manufacturing 5.6.2.5. Canada Wet Chemicals Market Size and Forecast, by End-User Industry (2025-2032) 5.6.2.5.1. 1. Electronics 5.6.2.5.2. 2. Consumer Goods 5.6.2.5.3. 3. Agrochemicals 5.6.2.5.4. 4. Automotive 5.6.2.5.5. 5. Textile 5.6.2.5.6. 6. Aerospace & Defense 5.6.2.5.7. 7. Personal & Beauty Care 5.6.2.5.8. 8. Medical 5.6.2.5.9. 9. Others 5.6.3. Mexico 5.6.3.1. Mexico Wet Chemicals Market Size and Forecast, by Form (2025-2032) 5.6.3.1.1. 1. Aqueous Chemicals 5.6.3.1.2. 2. Organic Chemicals 5.6.3.2. Mexico Wet Chemicals Market Size and Forecast, by Grade (2025-2032) 5.6.3.2.1. 1. Agriculture Grade 5.6.3.2.2. 2. Electronic Grade 5.6.3.2.3. 3. Food Grade 5.6.3.2.4. 4. Industrial Grade 5.6.3.2.5. 5. Others 5.6.3.3. Mexico Wet Chemicals Market Size and Forecast, by Product (2025-2032) 5.6.3.3.1. 1. Acids 5.6.3.3.2. 2. Bases 5.6.3.3.3. 3. Solvents 5.6.3.3.4. 4.Oxidizers 5.6.3.3.5. 5. Others 5.6.3.4. Mexico Wet Chemicals Market Size and Forecast, by Application (2025-2032) 5.6.3.4.1. 1. Semiconductor 5.6.3.4.2. 1. Etching 5.6.3.4.3. 2. Cleaning 5.6.3.4.4. 2. Others 5.6.3.4.5. 1. Integrated Circuity (IC) Manufacturing 5.6.3.4.6. 2. Printed Circuit Boards (PCB) Manufacturing 5.6.3.5. Mexico Wet Chemicals Market Size and Forecast, by End-User Industry (2025-2032) 5.6.3.5.1. 1. Electronics 5.6.3.5.2. 2. Consumer Goods 5.6.3.5.3. 3. Agrochemicals 5.6.3.5.4. 4. Automotive 5.6.3.5.5. 5. Textile 5.6.3.5.6. 6. Aerospace & Defense 5.6.3.5.7. 7. Personal & Beauty Care 5.6.3.5.8. 8. Medical 5.6.3.5.9. 9. Others 6. Europe Wet Chemicals Market Size and Forecast by Segmentation (in USD Billion) 2025-2032 6.1. Europe Wet Chemicals Market Size and Forecast, by Form (2025-2032) 6.2. Europe Wet Chemicals Market Size and Forecast, by Grade (2025-2032) 6.3. Europe Wet Chemicals Market Size and Forecast, by Product (2025-2032) 6.4. Europe Wet Chemicals Market Size and Forecast, by Application (2025-2032) 6.5. Europe Wet Chemicals Market Size and Forecast, by End-User Industry (2025-2032) 6.6. Europe Wet Chemicals Market Size and Forecast, by Country (2025-2032) 6.6.1. United Kingdom 6.6.1.1. United Kingdom Wet Chemicals Market Size and Forecast, by Form (2025-2032) 6.6.1.2. United Kingdom Wet Chemicals Market Size and Forecast, by Grade (2025-2032) 6.6.1.3. United Kingdom Wet Chemicals Market Size and Forecast, by Product (2025-2032) 6.6.1.4. United Kingdom Wet Chemicals Market Size and Forecast, by Application (2025-2032) 6.6.1.5. United Kingdom Wet Chemicals Market Size and Forecast, by End-User Industry (2025-2032) 6.6.2. France 6.6.2.1. France Wet Chemicals Market Size and Forecast, by Form (2025-2032) 6.6.2.2. France Wet Chemicals Market Size and Forecast, by Grade (2025-2032) 6.6.2.3. France Wet Chemicals Market Size and Forecast, by Product (2025-2032) 6.6.2.4. France Wet Chemicals Market Size and Forecast, by Application (2025-2032) 6.6.2.5. France Wet Chemicals Market Size and Forecast, by End-User Industry (2025-2032) 6.6.3. Germany 6.6.3.1. Germany Wet Chemicals Market Size and Forecast, by Form (2025-2032) 6.6.3.2. Germany Wet Chemicals Market Size and Forecast, by Grade (2025-2032) 6.6.3.3. Germany Wet Chemicals Market Size and Forecast, by Product (2025-2032) 6.6.3.4. Germany Wet Chemicals Market Size and Forecast, by Application (2025-2032) 6.6.3.5. Germany Wet Chemicals Market Size and Forecast, by End-User Industry (2025-2032) 6.6.4. Italy 6.6.4.1. Italy Wet Chemicals Market Size and Forecast, by Form (2025-2032) 6.6.4.2. Italy Wet Chemicals Market Size and Forecast, by Grade (2025-2032) 6.6.4.3. Italy Wet Chemicals Market Size and Forecast, by Product (2025-2032) 6.6.4.4. Italy Wet Chemicals Market Size and Forecast, by Application (2025-2032) 6.6.4.5. Italy Wet Chemicals Market Size and Forecast, by End-User Industry (2025-2032) 6.6.5. Spain 6.6.5.1. Spain Wet Chemicals Market Size and Forecast, by Form (2025-2032) 6.6.5.2. Spain Wet Chemicals Market Size and Forecast, by Grade (2025-2032) 6.6.5.3. Spain Wet Chemicals Market Size and Forecast, by Product (2025-2032) 6.6.5.4. Spain Wet Chemicals Market Size and Forecast, by Application (2025-2032) 6.6.5.5. Spain Wet Chemicals Market Size and Forecast, by End-User Industry (2025-2032) 6.6.6. Sweden 6.6.6.1. Sweden Wet Chemicals Market Size and Forecast, by Form (2025-2032) 6.6.6.2. Sweden Wet Chemicals Market Size and Forecast, by Grade (2025-2032) 6.6.6.3. Sweden Wet Chemicals Market Size and Forecast, by Product (2025-2032) 6.6.6.4. Sweden Wet Chemicals Market Size and Forecast, by Application (2025-2032) 6.6.6.5. Sweden Wet Chemicals Market Size and Forecast, by End-User Industry (2025-2032) 6.6.7. Austria 6.6.7.1. Austria Wet Chemicals Market Size and Forecast, by Form (2025-2032) 6.6.7.2. Austria Wet Chemicals Market Size and Forecast, by Grade (2025-2032) 6.6.7.3. Austria Wet Chemicals Market Size and Forecast, by Product (2025-2032) 6.6.7.4. Austria Wet Chemicals Market Size and Forecast, by Application (2025-2032) 6.6.7.5. Austria Wet Chemicals Market Size and Forecast, by End-User Industry (2025-2032) 6.6.8. Rest of Europe 6.6.8.1. Rest of Europe Wet Chemicals Market Size and Forecast, by Form (2025-2032) 6.6.8.2. Rest of Europe Wet Chemicals Market Size and Forecast, by Grade (2025-2032) 6.6.8.3. Rest of Europe Wet Chemicals Market Size and Forecast, by Product (2025-2032) 6.6.8.4. Rest of Europe Wet Chemicals Market Size and Forecast, by Application (2025-2032) 6.6.8.5. Rest of Europe Wet Chemicals Market Size and Forecast, by End-User Industry (2025-2032) 7. Asia Pacific Wet Chemicals Market Size and Forecast by Segmentation (in USD Billion) 2025-2032 7.1. Asia Pacific Wet Chemicals Market Size and Forecast, by Form (2025-2032) 7.2. Asia Pacific Wet Chemicals Market Size and Forecast, by Grade (2025-2032) 7.3. Asia Pacific Wet Chemicals Market Size and Forecast, by Product (2025-2032) 7.4. Asia Pacific Wet Chemicals Market Size and Forecast, by Application (2025-2032) 7.5. Asia Pacific Wet Chemicals Market Size and Forecast, by End-User Industry (2025-2032) 7.6. Asia Pacific Wet Chemicals Market Size and Forecast, by Country (2025-2032) 7.6.1. China 7.6.1.1. China Wet Chemicals Market Size and Forecast, by Form (2025-2032) 7.6.1.2. China Wet Chemicals Market Size and Forecast, by Grade (2025-2032) 7.6.1.3. China Wet Chemicals Market Size and Forecast, by Product (2025-2032) 7.6.1.4. China Wet Chemicals Market Size and Forecast, by Application (2025-2032) 7.6.1.5. China Wet Chemicals Market Size and Forecast, by End-User Industry (2025-2032) 7.6.2. S Korea 7.6.2.1. S Korea Wet Chemicals Market Size and Forecast, by Form (2025-2032) 7.6.2.2. S Korea Wet Chemicals Market Size and Forecast, by Grade (2025-2032) 7.6.2.3. S Korea Wet Chemicals Market Size and Forecast, by Product (2025-2032) 7.6.2.4. S Korea Wet Chemicals Market Size and Forecast, by Application (2025-2032) 7.6.2.5. S Korea Wet Chemicals Market Size and Forecast, by End-User Industry (2025-2032) 7.6.3. Japan 7.6.3.1. Japan Wet Chemicals Market Size and Forecast, by Form (2025-2032) 7.6.3.2. Japan Wet Chemicals Market Size and Forecast, by Grade (2025-2032) 7.6.3.3. Japan Wet Chemicals Market Size and Forecast, by Product (2025-2032) 7.6.3.4. Japan Wet Chemicals Market Size and Forecast, by Application (2025-2032) 7.6.3.5. Japan Wet Chemicals Market Size and Forecast, by End-User Industry (2025-2032) 7.6.4. India 7.6.4.1. India Wet Chemicals Market Size and Forecast, by Form (2025-2032) 7.6.4.2. India Wet Chemicals Market Size and Forecast, by Grade (2025-2032) 7.6.4.3. India Wet Chemicals Market Size and Forecast, by Product (2025-2032) 7.6.4.4. India Wet Chemicals Market Size and Forecast, by Application (2025-2032) 7.6.4.5. India Wet Chemicals Market Size and Forecast, by End-User Industry (2025-2032) 7.6.5. Australia 7.6.5.1. Australia Wet Chemicals Market Size and Forecast, by Form (2025-2032) 7.6.5.2. Australia Wet Chemicals Market Size and Forecast, by Grade (2025-2032) 7.6.5.3. Australia Wet Chemicals Market Size and Forecast, by Product (2025-2032) 7.6.5.4. Australia Wet Chemicals Market Size and Forecast, by Application (2025-2032) 7.6.5.5. Australia Wet Chemicals Market Size and Forecast, by End-User Industry (2025-2032) 7.6.6. Indonesia 7.6.6.1. Indonesia Wet Chemicals Market Size and Forecast, by Form (2025-2032) 7.6.6.2. Indonesia Wet Chemicals Market Size and Forecast, by Grade (2025-2032) 7.6.6.3. Indonesia Wet Chemicals Market Size and Forecast, by Product (2025-2032) 7.6.6.4. Indonesia Wet Chemicals Market Size and Forecast, by Application (2025-2032) 7.6.6.5. Indonesia Wet Chemicals Market Size and Forecast, by End-User Industry (2025-2032) 7.6.7. Malaysia 7.6.7.1. Malaysia Wet Chemicals Market Size and Forecast, by Form (2025-2032) 7.6.7.2. Malaysia Wet Chemicals Market Size and Forecast, by Grade (2025-2032) 7.6.7.3. Malaysia Wet Chemicals Market Size and Forecast, by Product (2025-2032) 7.6.7.4. Malaysia Wet Chemicals Market Size and Forecast, by Application (2025-2032) 7.6.7.5. Malaysia Wet Chemicals Market Size and Forecast, by End-User Industry (2025-2032) 7.6.8. Vietnam 7.6.8.1. Vietnam Wet Chemicals Market Size and Forecast, by Form (2025-2032) 7.6.8.2. Vietnam Wet Chemicals Market Size and Forecast, by Grade (2025-2032) 7.6.8.3. Vietnam Wet Chemicals Market Size and Forecast, by Product (2025-2032) 7.6.8.4. Vietnam Wet Chemicals Market Size and Forecast, by Application (2025-2032) 7.6.8.5. Vietnam Wet Chemicals Market Size and Forecast, by End-User Industry (2025-2032) 7.6.9. Taiwan 7.6.9.1. Taiwan Wet Chemicals Market Size and Forecast, by Form (2025-2032) 7.6.9.2. Taiwan Wet Chemicals Market Size and Forecast, by Grade (2025-2032) 7.6.9.3. Taiwan Wet Chemicals Market Size and Forecast, by Product (2025-2032) 7.6.9.4. Taiwan Wet Chemicals Market Size and Forecast, by Application (2025-2032) 7.6.9.5. Taiwan Wet Chemicals Market Size and Forecast, by End-User Industry (2025-2032) 7.6.10. Rest of Asia Pacific 7.6.10.1. Rest of Asia Pacific Wet Chemicals Market Size and Forecast, by Form (2025-2032) 7.6.10.2. Rest of Asia Pacific Wet Chemicals Market Size and Forecast, by Grade (2025-2032) 7.6.10.3. Rest of Asia Pacific Wet Chemicals Market Size and Forecast, by Product (2025-2032) 7.6.10.4. Rest of Asia Pacific Wet Chemicals Market Size and Forecast, by Application (2025-2032) 7.6.10.5. Rest of Asia Pacific Wet Chemicals Market Size and Forecast, by End-User Industry (2025-2032) 8. Middle East and Africa Wet Chemicals Market Size and Forecast by Segmentation (in USD Billion) 2025-2032 8.1. Middle East and Africa Wet Chemicals Market Size and Forecast, by Form (2025-2032) 8.2. Middle East and Africa Wet Chemicals Market Size and Forecast, by Grade (2025-2032) 8.3. Middle East and Africa Wet Chemicals Market Size and Forecast, by Product (2025-2032) 8.4. Middle East and Africa Wet Chemicals Market Size and Forecast, by Application (2025-2032) 8.5. Middle East and Africa Wet Chemicals Market Size and Forecast, by End-User Industry (2025-2032) 8.6. Middle East and Africa Wet Chemicals Market Size and Forecast, by Country (2025-2032) 8.6.1. South Africa 8.6.1.1. South Africa Wet Chemicals Market Size and Forecast, by Form (2025-2032) 8.6.1.2. South Africa Wet Chemicals Market Size and Forecast, by Grade (2025-2032) 8.6.1.3. South Africa Wet Chemicals Market Size and Forecast, by Product (2025-2032) 8.6.1.4. South Africa Wet Chemicals Market Size and Forecast, by Application (2025-2032) 8.6.1.5. South Africa Wet Chemicals Market Size and Forecast, by End-User Industry (2025-2032) 8.6.2. GCC 8.6.2.1. GCC Wet Chemicals Market Size and Forecast, by Form (2025-2032) 8.6.2.2. GCC Wet Chemicals Market Size and Forecast, by Grade (2025-2032) 8.6.2.3. GCC Wet Chemicals Market Size and Forecast, by Product (2025-2032) 8.6.2.4. GCC Wet Chemicals Market Size and Forecast, by Application (2025-2032) 8.6.2.5. GCC Wet Chemicals Market Size and Forecast, by End-User Industry (2025-2032) 8.6.3. Nigeria 8.6.3.1. Nigeria Wet Chemicals Market Size and Forecast, by Form (2025-2032) 8.6.3.2. Nigeria Wet Chemicals Market Size and Forecast, by Grade (2025-2032) 8.6.3.3. Nigeria Wet Chemicals Market Size and Forecast, by Product (2025-2032) 8.6.3.4. Nigeria Wet Chemicals Market Size and Forecast, by Application (2025-2032) 8.6.3.5. Nigeria Wet Chemicals Market Size and Forecast, by End-User Industry (2025-2032) 8.6.4. Rest of ME&A 8.6.4.1. Rest of ME&A Wet Chemicals Market Size and Forecast, by Form (2025-2032) 8.6.4.2. Rest of ME&A Wet Chemicals Market Size and Forecast, by Grade (2025-2032) 8.6.4.3. Rest of ME&A Wet Chemicals Market Size and Forecast, by Product (2025-2032) 8.6.4.4. Rest of ME&A Wet Chemicals Market Size and Forecast, by Application (2025-2032) 8.6.4.5. Rest of ME&A Wet Chemicals Market Size and Forecast, by End-User Industry (2025-2032) 9. South America Wet Chemicals Market Size and Forecast by Segmentation (in USD Billion) 2025-2032 9.1. South America Wet Chemicals Market Size and Forecast, by Form (2025-2032) 9.2. South America Wet Chemicals Market Size and Forecast, by Grade (2025-2032) 9.3. South America Wet Chemicals Market Size and Forecast, by Product (2025-2032) 9.4. South America Wet Chemicals Market Size and Forecast, by Application (2025-2032) 9.5. South America Wet Chemicals Market Size and Forecast, by End-User Industry (2025-2032) 9.6. South America Wet Chemicals Market Size and Forecast, by Country (2025-2032) 9.6.1. Brazil 9.6.1.1. Brazil Wet Chemicals Market Size and Forecast, by Form (2025-2032) 9.6.1.2. Brazil Wet Chemicals Market Size and Forecast, by Grade (2025-2032) 9.6.1.3. Brazil Wet Chemicals Market Size and Forecast, by Product (2025-2032) 9.6.1.4. Brazil Wet Chemicals Market Size and Forecast, by Application (2025-2032) 9.6.1.5. Brazil Wet Chemicals Market Size and Forecast, by End-User Industry (2025-2032) 9.6.2. Argentina 9.6.2.1. Argentina Wet Chemicals Market Size and Forecast, by Form (2025-2032) 9.6.2.2. Argentina Wet Chemicals Market Size and Forecast, by Grade (2025-2032) 9.6.2.3. Argentina Wet Chemicals Market Size and Forecast, by Product (2025-2032) 9.6.2.4. Argentina Wet Chemicals Market Size and Forecast, by Application (2025-2032) 9.6.2.5. Argentina Wet Chemicals Market Size and Forecast, by End-User Industry (2025-2032) 9.6.3. Rest Of South America 9.6.3.1. Rest Of South America Wet Chemicals Market Size and Forecast, by Form (2025-2032) 9.6.3.2. Rest Of South America Wet Chemicals Market Size and Forecast, by Grade (2025-2032) 9.6.3.3. Rest Of South America Wet Chemicals Market Size and Forecast, by Product (2025-2032) 9.6.3.4. Rest Of South America Wet Chemicals Market Size and Forecast, by Application (2025-2032) 9.6.3.5. Rest Of South America Wet Chemicals Market Size and Forecast, by End-User Industry (2025-2032) 10. Company Profile: Key Players 10.1. 1. BASF SE 10.1.1. Company Overview 10.1.2. Business Portfolio 10.1.3. Financial Overview 10.1.4. SWOT Analysis 10.1.5. Strategic Analysis 10.1.6. Scale of Operation (small, medium, and large) 10.1.7. Details on Partnership 10.1.8. Regulatory Accreditations and Certifications Received by Them 10.1.9. Awards Received by the Firm 10.1.10. Recent Developments 10.2. 2. Chang Chun Group 10.3. 3. Dow 10.4. 4. Eastman Chemical Company 10.5. 5. Evonik Industries 10.6. 6. Formosa Daikin Advanced Chemicals Co. Ltd. 10.7. 7. Honeywell International Inc. 10.8. 8. Hubei Xingfa Chemicals Group Co. Ltd. 10.9. 9. KANTO KAGAKU 10.10. 10. Mitsubishi Electric Corporation 10.11. 11. Rin Kagaku Kogyo Co. Ltd. 10.12. 12. Santoku Chemical Industries Co. Ltd. 10.13. 13. Solvay Inc. 10.14. 14. Yingpeng Chemical Co. Ltd. 10.15. 15. Zhejiang Kaisn Fluorochemical Co. Ltd. 10.16. 16. Avantor Inc. 10.17. 17. CMC Materials 10.18. 18. FUJIFILM Corporation 10.19. 19. KMG Chemicals 10.20. 20. Linde PLC 10.21. 21. Songwon 10.22. 22. Technic Inc. 10.23. 23. T.N.C. Industrial Co. Ltd 11. Key Findings 12. Industry Recommendations 13. Wet Chemicals Market: Research Methodology 14. Terms and Glossary

Custom Market Research Services

We Will Customise The Research For You, In Case The Report Listed Above Does Not Meet With Your Requirements