
Waterway Mobility Market: by Type, by Vessel Type, by Transport Services, by Application - Forecast to 2032
Overview
The Global Waterway Mobility Market size was valued at USD 600.28 Billion in 2025 and is expected to grow at a CAGR of 5.8% from 2026 to 2032, reaching nearly USD 890.75 Billion.
Waterway technology is set to bring a transformative wave of change to the water mobility market. This is an era of efficient and sustainable transportation. With the mission to improve mobility and multimodality of inland waterways, this technology aligns perfectly with the objectives of Priority Area (PA) 'Waterways Mobility' in the Region. Waterway technology optimizes navigability conditions and shore-side infrastructure harmonized and environmentally sustainable. By leveraging advanced engineering and design practices, waterways are efficiently managed and improved. This ensures smoother and safer passage for vessels while minimizing environmental impacts. The modal share of inland waterway transport in the region, waterway technology supports transnational initiatives that promote and enhance waterway transport and business development. This technology facilitates the seamless movement of goods and people, reducing transportation costs, and enhancing overall economic growth.
The most significant contribution of waterway technology is its potential to make the Danube fleet more eco-friendly By adopting innovative propulsion systems and materials, emissions of greenhouse gases and air and water pollutants can be drastically reduced, leading to a greener and more sustainable water transportation system.
Harmonized River Information Services (RIS) are crucial for waterways efficiency. Waterway technology enables advanced RIS on the Danube and its navigable tributaries. This ensures compliance with European legal provisions and facilitates seamless international data exchange. Waterway technology aims to streamline these processes, making them more time-efficient, service-oriented, and transparent. Despite waterway transport's clear advantages, it currently accounts for less than 5% of the modal share in France. This is due to road and rail transport dominating the market.
Waterway technology presents a compelling solution to increase water transport's attractiveness. With its significantly lower CO2 emissions and smaller environmental footprint, it aligns perfectly with the growing emphasis on sustainable and green transportation solutions. Waterway technology shapes the future of water mobility, introducing innovations like personal submarines as well as floating gyms. Leveraging the vast water expanses on our planet, this technology promises efficient and gliding travel. Waterway technology bolsters waterway transport capacity and competitiveness. By capitalizing on the advantages of large single shipment volumes, low transportation costs per unit of mileage, and long average transport distances, waterway transport will play a pivotal role in the global trade and commerce landscape.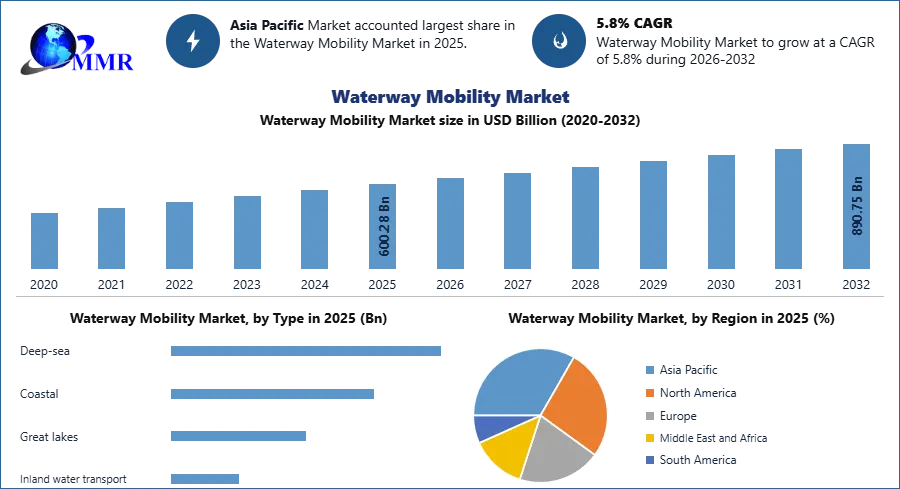 To know about the Research Methodology :- Request Free Sample Report
Waterway Mobility Market Scope and Research Methodology:
The scope of this research is to explore the impact of waterway technology on the water mobility market. This is done with a focus on the global market. The research aims to understand the potential of waterway technology for improving navigability, shore-side infrastructure, and sustainability in inland waterway transport. It will investigate how waterway technology supports transnational initiatives, raises waterway transport modal share, and develops a more eco-friendly Danube fleet. The study assesses the implementation of harmonized River Information Services (RIS) and their role in enhancing administrative procedures and personnel qualifications in Danube navigation.
The research will examine how waterway technology can increase water transport's competitiveness in comparison to road and rail transport. It will also analyze factors that hinder its current market share in the region. This research adopts a mixed-methods approach. The study begins with a comprehensive literature review to gather relevant information on waterway technology, its Transport services, benefits, and challenges in the water mobility market. Quantitative data are collected through surveys and statistical analysis to assess the current modal share of water transport and the potential impact of waterway technology. Qualitative data is gathered through interviews and expert opinions. This will enable us to gain insights into key stakeholders' perceptions and expectations regarding waterway technology. The research employs case studies of successful waterway technology implementation in other regions to draw lessons and best practices. The findings will be analyzed and synthesized to provide a holistic view of the scope and implications of waterway technology in transforming the water mobility market in the Danube Region.
Waterway Mobility Market Dynamics:
Electric-Powered Boats Are the Greenest Solution for Water Mobility:
The increasing focus on environmental sustainability and the need to reduce greenhouse gas emissions is a significant driver for the water mobility market. Electric-powered boats and barges offer a cleaner and greener alternative to traditional combustion-powered vessels, appealing to environmentally conscious consumers and businesses. The adoption of electric-powered boats, like the "Black Swan" in Paris and electric barges by PortLiner, showcases how the circular economy of batteries from electric vehicles can be utilized to create eco-friendly water transportation options. In densely populated urban areas with extensive waterways like Amsterdam, water mobility reduces street congestion. Autonomous boats are used for various purposes, such as transportation, waste collection, and water quality measurement. This frees up road space and enhances urban mobility. The "Roboat" project in Amsterdam demonstrates how autonomous boats serve as multi-functional solutions to alleviate congestion and create temporary structures, like floating bridges, to accommodate pedestrian needs.
Infrastructure Challenges in the Water Mobility Market hinder the adoption of Electric-Powered Vessels:
The water mobility market faces challenges related to inland waterway infrastructure availability and development. Inadequate facilities and outdated ports hinder electric-powered vessel adoption and autonomous boats. Inland waterway and sea transport projects encounter challenges in areas where the existing infrastructure does not support water mobility solutions efficiently and seamlessly. Transitioning from conventional vessels to electric-powered or autonomous boats may require significant upfront investments. The cost of developing and implementing cutting-edge technologies can be a restraint for some stakeholders.
Companies considering electric barges face initial investment challenges in acquiring the necessary electric machinery and storage systems for batteries. Electric boats and barges use batteries that pose challenges. Ensuring sufficient battery capacity for long-distance cruising and optimizing charging infrastructure are crucial considerations. Electric boats need to balance speed and range limitations with passenger or cargo schedules. Autonomous boats raise regulatory and safety concerns. Ensuring unmanned vessels' safe operation in busy waterways requires robust regulatory frameworks and advanced sensor technologies. The development and implementation of autonomous boats on Amsterdam's busy canals will necessitate careful planning and adherence to stringent safety standards.
| Vessels / Terminals | Construction, Operation & Maintenance | Government Agencies | Public and Private Sector Enterprises |
| Waterway | Constructing of waterway | IWAI | CIWTC in Sundarbans |
| Waterway | Maintenance of Waterway | IWAI | Subcontracted Dredging |
| Waterway | Navigational Support | IWAI | Ports, near port areas GPS suppliers (KPT, Port of Panaji) |
| Carriers (Vessels) | Vessel Manufacturing | - | CIWTC, Hooghly Docks, Garden Reach Shipbuilders & Engineers (GRSE) |
| Carriers (Vessels) | Vessel ownership | IWAI | CIWTC/KSINCL and others |
| Carriers (Vessels) | Vessel maintenance/repair | - | CIWTC/KSINCL and others |
| Carriers (Vessels) | Vessel Operation | - | CIWTC/KSINCL and others |
| Terminals (Jetties) | Terminal construction | IWAI and State Government | Mormugao Port Trust, CIWTC |
| Terminals (Jetties) | Terminal operation | - | Mormugao Port Trust |
Eco-Friendly Cruise Boats and Sustainable Tourism are Water Mobility's Promise:
Water mobility presents opportunities for growth and diversification as demand for sustainable transportation solutions rises. Electric-powered boats and autonomous vessels cater to various needs, from leisure cruises to cargo transport. Electric-powered boats offer a means to establish eco-friendly cruise boats and other leisure services, promoting sustainable tourism. Continued advancements in battery technology, charging infrastructure, and autonomous systems offer opportunities for more efficient and advanced water mobility solutions. Technological breakthroughs have improved battery capacity, longer cruising ranges, and faster charging times. The use of electric boats and barges is more feasible. The emergence of waterway technology presents an unprecedented opportunity to transform the water mobility market, driving toward sustainability, efficiency, and innovation. With a growing focus on environmental preservation and the need to reduce greenhouse gas emissions, electric-powered boats and barges offer a cleaner and greener alternative to conventional vessels. Waterway technology leverages circular economy principles by repurposing used batteries from electric cars, reducing waste, and creating eco-friendly transportation options.
Waterway Mobility Market Segmentation Insights:
Based on the Transport Services, In the Waterway mobility market, electrically powered ferry dominate the market in 2023 and are expected to grow during the forecast period. The electrically powered ferry segment is gaining popularity as cities seek to reduce emissions and provide sustainable transportation options. These ferries are equipped with electric propulsion systems, powered by batteries and charged using renewable electricity from sources like wind and water power. They offer efficient and eco-friendly river crossings, an alternative to traditional fossil fuel-powered ferries. The segment appeals to environmentally conscious commuters and tourists, contributing to reduced carbon dioxide, nitric oxide, and particle emissions. However, the limited battery range poses a challenge, and operators need to plan routes and charging infrastructure carefully. Sea Bubbles represent an innovative concept in urban water mobility services. These electrically powered boats offer on-water sharing services, similar to car and bike sharing, providing a sustainable and efficient mode of transport in cities with waterways. Boats can travel considerable distances without creating significant waves, which helps preserve water bodies' ecological balance. Sea Bubbles boats cater to short-distance trips, making them ideal for intra-city travel. They attract environmentally conscious commuters seeking convenient and eco-friendly transport options.
The Roboat segment focuses on autonomous and flexible waterborne freight and passenger transport systems. Amsterdam, with its extensive canal network, serves as a suitable test bed for developing and implementing Roboat solutions. The system's adaptability to peak hours and temporary activities, such as festivals or bridge solutions, makes it highly versatile. Roboats serve multiple functions, acting as gathering spaces, pop-up stages, or even concert venues, showcasing their multifunctional potential. However, Roboats depend on advanced autonomous navigation systems and robust safety protocols. Water scooters, also known as personal watercraft, are popular for recreational purposes, providing individuals with thrilling experiences on the water. They are powered by internal combustion engines or electric motors, with a growing trend towards electric versions to reduce noise and emissions. Water scooters cater to thrill-seekers and tourists interested in exploring waterways and coastal areas.
Waterway Mobility Market Regional Insights:
Europe has been at the forefront of waterway transport and sustainable mobility solutions. The region boasts a vast network of rivers and canals, making it ideal for transportation. Countries like France and Germany have been pioneers in developing efficient waterway infrastructure and implementing eco-friendly initiatives. Paris, France, is a notable example of water mobility integration into urban transportation. The city has already introduced electric-powered boats and hydrofoils like SeaBubbles for taxi services on the River Seine. Innovative projects like the electric warehouse/boat, Fludis, have been launched to revolutionize urban delivery services and reduce road traffic. The Black Swan, the first 100% electric boat powered by repurposed batteries from Renault vehicles, is another shining example of Europe's commitment to circular economy principles. Such initiatives are expected to drive the water mobility market growth further.
North America has also shown increasing interest in water mobility solutions, particularly in cities with significant water bodies and navigable rivers. Electric-powered water taxis and shuttles have gained momentum, providing eco-friendly transportation alternatives. The region is also witnessing innovative projects like Europe. These projects include companies developing battery-powered boats for various purposes, including urban commuting and leisure cruises. Asia's water mobility market is expanding rapidly, driven by increasing urbanization and sustainable transportation options. Countries like China, India, and Singapore are investing in modernizing their waterway infrastructure and introducing electric-powered boats and autonomous vessels. Singapore has been exploring the potential of autonomous boats for various purposes, such as cargo transport and waste collection. This is to optimize urban mobility and resource management. China, with its extensive river network and growing urban population, is also exploring electric-powered boats for passenger transport and freight movement.
Waterway Mobility Market Competitive Landscape
Renault Group is a key player in the water mobility market, leading the way in the development of electric-powered boats powered by recycled batteries. Their collaboration with Seine Alliance and Green Vision has resulted in the innovative "Black Swan," a 100% electric boat offering silent, odourless, and vibration-free cruises in Paris. Renault's expertise in sustainable electric mobility positions them as a prominent player in waterway transport's future.
Key Players of the Waterway mobility market profiled in the report include A.P. Møller-Mærsk A/S, American Commercial Barge Line, American River Transportation, Cargill Incorporated, European Cruise, Evergreen Marine Corp, Hapag-Lloyd AG, Hyundai Merchant, Imperial Logistics International, Ingram Barge, McKeil Marine Limited, Nippon Yusen, Rhenus Group, Renault Group. This provides huge opportunities to serve many End-uses & customers and expand the Waterway technology to change the water mobility market.
Recent Industry Developments
| Exact Date | Company | Development | Impact |
|---|---|---|---|
| 02 February 2026 | A.P. Møller-Mærsk A/S | The company successfully established a new India-Bangladesh inland waterway link for containerized cargo via the Indo-Bangladesh Protocol Route. | This development provides a quicker and more reliable alternative to ocean freight, significantly reducing bottlenecks at land borders. |
| 23 January 2026 | Kochi Water Metro Limited | The authority announced a massive fleet expansion strategy to reach 78 electric-hybrid boats to connect 10 surrounding islands. | The expansion solidifies the system's position as Asia’s first integrated ferry transit system of this scale, driving sustainable urban mobility. |
| 12 October 2025 | Kochi Water Metro Limited | A new waterway route connecting the High Court terminal to Mattancherry was officially inaugurated, featuring modern floating pontoons. | This route enhances last-mile connectivity and eases road congestion in heavy tourism corridors. |
| 07 April 2025 | Kochi Water Metro Limited | The Eloor to High Court direct water taxi service was commercially launched to improve city-center access for peripheral communities. | It demonstrates the scalability of electric-powered river crossings as a viable alternative to traditional fossil fuel ferries. |
| 21 January 2025 | Reliance Industries | Reliance signed an MoU with Vadhvan Port Project Limited to develop a liquid jetty and 50-acre facility under a PPP model. | This investment will increase cargo handling capacity and efficiency in one of India's major maritime hubs. |
Waterway Mobility Market Scope: Inquire before buying
| Waterway Mobility Market | |||
|---|---|---|---|
| Report Coverage | Details | ||
| Base Year: | 2025 | Forecast Period: | 2026-2032 |
| Historical Data: | 2020 to 2025 | Market Size in 2025: | 600.28 USD Billion |
| Forecast Period 2026-2032 CAGR: | 5.8% | Market Size in 2032: | 890.75 USD Billion |
| Segments Covered: | by Type | Deep-sea Coastal Great lakes Inland water transport |
|
| by Vessel Type | Cargo Ships Container Ships Tankers Other Vessel Types |
||
| by Transport Services | Electrically powered ferry Sea Bubbles boat Roboat Water Scooter water Taxi Water Bus |
||
| by Application | Onshore Offshore |
||
Waterway Mobility Market, by Region:
North America (United States, Canada, and Mexico)
Europe (UK, France, Germany, Italy, Spain, Sweden, Austria, and the Rest of Europe)
Asia Pacific (China, South Korea, Japan, India, Australia, Indonesia, Malaysia, Vietnam, Taiwan, Bangladesh, Pakistan, and the Rest of APAC)
Middle East and Africa (South Africa, GCC, Egypt, Nigeria, and the Rest of ME&A)
South America (Brazil, Argentina, and the Rest of South America)
Key Players / Competitors Profiles Covered in Brief in Global Waterway Mobility Market Report in Strategic Perspective:
- A.P. Møller-Mærsk A/S
- American Commercial Barge Line
- American River Transportation
- Cargill Incorporated
- China Ocean Shipping Company Limited
- CMA CGM Group
- European Cruise
- Evergreen Marine Corp
- Damen Shipyards Group
- Cochin Shipyard Limited
- Adani Ports and Special Economic Zone Limited
- Shipping Corporation of India
- Viking River Cruises
- Incat Crowther
- Austal
- Azimut Benetti S.p.A.
- AmaWaterways
- Artemis Technologies
- Candela
- Holland Shipyards Group
- Kongsberg Maritime
- SeaBubbles
- Navalt
- Mavi Deniz
- Scenic Luxury Cruises & Tours