
Virtual Power Plant Market- Industry Structure Evaluation, Demand Drivers Analysis, Regional Growth Analysis and Identification, Competitive Positioning Review & Global Market Size Forecast to 2032
Overview
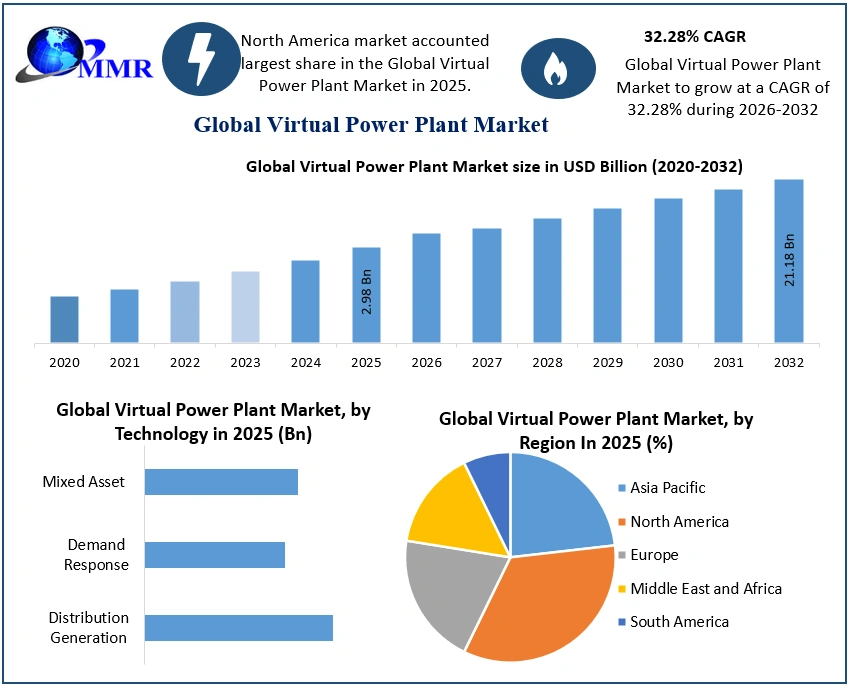
The Virtual Power Plant Market size was valued at USD 2.98 Billion in 2025 and the total Virtual Power Plant revenue is expected to grow at a CAGR of 32.28% from 2026 to 2032, reaching nearly USD 21.18 Billion by 2032.
A virtual power plant (VPP) bundles many small and often disparate energy resources (such as rooftop solar and batteries) and bundles them together to behave, under the right conditions, like a regular power plant able to deliver power into the grid only without a physical location to plug into. The global Virtual Power Plant (VPP) market is driven by frontiers of renewable energy integration, innovative technology and the global transition to decentralized energy systems. The global VPP market has estimates of around USD 2.26 billion in 2024, and the market is expected to grow to USD 21.20 billion in 2032, showing a very high compound annual growth (CAGR). Impacts of North America Virtual Power Plant (VPP) Market. The Virtual Power Plant (VPP) industry is poised for ongoing and rapid development as a critical enabler of decentralized energy management and grid modernization across the region. A VPP groups together several distributed energy resources (DERs), including solar panels, wind turbines, battery storage systems, and demand response assets, to act like a virtual power plant. Optimizing the energy produced, stored, and distributed, with help of advanced digital technologies, artificial intelligence (AI), and innovative real-time data analysis can increase grid stability and efficiency, as well as the sustainability.
Enhanced with AI and ML algorithms, VPPs harness the best of innovation for energy management. Intelligent load forecasting, predictive maintanence and the real-time optimization of DERs, for example, are all achieved through use of these technologies, which act to increase the reliability and efficiency of the grid. Blockchain technology is helping in the development of transparent peer-to-peer energy trading in VPP networks. It invites consumers and prosumers to directly engage in the energy markets, creating a more reliable and democratized energy ecosystem.
Rule changes recently passed by the energy market regulator in Australia opened the door for VPPs to compete in the national electricity market as direct players. They shot baskets as part of the A$3 billion reform, which is expected to see returns rise for homes with rooftop solar and batteries while improving grid stability and lowering costs around new generating capacity. The country could be entering an energy storage boom, with new government policies in which all new homes must include solar panels and virtual power plants (VPPs) — regions where power production, including from solar, is pooled for sharing — being pursued. Allowing for the sale of excess energy and aiding in grid reliability, these VPPs will connect home batteries to a cloud.
VPPs represent the convergence of technology and regulation, and their transformative power will likely be central to the global transition to decentralized and sustainable energy torches.
To know about the Research Methodology:-Request Free Sample Report
A virtual power plant is made up of several mixed assets that are linked by a central control system that processes a wide variety of information, such as current power exchange rates, price and weather forecast, and grid information from system operators. Virtual power plants are a group of smaller generators that work together to form one enormous power plant. Biogas plants, heat and power units, and backup generators are all components of a virtual power plant. Any virtual power plant's generators must communicate with a remote control program that manages the whole network.
Report Scope:
The report investigates the market's drivers, limitations, opportunities, and barriers. This MMR report includes investment suggestions based on a detailed study of the current competitive market in the Virtual Power Plant market. The data gives a comprehensive study of the present rapid improvements in all business areas. Key data analysis for the historical period from 2020 to 2025 is provided using facts and figures, pictures, and presentations.
The reports include significant breakthroughs in the Virtual Power Plant Market's organic and inorganic growth strategies. Various firms are focusing on organic growth strategies such as new product releases, product approvals, and other items such as patents and events. Inorganic growth techniques noted in the sector included acquisitions, partnerships, and collaborations. These efforts have paved the way for market players' companies and customer bases to grow.
The Data on recent developments, trade regulations, import-export analysis, production analysis, value chain optimization, market share, the influence of domestic and major & localized market players, changes in market regulations, and strategic market growth analysis are also included in the study. To analyze secondary and primary data, the Bottom-Up Approach is used. Secondary data is gathered from nationalized and global data sources, annual and financial reports of significant market participants, news announcements, and so on. The primary data was gathered through interviews, surveys, expert and trained professional comments, etc.
Virtual Power Plant Market Dynamics:
Increasing Adoption of Distributed Generation drives market growth.
The current global energy distribution networks are decentralized. Wind turbines, solar cells, geothermal systems, and micro hydropower plants are used to create and distribute energy on a small scale. Distributed generating systems, especially when integrated with heat and power and emergency generators, can provide electricity during power outages and periods of high energy demand. The increased emphasis on decarbonization, electrification, digitalization, and breakthroughs in power generating and storage technology are the major reasons hastening the transition to distributed generation. Because of the cost-effectiveness of renewable technologies, distributed generating is growing. Additionally, local and state government policies and laws to support the larger deployment of renewable technologies due to their benefits, such as cheaper CAPEX and energy security, are accelerating this market's growth. As a result, aggressive clean energy aims to raise the amount of renewable energy in the energy mix are driving demand for distributed generating systems, increasing the uses of virtual power plants.
Poor infrastructure and high costs of Virtual Power Plant restraining the market growth.
The good quality infrastructure necessary for the construction of VPP must include modern communication technologies, such as an energy management system (EMS), which allows for the monitoring, management, and control of various energy devices. These technologies also enable the transfer of data for the VPP to make choices on various energy assets. VPP systems require artificial intelligence-enabled technologies, as well as machine learning and big data capabilities, to manage, monitor, and gather data from a variety of meters, as well as to assure the reliability and quality of data for VPP platforms. Integrating modern tools and processes in a VPP involves substantial expenses and a highly qualified team. As a result, insufficient infrastructure and the high costs associated with new technologies are expected to restrain market growth throughout the forecast period.
The rising demand for electric vehicles is a key opportunity for market growth.
The demand for electric vehicles is increasing due to the wide applications of electrical vehicles across the globe. Government interventions are still an essential factor in encouraging EV sales. The electricity system is transitioning from a big and centralized to a varied and localized structure. Virtual Power Plants (VPPs) serve a crucial role in keeping the power system balanced. VPPs mix energy from decentralized sources to create and consume power on demand. Fleets of electric vehicles (EVs) have the potential to be an element of VPPs. EV batteries can be used to counteract the stochastic nature of renewable energy sources like wind and solar. These characteristics provide lucrative opportunities for market growth.
Provisioning stability to the Virtual Power Plants is a major challenge for the market.
The transition from fossil fuel to renewable energy offers several environmental benefits that are anticipated in the long run and are indicated by legislation such as those issued by the EU or seven US states. However, the detrimental influence on grid stability and electricity quality has already been observed in several nations. With the development of many alternative energy sources, particularly renewable ones, the grid is gradually becoming an active distribution network. In this situation, provisioning of the stability provided by ancillary services becomes increasingly important, and providers of ancillary services, specifically virtual power plants (VPPs), would then face a difficult situation, as they would like to benefit from the shift to renewable energy while maintaining their ability to deliver the service reliably and cost-effectively.
Virtual Power Plant Market Segment Analysis:
By Technology, the Demand Response segment held the largest market share of about xx% in 2025 and is expected to dominate the Virtual Power Plant market at the end of the forecast period. This is due to grid modernization and the burgeoning virtual power plant business, which would result in the increased need for demand response. Demand is also rising due to the long-term benefits it provides to end consumers. It has the potential to increase the grid's energy efficiency. It also offers advantages like peak load control and the opportunity to earn incentives by participating in demand response programs.
The Distributed Generation segment is expected to grow rapidly during the forecast period. Because of the growing energy and environmental crises, the development of new renewable energy technologies is critical. Improved integration of remote power generating resources with Virtual Power Plants can significantly improve grid operations.
During the forecast period, the mixed assets technology-based virtual power plants segment is expected to grow significantly due to rising consumer and enterprise demand and bidirectional electricity flow in the supply chain to fulfill demand.
By End-Users, the Residential segment had the largest revenue share of the total Virtual Power Plant market in 2025 and is expected to grow rapidly during the forecast period. This is due to the wide applications of smart meters, Smart home appliances, and interoperability with home energy management systems. The increasing use of small and medium-sized VPP in industrial applications would drive market growth. VPP is excellent for industrial applications because of its high dependability and energy economy during peak load periods. These factors drive the segment growth throughout the forecast period. Participating in demand response programs, energy storage systems, and distributed generation benefits the global residential housing business. It helps with energy delivery at peak hours, and end users may store extra energy in energy storage equipment such as solar panels and batteries, among other things. Government requirements and initiatives for consumer participation and reward schemes may aid in the growth of the residential end-user virtual power plant sector.

The commercial segment is expected to grow significantly during the forecast period. This is due to the massive installation of Virtual Power Plant Systems in business complexes, hospitals, universities, retail malls, and other end-use applications.
Virtual Power Plant Market Regional Insights:
North America is expected to hold the largest market share and dominate the market at the end of the forecast period due to many projects that have been approved in the United States and Canada to deploy Virtual Power Plants. For example, SimpliPhi Power launched a VPP demonstration project in Louisiana in May 2020. The growth of the virtual power plant market would be driven by technical advancements, legislation aimed at lowering greenhouse gas emissions, and the increasing use of grid balancing solutions for professional, domestic, and industrial consumers. The growth of virtual power plant market in the United States and Canada is expected to grow significantly. The broad adoption of virtual energy units for optimal energy distribution drives industrial growth in the United States. In the country, electricity is created utilizing a variety of energy sources, including renewables, fossil fuels, and nuclear energy.
The European market is expected to hold the second position in the Virtual Power Plant Market at the end of the forecast period. This is due to the existence of multiple major market competitors as well as an increase in the number of government initiatives in countries such as the United Kingdom and Germany. In addition, Europe is investing heavily in renewable energy and energy storage systems, which is driving the demand for VPPs.
The Asia-Pacific market is expected to grow significantly during the forecast period. Renewable energy's massive potential, along with rapidly increasing residential and commercial sectors, is expected to contribute to regional market growth. Energy consumption is exorbitant in developing economies such as China and India. Smart metering, demand response, energy storage investments, and retail competition promotion are all anticipated to thrive in the Asia Pacific region's energy market. The increased need for decentralized power generation is also anticipated to drive regional market growth.
The objective of the report is to present a comprehensive analysis of the Virtual Power Plant market to the stakeholders in the industry. The past and current status of the industry with the forecasted market size and trends are presented in the report with the analysis of complicated data in simple language. The report covers all the aspects of the industry with a dedicated study of key players that include market leaders, followers, and new entrants.
PORTER, PESTEL analysis with the potential impact of micro-economic factors of the market have been presented in the report. External as well as internal factors that are supposed to affect the business positively or negatively have been analyzed, which will give a clear futuristic view of the industry to the decision-makers.
The report also helps in understanding the Virtual Power Plant market dynamics, and structure by analyzing the market segments and projecting the Virtual Power Plant market size. Clear representation of competitive analysis of key players by product, price, financial position, product portfolio, growth strategies, and regional presence in the Virtual Power Plant market make the report investor’s guide.
Virtual Power Plant Market Scope: Inquire before buying
| Virtual Power Plant Market | |||
|---|---|---|---|
| Report Coverage | Details | ||
| Base Year: | 2025 | Forecast Period: | 2026-2032 |
| Historical Data: | 2020 to 2025 | Market Size in 2025: | USD 2.98 Bn. |
| Forecast Period 2026 to 2032 CAGR: | 32.28 % | Market Size in 2032: | USD 21.18 Bn. |
| Segments Covered: | by Technology | Distribution Generation Demand Response Mixed Asset |
|
| by End User | Industrial Commercial Residential |
||
Virtual Power Plant Market, by Region
North America (United States, Canada and Mexico)
Europe (UK, France, Germany, Italy, Spain, Sweden, Austria and Rest of Europe)
Asia Pacific (China, South Korea, Japan, India, Australia, Indonesia, Malaysia, Vietnam, Taiwan, Bangladesh, Pakistan and Rest of APAC)
Middle East and Africa (South Africa, GCC, Egypt, Nigeria and Rest of ME&A)
South America (Brazil, Argentina Rest of South America)
Virtual Power Plant Market, Key Players are
1. Cisco (U.S.)
2. Wind River (U.S.)
3. Mavenir (U.S.)
4. Ericsson (U.S.)
5. Limejump (U.K.)
6. ABB Ltd (Switzerland)
7. Radisys (U.S.)
8. Siemens AG (Germany)
9. Huawei (China)
10. Flexitricity (U.K.)
11. ECI Telecom (Israel)
12. Comverge (U.S.)
13. VMware(U.S.)
14. Ciena (U.S.)
15. Metaswitch (U.K.)
16. Nokia (Finland)
17. Fujitsu (Japan)
18. General Electric (U.S.)
19. AGL Energy (Australia)
20. Schneider Electric (France)
21. Enel X (U.S.)
22. Bosch (Germany)
23. IBM (U.S.)
24. Hitachi, Ltd. (Japan)
25. Mitsubishi Heavy Industries (Japan)
26. Next Kraftwerke (Germany)
27. AutoGrid Systems, Inc. (U.S.)
28. Blue Pillar, Inc. (U.S.)
29. Enbala Power Networks, Inc. (U.S.)
30. TOSHIBA CORPORATION
31. Tesla, Inc.
32. Sunverge Energy, Inc.
33. Centrica plc
FAQs:
1. Which is the potential market for the Virtual Power Plant in terms of the region?
Ans. The North America is the potential market for Virtual Power Plant in terms of the region.
2. What are the opportunities for the market?
Ans. The rising demand for electric vehicles is a key opportunity for market growth.
3. What is expected to drive the growth of the Virtual Power Plant market in the forecast period?
Ans. Increasing Adoption of Distributed Generation drives market growth.
4. What is the projected market size & growth rate of the Virtual Power Plant Market?
Ans. The Virtual Power Plant Market size was valued at USD 2.98 Billion in 2025 and the total Virtual Power Plant revenue is expected to grow at a CAGR of 32.28% from 2026 to 2032, reaching nearly USD 21.18 Billion by 2032.
5. What segments are covered in the Virtual Power Plant Market report?
Ans. The segments covered are Technology, End-Users, and Region.