Vehicles for Disabled Market: Global Industry Analysis and Forecast (2023-2029)

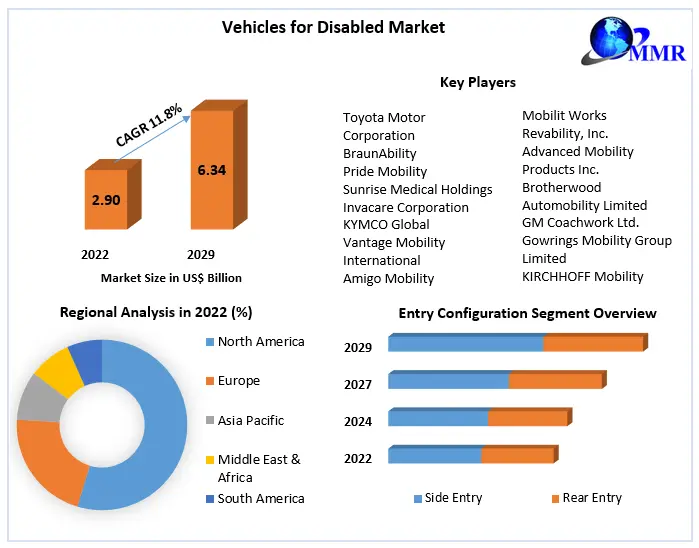
Global Vehicles for Disabled Market is anticipated to reach US$ 6.34 Bn. by 2029 from US$ 2.90 Bn. in 2022 at a CAGR of 11.8% during a forecast period.

Vehicles for Disabled Market Overview

Vehicles for the Disabled are essentially a vehicle equipped with a self-navigating wheelchair that is meant to carry a disabled person from one place to another. The Vehicles for the Disabled have a wider ramp and higher height than regular vehicles, making it easier for disabled people to enter and depart. Europe is the largest market for the vehicles for disabled, accounted for 58% of the market share in 2022. North America and the Asia Pacific held 25% and 17% of the market share respectively in 2022. Vehicles for Disabled Market
To know about the Research Methodology :- Request Free Sample Report In report, 2022 is considered a base year however 2022 numbers are on the real output of the companies in the market. Special attention is given to 2022 and the effect of lockdown on the demand and supply, and also the impact of lockdown for the next two years on the market. Some companies have done well in lockdown also and specific strategic analysis of those companies is done in the report.

Vehicles for Disabled Market Dynamics

Some of the primary reasons driving the worldwide growth of the vehicle for disabled market are the growing elderly population and the rising vehicle modernization. The growth of the automobile for disabled people has made driving a more independent, comfortable, and safe experience for disabled and elderly individuals. In addition, as the number of traffic accidents grows, so does the number of people who are disabled. These factors are likely to boost demand for disabled vehicles during the forecast period. The world's population is aging, particularly in countries like United States, Europe, and Japan. The global elderly population is expected to increase from 760 million (11%) to 1 billion by 2029. As a result, the growing elderly population boosts the market's growth. In addition, governments in developing countries focusing more on providing equality to disabled people via enhanced healthcare facilities, mobility services, and accessibility. Thus, rising awareness of Entry Configurations among the patient population is likely to fuel the growth of the market. The majority of disabled vehicles, on the other hand, have been seen in developed countries like United States, Europe, and Japan. Furthermore, disabled vehicles give a user-friendly choice for persons with disabilities. This is expected to grow demand for disabled vehicles during the forecast period. Restraints: Disabled vehicles are quite expensive, which makes them difficult to implement in developing countries. This factor is expected to hamper the market's growth during the forecast period.

Market Segment Analysis

By Vehicle Type, the mobility scooter segment is expected to grow at CAGR of xx% during the forecast period. Mobility scooters are electric scooters that provide a low-cost means of traveling independently both indoors and outside. Mobility scooters are preferred by people with disabilities over electric wheelchairs because they are more efficient and require less physical effort. Many mobility scooter companies are investing in R&D to create a more creative product that is expected to appeal to disabled individuals. Various improvements have been made to make mobility scooters more efficient. Mobility scooters, for example, may travel at speeds of 4 to 8 miles per hour and have seats that can be adjusted to the user's height. Government efforts and programs, as well as an increase in the incidence of orthopedic illnesses and technical advancements, are expected to drive the segment for mobility scooters for the disabled. This statistic represents the expected global retail sales of electric scooters from 2022 through 2022. Projected global retail sales of electric scooters are expected to reach approximately 50 million units by 2022. The worldwide SUV/MPV segment is expected to grow at a 9.4 percent CAGR, with the United States, Canada, Japan, China, and Europe leading the way. These regional markets, which had a combined market value of US$ 385.2 million in 2022, are expected to grow at US$ 723.9 million by 2029. In these regional markets, China is expected to continue to be one of the fastest-growing regions. The Asia-Pacific market is expected to reach US$ 687.9 million by 2029, led by countries like India, and South Korea.

Market Regional Insights

The United States and Canada are expected to drive the demand for disabled vehicles in the North American region due to government policies and technology advancements. In the year 2022, the market for Vehicles for the Disabled in the United States was worth US$ 836.3 million. The demand for disabled vehicles in Europe is rising as people become more aware of mobility alternatives and as various orthopedic procedures become more common. Within Europe, Germany is expected to grow at a 7.9% CAGR during the forecast period. The Asia Pacific market is expected to grow at the highest rate during the forecast period as government provides mobility and infrastructure solutions. Japan's rising senior population and government efforts are driving the growth of advanced technologies for cars built for disabled persons. Toyota is the market leader in Japan for developing self-driving vehicles for individuals with impairments. Japan and Canada are two additional significant geographic markets, with expected growth rates of 9.7% and 9.2%, respectively, from 2023 to 2029. China is expected to reach an expected market size of US$ 1 billion by 2029, representing a 10.5 percent CAGR from 2023 to 2029. Leading market key players are working to demonstrate the opportunity to Vehicles for Disabled market. Major players are involved in adopting maintainable strategies to gain competitive edges such as new product launches, product up-gradation, and M&A, collaborative agreements. For example, Toyota Motor Corporation introduced a new vehicle type called the APM (accessible people mover) in July 2021. According to Toyota officials, the new vehicle can transport approximately six people at a speed of 19 kilometers per hour. It can travel approximately 100 kilometers on a single charge of the lithium-ion battery. The trucks are equipped with stretchers for emergency situations and are also built to provide comfort. Additionally, Toyota has also bagged the contracts for these vehicles for 2022 Beijing Winter Olympics and 2029 Paris Olympics. In February 2021, Vantage Mobility International (a US-based maker and distributor of wheelchair accessible cars) signed a deal to buy Revability. (Designer and manufacture of wheelchair accessible vehicles for commercial and personal use). BraunAbility (a US-based producer of wheelchair accessible vans and wheelchair lifts) extended its product range in January 2021 to include the BraunAbility Turny Evo seat, a new mobility transportation option. Nissan released the Versa Go for individuals with disabilities in Mexico in July 2021. The OEM manufacturer was the first in the region to provide a mobility alternative for individuals with disabilities with this product.

Vehicles for Disabled Market Scope: Inquire before buying

Vehicles for Disabled Market
Report Coverage Details
Base Year: 2022 Forecast Period: 2023-2029
Historical Data: 2018 to 2022 Market Size in 2022: US $ 2.90 Bn.
Forecast Period 2023 to 2029 CAGR: 11.8% Market Size in 2029: US $ 6.34 Bn.
Segments Covered: by Entry Configuration Side Entry Rear Entry
by Entry Mechanism Ramp Lifting Equipment
by Driving Option Driving on Swivel Seat Driving through Wheelchair Driving on Normal Seat
by Vehicle Type Passenger Car SUV/MPV Pick-up Truck Mobility Scooter

Vehicles for Disabled Market, by Region

Asia Pacific (China, South Korea, Japan, India, Australia, Indonesia, Malaysia, Vietnam, Taiwan, Bangladesh, Pakistan and Rest of APAC) Europe (UK, France, Germany, Italy, Spain, Sweden, Austria and Rest of Europe) North America (United States, Canada and Mexico) Middle East and Africa (South Africa, GCC, Egypt, Nigeria and Rest of ME&A) South America (Brazil, Argentina Rest of South America)

Vehicles for Disabled Market: Key Players

1. Toyota Motor Corporation 2. BraunAbility 3. Pride Mobility 4. Sunrise Medical Holdings 5. Invacare Corporation 6. KYMCO Global 7. Vantage Mobility International 8. Amigo Mobility International, Inc. 9. Mobilit Works 10. Revability, Inc. 11. Advanced Mobility Products Inc. 12. Brotherwood Automobility Limited 13. GM Coachwork Ltd. 14. Gowrings Mobility Group Limited 15. KIRCHHOFF Mobility GmbH & Co. KG 16. KWANG YANG MOTOR CO., LTD. (KYMCO) 17. Pride Mobility Products Corp. 18.TGA Mobility

Frequently Asked Questions

1. What is the projected market size & growth rate of Global Headlight Control Module Market? Ans- Headlight Control Module Market was valued at USD 2.90 Billion in 2022 and is projected to reach USD 6.34 Billion by 2029, growing at a CAGR of 11.8 % during the forecast period. 2. What are the key driving factors for the growth of Global Headlight Control Module Market? Ans- Some of the primary reasons driving the worldwide growth of the Vehicle for Disabled Market are the growing elderly population and the rising vehicle modernization. 3. Which Region accounted for the largest Global Headlight Control Module Market share? Ans- Europe is the largest market for the vehicles for disabled, accounted for 58% of the market share in 2022. 4. What makes Asia Pacific a Lucrative Market for Global Headlight Control Module Market? Ans- The Asia Pacific market is expected to grow at the highest rate during the forecast period as government provides mobility and infrastructure solutions. 5. What are the top players operating in Global Headlight Control Module Market? Ans- Toyota Motor Corporation, BraunAbility, Pride Mobility, Sunrise Medical Holdings, Invacare Corporation, KYMCO Global, Vantage Mobility International, Amigo Mobility International, Inc., and Mobilit Works.
1. Preface 1.1. Market Definition and Key Research Objectives 1.2. Research Highlights 2. Assumptions and Research Methodology 2.1. Report Assumptions 2.2. Abbreviations 2.3. Research Methodology 2.3.1. Secondary Research 2.3.1.1. Secondary data 2.3.1.2. Secondary Sources 2.3.2. Primary Research 2.3.2.1. Data from Primary Sources 2.3.2.2. Breakdown of Primary Sources 3. Executive Summary: Vehicles for Disabled Market Size, by Market Value (US$ Mn.) 3.1. Global Market Segmentation 3.2. Global Market Segmentation Share Analysis, 2022 3.2.1. Global 3.2.2. By Region (North America, Europe, Asia Pacific, South America, Middle East Africa) 3.3. Geographical Snapshot of the Vehicles for Disabled Market 3.4. Geographical Snapshot of the Vehicles for Disabled Market, By Manufacturer share 4. Vehicles for Disabled Market Overview, 2022-2029 4.1. Market Dynamics 4.1.1. Drivers 4.1.1.1. Global 4.1.1.2. By Region (North America, Europe, Asia Pacific, South America, Middle East Africa) 4.1.2. Restraints 4.1.2.1. Global 4.1.2.2. By Region (North America, Europe, Asia Pacific, South America, Middle East Africa) 4.1.3. Opportunities 4.1.3.1. Global 4.1.3.2. By Region (North America, Europe, Asia Pacific, South America, Middle East Africa) 4.1.4. Challenges 4.1.4.1. Global 4.1.4.2. By Region (North America, Europe, Asia Pacific, South America, Middle East Africa) 4.1.5. Industry Trends and Emerging Technologies 4.1.6. Porters Five Forces Analysis 4.1.6.1. Threat of New Entrants 4.1.6.2. Bargaining Power of Buyers/Consumers 4.1.6.3. Bargaining Power of Suppliers 4.1.6.4. Threat of Substitute Products 4.1.6.5. Intensity of Competitive Rivalry 4.1.7. Value Chain Analysis 4.1.8. Technological Roadmap 4.1.9. Regulatory landscape 4.1.10. Impact of the Covid-19 Pandemic on the Vehicles for Disabled Market 5. Supply Side and Demand Side Indicators 6. Vehicles for Disabled Market Analysis and Forecast, 2022-2029 6.1. Vehicles for Disabled Market Size & Y-o-Y Growth Analysis. 7. Vehicles for Disabled Market Analysis and Forecasts, 2022-2029 7.1. Market Size (Value) Estimates & Forecast By Entry Configuration, 2022-2029 7.1.1. Side Entry 7.1.2. Rear Entry 7.2. Market Size (Value) Estimates & Forecast By Entry Mechanism, 2022-2029 7.2.1. Ramp 7.2.2. Lifting Equipment 7.3. Market Size (Value) Estimates & Forecast By Driving Option, 2022-2029 7.3.1. Driving on Swivel Seat 7.3.2. Driving through Wheelchair 7.3.3. Driving on Normal Seat 7.4. Market Size (Value) Estimates & Forecast By Vehicle Type, 2022-2029 7.4.1. Passenger Car 7.4.2. SUV/MPV 7.4.3. Pick-up Truck 7.4.4. Mobility Scooter 8. Vehicles for Disabled Market Analysis and Forecasts, By Region 8.1. Market Size (Value) Estimates & Forecast By Region, 2022-2029 8.1.1. North America 8.1.2. Europe 8.1.3. Asia-Pacific 8.1.4. Middle East & Africa 8.1.5. South America 9. North America Vehicles for Disabled Market Analysis and Forecasts, 2022-2029 9.1. Market Size (Value) Estimates & Forecast By Entry Configuration, 2022-2029 9.1.1. Side Entry 9.1.2. Rear Entry 9.2. Market Size (Value) Estimates & Forecast By Entry Mechanism, 2022-2029 9.2.1. Ramp 9.2.2. Lifting Equipment 9.3. Market Size (Value) Estimates & Forecast By Driving Option, 2022-2029 9.3.1. Driving on Swivel Seat 9.3.2. Driving through Wheelchair 9.3.3. Driving on Normal Seat 9.4. Market Size (Value) Estimates & Forecast By Vehicle Type, 2022-2029 9.4.1. Passenger Car 9.4.2. SUV/MPV 9.4.3. Pick-up Truck 9.4.4. Mobility Scooter 10. North America Vehicles for Disabled Market Analysis and Forecasts, By Country 10.1. Market Size (Value) Estimates & Forecast By Country, 2022-2029 10.1.1. US 10.1.2. Canada 10.1.3. Mexico 11. U.S. Vehicles for Disabled Market Analysis and Forecasts, 2022-2029 11.1. Market Size (Value) Estimates & Forecast By Entry Configuration, 2022-2029 11.2. Market Size (Value) Estimates & Forecast By Entry Mechanism, 2022-2029 11.3. Market Size (Value) Estimates & Forecast By Driving Option, 2022-2029 11.4. Market Size (Value) Estimates & Forecast By Vehicle Type, 2022-2029 12. Canada Vehicles for Disabled Market Analysis and Forecasts, 2022-2029 12.1. Market Size (Value) Estimates & Forecast By Entry Configuration, 2022-2029 12.2. Market Size (Value) Estimates & Forecast By Entry Mechanism, 2022-2029 12.3. Market Size (Value) Estimates & Forecast By Driving Option, 2022-2029 12.4. Market Size (Value) Estimates & Forecast By Vehicle Type, 2022-2029 13. Mexico Vehicles for Disabled Market Analysis and Forecasts, 2022-2029 13.1. Market Size (Value) Estimates & Forecast By Entry Configuration, 2022-2029 13.2. Market Size (Value) Estimates & Forecast By Entry Mechanism, 2022-2029 13.3. Market Size (Value) Estimates & Forecast By Driving Option, 2022-2029 13.4. Market Size (Value) Estimates & Forecast By Vehicle Type, 2022-2029 14. Europe Vehicles for Disabled Market Analysis and Forecasts, 2022-2029 14.1. Market Size (Value) Estimates & Forecast By Entry Configuration, 2022-2029 14.2. Market Size (Value) Estimates & Forecast By Entry Mechanism, 2022-2029 14.3. Market Size (Value) Estimates & Forecast By Driving Option, 2022-2029 14.4. Market Size (Value) Estimates & Forecast By Vehicle Type, 2022-2029 15. Europe Vehicles for Disabled Market Analysis and Forecasts, By Country 15.1. Market Size (Value) Estimates & Forecast By Country, 2022-2029 15.1.1. U.K 15.1.2. France 15.1.3. Germany 15.1.4. Italy 15.1.5. Spain 15.1.6. Sweden 15.1.7. CIS Countries 15.1.8. Rest of Europe 16. U.K. Vehicles for Disabled Market Analysis and Forecasts, 2022-2029 16.1. Market Size (Value) Estimates & Forecast By Entry Configuration, 2022-2029 16.2. Market Size (Value) Estimates & Forecast By Entry Mechanism, 2022-2029 16.3. Market Size (Value) Estimates & Forecast By Driving Option, 2022-2029 16.4. Market Size (Value) Estimates & Forecast By Vehicle Type, 2022-2029 17. France Vehicles for Disabled Market Analysis and Forecasts, 2022-2029 17.1. Market Size (Value) Estimates & Forecast By Entry Configuration, 2022-2029 17.2. Market Size (Value) Estimates & Forecast By Entry Mechanism, 2022-2029 17.3. Market Size (Value) Estimates & Forecast By Driving Option, 2022-2029 17.4. Market Size (Value) Estimates & Forecast By Vehicle Type, 2022-2029 18. Germany Vehicles for Disabled Market Analysis and Forecasts, 2022-2029 18.1. Market Size (Value) Estimates & Forecast By Entry Configuration, 2022-2029 18.2. Market Size (Value) Estimates & Forecast By Entry Mechanism, 2022-2029 18.3. Market Size (Value) Estimates & Forecast By Driving Option, 2022-2029 18.4. Market Size (Value) Estimates & Forecast By Vehicle Type, 2022-2029 19. Italy Vehicles for Disabled Market Analysis and Forecasts, 2022-2029 19.1. Market Size (Value) Estimates & Forecast By Entry Configuration, 2022-2029 19.2. Market Size (Value) Estimates & Forecast By Entry Mechanism, 2022-2029 19.3. Market Size (Value) Estimates & Forecast By Driving Option, 2022-2029 19.4. Market Size (Value) Estimates & Forecast By Vehicle Type, 2022-2029 20. Spain Vehicles for Disabled Market Analysis and Forecasts, 2022-2029 20.1. Market Size (Value) Estimates & Forecast By Entry Configuration, 2022-2029 20.2. Market Size (Value) Estimates & Forecast By Entry Mechanism, 2022-2029 20.3. Market Size (Value) Estimates & Forecast By Driving Option, 2022-2029 20.4. Market Size (Value) Estimates & Forecast By Vehicle Type, 2022-2029 21. Sweden Vehicles for Disabled Market Analysis and Forecasts, 2022-2029 21.1. Market Size (Value) Estimates & Forecast By Entry Configuration, 2022-2029 21.2. Market Size (Value) Estimates & Forecast By Entry Mechanism, 2022-2029 21.3. Market Size (Value) Estimates & Forecast By Driving Option, 2022-2029 21.4. Market Size (Value) Estimates & Forecast By Vehicle Type, 2022-2029 22. CIS Countries Vehicles for Disabled Market Analysis and Forecasts, 2022-2029 22.1. Market Size (Value) Estimates & Forecast By Entry Configuration, 2022-2029 22.2. Market Size (Value) Estimates & Forecast By Entry Mechanism, 2022-2029 22.3. Market Size (Value) Estimates & Forecast By Driving Option, 2022-2029 22.4. Market Size (Value) Estimates & Forecast By Vehicle Type, 2022-2029 23. Rest of Europe Vehicles for Disabled Market Analysis and Forecasts, 2022-2029 23.1. Market Size (Value) Estimates & Forecast By Entry Configuration, 2022-2029 23.2. Market Size (Value) Estimates & Forecast By Entry Mechanism, 2022-2029 23.3. Market Size (Value) Estimates & Forecast By Driving Option, 2022-2029 23.4. Market Size (Value) Estimates & Forecast By Vehicle Type, 2022-2029 24. Asia Pacific Vehicles for Disabled Market Analysis and Forecasts, 2022-2029 24.1. Market Size (Value) Estimates & Forecast By Entry Configuration, 2022-2029 24.2. Market Size (Value) Estimates & Forecast By Entry Mechanism, 2022-2029 24.3. Market Size (Value) Estimates & Forecast By Driving Option, 2022-2029 24.4. Market Size (Value) Estimates & Forecast By Vehicle Type, 2022-2029 25. Asia Pacific Vehicles for Disabled Market Analysis and Forecasts, by Country 25.1. Market Size (Value) Estimates & Forecast By Country, 2022-2029 25.1.1. China 25.1.2. India 25.1.3. Japan 25.1.4. South Korea 25.1.5. Australia 25.1.6. ASEAN 25.1.7. Rest of Asia Pacific 26. China Vehicles for Disabled Market Analysis and Forecasts, 2022-2029 26.1. Market Size (Value) Estimates & Forecast By Entry Configuration, 2022-2029 26.2. Market Size (Value) Estimates & Forecast By Entry Mechanism, 2022-2029 26.3. Market Size (Value) Estimates & Forecast By Driving Option, 2022-2029 26.4. Market Size (Value) Estimates & Forecast By Vehicle Type, 2022-2029 27. India Vehicles for Disabled Market Analysis and Forecasts, 2022-2029 27.1. Market Size (Value) Estimates & Forecast By Entry Configuration, 2022-2029 27.2. Market Size (Value) Estimates & Forecast By Entry Mechanism, 2022-2029 27.3. Market Size (Value) Estimates & Forecast By Driving Option, 2022-2029 27.4. Market Size (Value) Estimates & Forecast By Vehicle Type, 2022-2029 28. Japan Vehicles for Disabled Market Analysis and Forecasts, 2022-2029 28.1. Market Size (Value) Estimates & Forecast By Entry Configuration, 2022-2029 28.2. Market Size (Value) Estimates & Forecast By Entry Mechanism, 2022-2029 28.3. Market Size (Value) Estimates & Forecast By Driving Option, 2022-2029 28.4. Market Size (Value) Estimates & Forecast By Vehicle Type, 2022-2029 29. South Korea Vehicles for Disabled Market Analysis and Forecasts, 2022-2029 29.1. Market Size (Value) Estimates & Forecast By Entry Configuration, 2022-2029 29.2. Market Size (Value) Estimates & Forecast By Entry Mechanism, 2022-2029 29.3. Market Size (Value) Estimates & Forecast By Driving Option, 2022-2029 29.4. Market Size (Value) Estimates & Forecast By Vehicle Type, 2022-2029 30. Australia Vehicles for Disabled Market Analysis and Forecasts, 2022-2029 30.1. Market Size (Value) Estimates & Forecast By Entry Configuration, 2022-2029 30.2. Market Size (Value) Estimates & Forecast By Entry Mechanism, 2022-2029 30.3. Market Size (Value) Estimates & Forecast By Driving Option, 2022-2029 30.4. Market Size (Value) Estimates & Forecast By Vehicle Type, 2022-2029 31. ASEAN Vehicles for Disabled Market Analysis and Forecasts, 2022-2029 31.1. Market Size (Value) Estimates & Forecast By Entry Configuration, 2022-2029 31.2. Market Size (Value) Estimates & Forecast By Entry Mechanism, 2022-2029 31.3. Market Size (Value) Estimates & Forecast By Driving Option, 2022-2029 31.4. Market Size (Value) Estimates & Forecast By Vehicle Type, 2022-2029 32. Rest of Asia Pacific Vehicles for Disabled Market Analysis and Forecasts, 2022-2029 32.1. Market Size (Value) Estimates & Forecast By Entry Configuration, 2022-2029 32.2. Market Size (Value) Estimates & Forecast By Entry Mechanism, 2022-2029 32.3. Market Size (Value) Estimates & Forecast By Driving Option, 2022-2029 32.4. Market Size (Value) Estimates & Forecast By Vehicle Type, 2022-2029 33. Middle East Africa Vehicles for Disabled Market Analysis and Forecasts, 2022-2029 33.1. Market Size (Value) Estimates & Forecast By Entry Configuration, 2022-2029 33.2. Market Size (Value) Estimates & Forecast By Entry Mechanism, 2022-2029 33.3. Market Size (Value) Estimates & Forecast By Driving Option, 2022-2029 33.4. Market Size (Value) Estimates & Forecast By Vehicle Type, 2022-2029 34. Middle East Africa Vehicles for Disabled Market Analysis and Forecasts, by Country 34.1. Market Size (Value) Estimates & Forecast by Country, 2022-2029 34.1.1. South Africa 34.1.2. GCC Countries 34.1.3. Egypt 34.1.4. Nigeria 34.1.5. Rest of ME&A 35. South Africa Vehicles for Disabled Market Analysis and Forecasts, 2022-2029 35.1. Market Size (Value) Estimates & Forecast By Entry Configuration, 2022-2029 35.2. Market Size (Value) Estimates & Forecast By Entry Mechanism, 2022-2029 35.3. Market Size (Value) Estimates & Forecast By Driving Option, 2022-2029 35.4. Market Size (Value) Estimates & Forecast By Vehicle Type, 2022-2029 36. GCC Countries Vehicles for Disabled Market Analysis and Forecasts, 2022-2029 36.1. Market Size (Value) Estimates & Forecast By Entry Configuration, 2022-2029 36.2. Market Size (Value) Estimates & Forecast By Entry Mechanism, 2022-2029 36.3. Market Size (Value) Estimates & Forecast By Driving Option, 2022-2029 36.4. Market Size (Value) Estimates & Forecast By Vehicle Type, 2022-2029 37. Egypt Vehicles for Disabled Market Analysis and Forecasts, 2022-2029 37.1. Market Size (Value) Estimates & Forecast By Entry Configuration, 2022-2029 37.2. Market Size (Value) Estimates & Forecast By Entry Mechanism, 2022-2029 37.3. Market Size (Value) Estimates & Forecast By Driving Option, 2022-2029 37.4. Market Size (Value) Estimates & Forecast By Vehicle Type, 2022-2029 38. Nigeria Vehicles for Disabled Market Analysis and Forecasts, 2022-2029 38.1. Market Size (Value) Estimates & Forecast By Entry Configuration, 2022-2029 38.2. Market Size (Value) Estimates & Forecast By Entry Mechanism, 2022-2029 38.3. Market Size (Value) Estimates & Forecast By Driving Option, 2022-2029 38.4. Market Size (Value) Estimates & Forecast By Vehicle Type, 2022-2029 39. Rest of ME&A Vehicles for Disabled Market Analysis and Forecasts, 2022-2029 39.1. Market Size (Value) Estimates & Forecast By Entry Configuration, 2022-2029 39.2. Market Size (Value) Estimates & Forecast By Entry Mechanism, 2022-2029 39.3. Market Size (Value) Estimates & Forecast By Driving Option, 2022-2029 39.4. Market Size (Value) Estimates & Forecast By Vehicle Type, 2022-2029 40. South America Vehicles for Disabled Market Analysis and Forecasts, 2022-2029 40.1. Market Size (Value) Estimates & Forecast By Entry Configuration, 2022-2029 40.2. Market Size (Value) Estimates & Forecast By Entry Mechanism, 2022-2029 40.3. Market Size (Value) Estimates & Forecast By Driving Option, 2022-2029 40.4. Market Size (Value) Estimates & Forecast By Vehicle Type, 2022-2029 41. South America Vehicles for Disabled Market Analysis and Forecasts, by Country 41.1. Market Size (Value) Estimates & Forecast by Country, 2022-2029 41.1.1. Brazil 41.1.2. Argentina 41.1.3. Rest of South America 42. Brazil Vehicles for Disabled Market Analysis and Forecasts, 2022-2029 42.1. Market Size (Value) Estimates & Forecast By Entry Configuration, 2022-2029 42.2. Market Size (Value) Estimates & Forecast By Entry Mechanism, 2022-2029 42.3. Market Size (Value) Estimates & Forecast By Driving Option, 2022-2029 42.4. Market Size (Value) Estimates & Forecast By Vehicle Type, 2022-2029 43. Argentina Vehicles for Disabled Market Analysis and Forecasts, 2022-2029 43.1. Market Size (Value) Estimates & Forecast By Entry Configuration, 2022-2029 43.2. Market Size (Value) Estimates & Forecast By Entry Mechanism, 2022-2029 43.3. Market Size (Value) Estimates & Forecast By Driving Option, 2022-2029 43.4. Market Size (Value) Estimates & Forecast By Vehicle Type, 2022-2029 44. Rest of South America Vehicles for Disabled Market Analysis and Forecasts, 2022-2029 44.1. Market Size (Value) Estimates & Forecast By Entry Configuration, 2022-2029 44.2. Market Size (Value) Estimates & Forecast By Entry Mechanism, 2022-2029 44.3. Market Size (Value) Estimates & Forecast By Driving Option, 2022-2029 44.4. Market Size (Value) Estimates & Forecast By Vehicle Type, 2022-2029 45. Competitive Landscape 45.1. Geographic Footprint of Major Players in the Vehicles for Disabled Market 45.2. Competition Matrix 45.2.1. Competitive Benchmarking of key players By Entry Mechanism, presence, market share, Applications and R&D investment 45.2.2. New Product Launches and Product Enhancements 45.2.3. Market Consolidation 45.2.3.1. M&A by Regions, Investment and Applications 45.2.3.2. M&A Key Players, Forward Integration and Backward Integration 45.3. Company Profile: Key Players 45.3.1. GKN Plc 45.3.1.1. Company Overview 45.3.1.2. Financial Overview 45.3.1.3. Geographic Footprint 45.3.1.4. Product Portfolio 45.3.1.5. Business Strategy 45.3.1.6. Recent Developments 45.4. Toyota Motor Corporation 45.5. BraunAbility 45.6. Pride Mobility 45.7. Sunrise Medical Holdings 45.8. Invacare Corporation 45.9. KYMCO Global 45.10. Vantage Mobility International 45.11. Amigo Mobility International, Inc. 45.12. Mobilit Works 45.13. Revability, Inc. 45.14. Advanced Mobility Products Inc. 45.15. Brotherwood Automobility Limited 45.16. GM Coachwork Ltd. 45.17. Gowrings Mobility Group Limited 45.18. KIRCHHOFF Mobility GmbH & Co. KG 45.19. KWANG YANG MOTOR CO., LTD. (KYMCO) 45.20. Pride Mobility Products Corp. 45.21. TGA Mobility 46. Primary Key Insights
  • INQUIRE BEFORE BUYING