
Van Market - Industry Structure Evaluation, Demand Drivers Analysis, Regional Growth Analysis and Identification, Competitive Positioning Review & Global Market Size Forecast to 2032
Overview
The Van Market size was valued at USD 171.12 Billion in 2025 and the total Van revenue is expected to grow at a CAGR of 3.9% from 2025 to 2032, reaching nearly USD 223.68 Billion.
Van Market Overview:
A vehicle used to transport cargo. It is frequently bigger than a car but smaller than a truck, with an enclosed rear and no side windows. A van's interior space is optimized to be longer and taller than a car while remaining smaller than a truck. Vans often have a taller roof, reconfigurable seats, a flat floor, and sliding doors for the back entry. Furthermore, the driver's sitting arrangements maximize internal space, making it seem more comfortable and spacious. The majority of vans can comfortably accommodate 15 passengers without luggage.
Vans can also be utilized to carry students to and from school. In India, for example, the van is one of the most prevalent vehicles for carrying schoolchildren, generally when the school buses are full. Therefore, it is expected that the need for vans to transport schoolchildren would rise in the near future, propelling the growth of the global van market. Regarding current automotive technology and driver assistance features, vans remain behind SUVs and utility vehicles. Due to the engine location, there is substantially less of a crush zone in front of the driver, making it more challenging for a van to receive a 5-star ANCAP crash test rating for driver and passenger safety, which is more challenging for van OMEs. The report covered detailed analyses of van opportunity and market strategies to drive the van market.
 To know about the Research Methodology :- Request Free Sample Report
Van Market Dynamics:
CO2 emission standards for new cars and vans
The three main goals of the legislative proposal to amend Regulation 2019/631, which establishes CO2 emission performance criteria for automobiles and light commercial vehicles, are:
1. Reduce CO2 emissions from cars and vans in order to help the country meet its climate goals for the years 2030 and 2050, keeping in mind the need of taking action quickly due to the short lifespan of these vehicles,
2. assist residents through the widespread use of zero-emission cars by improving air quality, conserving energy, and lowering the overall cost of ownership of such vehicles,
3. promote employment, boost the technological leadership of all country manufacturers and suppliers, and encourage the development of zero-emission technology. By establishing more demanding rules for decreasing the CO2 emissions of new vehicles and vans, the proposal modifies Regulation 2019/631. The emissions of new passenger vehicles registered in the country would need to be 55% lower by 2030 compared to the CO2 emissions standards applicable in 2023, and the emissions of new vans registered in the countries would need to be 50% lower.
New passenger cars and vans would have to cut their CO2 emissions by 100% by 2035 or have zero emissions altogether. Beginning in 2030, the incentive for zero- and low-emission cars would no longer be available. Only manufacturers with less than 1000 new vehicle registrations each year will be eligible to request a derogation from the specified emissions goal as of 2030. In 2029, the exemption for manufacturers producing between 1,000 and 10,000 automobiles or between 1,000 and 22,000 vans will come to an end.
CO2 reduction targets in the current and proposed legislation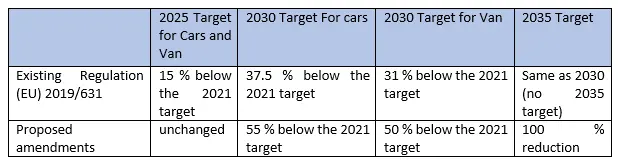
Commercial van market growth creates new equipment opportunities to market players
According to data on commercial van sales provided by the NTEA (National Truck Equipment Association), these sales are on the rise and are increasing year over year. Sales of commercial vans increased by 56.7% from 2013 to 2020. With such steady growth, also manufacturers have increased their product lines and now offer customers a variety of commercial and cargo van alternatives, including different van chassis, heights, engines, and drivetrains. Commercial cargo van-specific equipment has been added to the product ranges of manufacturers of commercial vehicle equipment, which drive the demand of van equipments in van market.
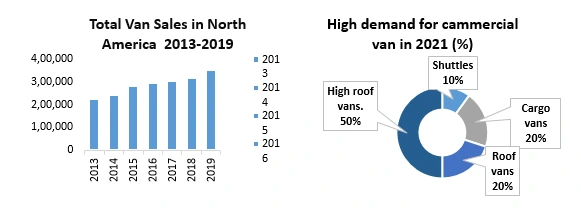 For example, Ford and GM remade themselves and emerged from the recession by changing their product lines to meet new market demands. The producers turned to Europe and identified an excellent chance to introduce commercial vehicles designed in Europe to North America. In North America, demand for commercial vehicles has grown. Their popularity peaked in 2012 and has continued to grow ever since. OEMs have been identified by the National Truck Equipment Association (NTEA) as producers of commercial vans: Ford, GM, Mercedes-Benz/Freightliner, Dodge Ram, and Nissan. With rising opportunity and demand for mobile air compressors for business vans, air compressor manufacturers have been slow to adapt their products for this popular kind of commercial vehicle, rapid adoption of this creat new opportunities for market players in the van market.
Van Market Segment Analysis:
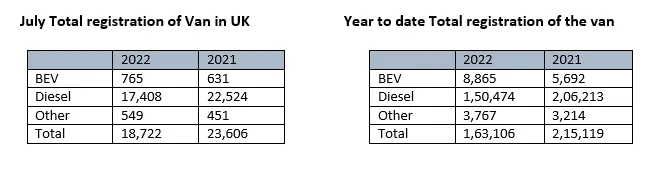
Based on Type, the Van Market is segmented into Battery electric vehicles, Plug-in hybrid electric vehicles, hybrid electric vehicles, Internal combustion engine vehicles, and Gasoline vehicles. Battery-electric vehicles are expected to grow faster during the forecast period. All LCV categories had a decline in registrations in July, with 14,782 new vans weighing above 2.5 tonnes and up to 3.5 tonnes being registered in the month, a -11.2% decrease from 2022. The number of lighter vehicles weighing 2.0 tonnes or less fell by 20.3%, while the number of vans weighing between 2.0 tonnes and 2.5 tonnes fell by 49.8%. With continued industry investment in battery-electric vans (BEVs), demand is rising.
In July, 765 BEVs were registered, an increase of 21.2%. This trend of increased uptake will continue in the first half of 2022 as van buyers take advantage of new electric models that offer longer ranges, efficiency savings, and quick charge times. As a result, 8,865 BEVs—a 55.7% increase—have been reported thus far this year. This is an increase from one in 37 a year earlier, but it still only accounts for one in 18 of all vans registered so far in 2023. The industry prognosis has been reduced from 328,000 to 307,000 new registrations for the year due to the continued weakness in overall registration volumes, a decrease of -6.5% from the previous outlook released in April. The market is now expected to end -13.7% lower than in 2022, when penetration nearly reached pre-pandemic levels. 4 Volumes are forecast to reach 357,000 units in 2023, a 16.4% increase, as the semiconductor scarcity is anticipated to start to improve during that year. BEVs are still expected to make up 6.4% of registrations this year, but the forecast for 2023 has been significantly revised lower, from 9.6% to 9.2%.
 Based on the Application, the Van Market is segmented into Up to 2 Tons, 2-3 Tons, 3-5.5 Tons. 2-3 Tons are expected to grow faster during the forecast period. Pick-up trucks, commercial 4x4s, and various sizes of vans are all included in the market for light commercial vehicles that weigh up to 3.5 tonnes. Despite sales falling by just under 10%, vans weighing between 2.5 and 3.5 tonnes continued to account for the majority of new registrations, making up just under two-thirds (65.8%) of the market overall.
The second-most popular vehicles on the market were vans weighing between two and 2.5 tonnes, although they only made up around a fourth of all purchases (24.9 percent). That followed a sector increase of more than a third from the same month in 2022. Light commercial vehicle (LCV) vans with a tonnage of less than 2.5 tons is heavily used to transport goods across shorter or closer distances, driven by the growing demand for products from e-commerce. The expansion of the industrial sector in developing countries, rising demand from the logistics sector, and expanding demand from the global construction sector are all driving the market development in the 2.5 tons category.
Van Market Regional Insights:
Europe dominated the market with a 56 % share in 2025. Europe is expected to witness significant growth during for the cast period. Van sales in Europe saw a marked decline, which may be mainly attributable to supply chain disruptions, a stop in manufacturing, and decreased customer demand as a result of falling purchasing power.
The tendency of consumers toward online shopping and the availability of user-friendly mobile applications for the online purchase of a range of items, including industrial goods, have been the main drivers of the e-commerce industry's growth in Europe during the past few years. The need for vans for last-mile deliveries of products and commodities is probably going to rise as a result. In 2022 compared to 2020, the European e-commerce sector's revenue increased by roughly 10%. In the European transportation industry, road travel is essential. For example, road transportation, or around 1,750 billion metric ton-kilometers, accounts for almost 75% of inland freight movement inside the EU, according to Eurostat.
In certain European countries, this ratio might be as high as 90%. The market is seeing significant growth as a result of the growing commercial relationships between regional parcel service providers and original equipment manufacturers. FedEx and BrightDrop, a division of General Motors, teamed together in January 2023 to provide the latter with vehicles for its home delivery service. The van market in Europe is quite competitive. Major OEMs' presence in the area is expected to drive the market's growth. Mercedes Benz, Volkswagen Group, Ford Motor Company, and Vauxhall are among the market's major competitors. New entrants like Arrival Electric Group Limited also serve the demands of the region's electric van market. The report covered detailed analyses of the current van market in Europe with key market players’ sales in 2025-2026.
Competitive Landscape
The van market is very competitive. Major OEMs' presence in the region is expected to drive the market's growth. Mercedes Benz, Volkswagen Group, Ford Motor Company, and Vauxhall are among the market's major competitors. New entrants like Arrival Electric Group Limited also service the demands of the region's van market. The adoption of electric cars is extremely obvious in many growing economies due to the significant growth among sectors, such as logistics and supply chain companies. Additionally, the strict pollution regulations that are forcing many companies to electrify their automobiles throughout the globe also play a significant part in the market's development. For example, the company introduced the new Renault Kangoo Van in 2022, effectively addressing the sizable European van market, and gaining an advantage over competitors.
Renault began taking bookings for the new Traffic van in March 2022, and sales will begin at the end of the year. The van's entirely rebuilt interior and cabin are expected to provide the highest level of functionality and mobile connectivity. For long-haul travel reasons, the vehicle also has updated ADAS features. Volkswagen and Ford Motor Company announced their partnership in June 2020 as part of their present worldwide alliance for light commercial vans, electrification of vans, and autonomous driving.
The van market report covered a detailed competitive landscape, which provides details by a competitor like a company overview, company financials, revenue generated, market potential, investment in research and development, new market initiatives, global presence, production sites and facilities, production capacities, company strengths, and weaknesses, product launch, product width, and breadth, application dominance.
Recent Industry Developments
| Exact Date | Company | Development | Impact |
|---|---|---|---|
| 27 March 2026 | SMMT / Industry | Released data showing a 10.3% decline in the light commercial vehicle (LCV) registrations for the fiscal period, despite a record rise in battery electric van (BEV) uptake. | The contraction highlights the gap between mandated zero-emission targets and real-world commercial demand, pressuring manufacturers to increase discounting. |
| 26 March 2026 | Farizon Auto | Confirmed the expansion of its UK operations with a new leadership appointment to drive the rollout of its next-generation electric delivery vans. | This move intensifies competitive pressure on established European OEMs by introducing high-tech, cost-competitive electric platforms for last-mile logistics. |
| 06 January 2026 | Ford Motor Company | Announced that the Transit Custom remained the best-selling van, supported by the integration of advanced 5G telematics across its 2026 fleet models. | Enhanced connectivity features solidify Ford's leadership in the one-tonne van segment by providing superior fleet management and uptime for commercial operators. |
| 14 January 2025 | Mercedes-Benz Group AG | Commenced the final testing phase of its VAN.EA modular electric architecture, scheduled to underpin all new medium and large vans from 2026 onwards. | The transition to a dedicated EV platform reduces production complexity and enables high-performance 800-volt charging capabilities for premium commercial fleets. |
Van Market Scope: Inquiry Before Buying
| Van Market | |||
|---|---|---|---|
| Report Coverage | Details | ||
| Base Year: | 2025 | Forecast Period: | 2026-2032 |
| Historical Data: | 2020 to 2025 | Market Size in 2025: | 171.12 USD Billion |
| Forecast Period 2026-2032 CAGR: | 3.9% | Market Size in 2032: | 223.68 USD Billion |
| Segments Covered: | by Tonnage Capacity | Up to 2 Tons 2–3 Tons 3–5.5 Tons |
|
| by Propulsion Type | Internal Combustion Engine (ICE) Electric (BEV) Hybrid (HEV / PHEV) Others |
||
| by End Use | Commercial Personal |
||
Van Market, by Region
North America (United States, Canada and Mexico)
Europe (UK, France, Germany, Italy, Spain, Sweden, Austria and Rest of Europe)
Asia Pacific (China, South Korea, Japan, India, Australia, Indonesia, Malaysia, Vietnam, Taiwan, Bangladesh, Pakistan and Rest of APAC)
Middle East and Africa (South Africa, GCC, Egypt, Nigeria and Rest of ME&A)
South America (Brazil, Argentina Rest of South America)
Key Players / Competitors Profiles Covered in Brief in Global Van Market Report in Strategic Perspective:
- Toyota Motor Corporation
- Volkswagen Group
- Hyundai Motor Company
- General Motors
- Ford Motor Company
- Nissan Motor Co., Ltd.
- Honda Motor Co., Ltd.
- Stellantis NV
- Mercedes-Benz Group AG
- Renault
- Isuzu Motors Limited
- Mitsubishi Motors Corporation
- Iveco Group
- BYD Company Limited
- Volvo Group
- SAIC Motor Corporation
- Tata Motors Limited
- Mahindra & Mahindra Ltd.
- Rivian Automotive Inc.
- Arrival Electric Group Limited
- BrightDrop
- Vauxhall Motors
- Farizon Auto
- Kia Corporation
- Hino Motors, Ltd.