Torque Vectoring Market: Global Torque Vectoring Market Size Boosted by Record-High 8.3% EV Share in New Vehicle Sales in 2024

The Torque Vectoring Market size was valued at USD 10.11 Billion in 2023 and the global Torque Vectoring Market is expected to grow at a CAGR of 16.88% from 2024 to 2030, reaching nearly USD 30.12 Billion.

Global Torque Vectoring Market Overview:

Torque vectoring is a technology used in vehicles to improve their handling, stability, and performance by controlling the distribution of torque (rotational force) between the wheels. Torque vectoring works by applying more torque to certain wheels or reducing torque to others, depending on various factors such as speed, steering angle, road conditions, and traction. By selectively braking or accelerating individual wheels, torque vectoring can enhance cornering ability, reduce understeer or oversteer, prevent wheel slip, and increase traction and stability in challenging situations such as wet or slippery roads, off-road driving, or high-speed maneuvers. Torque vectoring can be implemented using different methods, including mechanical, hydraulic, electric, or electronic systems. The demand for torque vectoring technologies and systems in the automotive industry has been increasing steadily in recent years, driven by several factors such as the need for improved vehicle handling, safety, and performance, as well as the growing popularity of all-wheel drive (AWD) and electric vehicles (EVs). According to a report by MMR, the global torque vectoring market size is expected to grow at a compound annual growth rate (CAGR) of 16.88% during the forecast period. This growth is attributed to factors such as the growing demand for advanced driving assistance systems (ADAS), the rising popularity of electric and hybrid vehicles, and the growing trend of integrating torque vectoring with other safety and performance features. The market comprises various types of torque vectoring technologies, including mechanical, hydraulic, electric, and electronic systems, and it includes different applications such as passenger cars, commercial vehicles, and off-road vehicles. The automotive industry is expected to continue driving the demand for torque vectoring technologies, as manufacturers strive to meet the evolving needs and preferences of consumers and comply with increasingly stringent safety and environmental regulations.Torque Vectoring Market
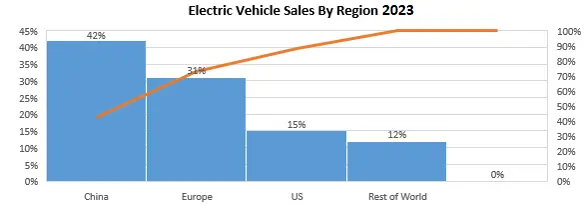
Growing Popularity of Electric Vehicles (EVs):
According to MMR report, India’s Electric Vehicle Market size was valued at US$ 326.6 Mn. in 2021 and the total revenue is expected to grow at 94.2% from 2024 to 2030, reaching US$ 66,070.86 Mn. Despite the COVID-19 pandemic, the International Energy Agency (IEA) reports that the global electric vehicle (EV) market has been growing rapidly in recent years, with sales rising from from 2.3 million units in 2019 to 3.1 million units in 2020.
China has been the largest EV industry in the world for several years, thanks to its ambitious
government policies and incentives to promote the adoption of EVs, as well as the large population and high urbanization rate. Europe has also been experiencing strong growth in EV sales, driven by the tightening of emissions regulations, increasing consumer awareness and interest, and the launch of new EV models by major automakers. The United States, while lagging behind China and Europe in absolute numbers, has been steadily increasing its EV market share, with several states implementing incentives and regulations to support EV adoption. Other regions, including Japan, Canada, and South Korea, have also been growing their EV markets, albeit at a slower pace.Torque Vectoring Market 
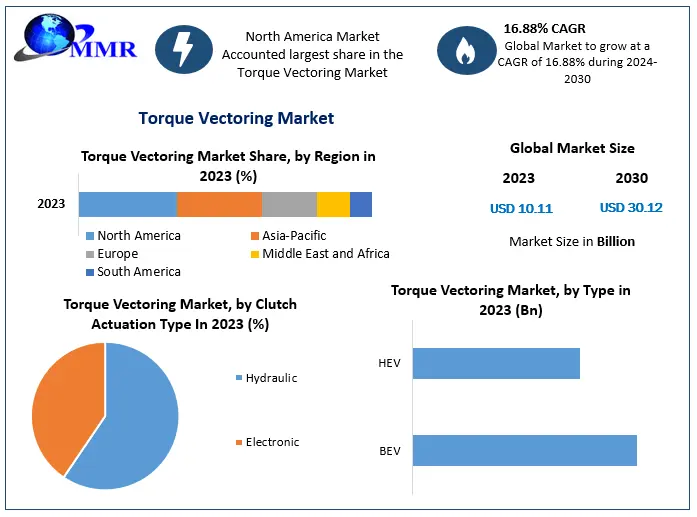
To know about the Research Methodology :- Request Free Sample Report

Torque Vectoring Market Dynamics:

The MMR report covers all the trends and technologies playing a major role in the growth of the Torque Vectoring Market over the forecast period. It highlights the drivers, restraints, and opportunities expected to influence the market growth during 2024-2030
Growing Demand For Advanced Driving Assistance Systems (ADAS):
ADAS technologies, such as torque vectoring, are becoming increasingly popular among consumers due to their ability to improve vehicle handling, stability, and safety. With the growing awareness about the benefits of ADAS and the increasing adoption of electric and hybrid vehicles, the demand for torque vectoring systems is expected to rise in the future.
Integration With Other Safety and Performance Features:
Torque vectoring systems can be integrated with other safety and performance features, such as electronic stability control (ESC), traction control, and anti-lock braking systems (ABS), to enhance the overall driving experience. This integration has been a key driver of the market, as automakers strive to differentiate their vehicles by offering advanced safety and performance features.
Autonomous Driving:
The growing trend of autonomous driving is expected to further increase the demand for torque vectoring systems in the future, as these systems can help improve the accuracy and efficiency of autonomous driving systems. Torque vectoring can help improve the stability and control of autonomous vehicles, especially in challenging driving conditions.
Government Regulations and Safety Standards:
Government regulations and safety standards are becoming increasingly stringent, and automakers are required to integrate advanced safety features in their vehicles. Torque vectoring systems can help automakers comply with these regulations and standards by improving the safety and stability of their vehicles.
Restraints:
Complexity of the system: Torque vectoring systems are complex and require specialized knowledge and expertise to design, develop, and integrate into vehicles. This can make it difficult for smaller players to enter the market and compete with established players. Limited awareness and education among consumers: Many consumers are not aware of the benefits of torque vectoring systems and may not be willing to pay extra for these systems. This can limit the demand for these systems and affect market growth. Challenges in integration with existing vehicle systems: Torque vectoring systems may need to be integrated with other vehicle systems, such as braking and stability control systems, to work effectively. This can pose technical challenges and increase the complexity and cost of integration. Dependence on market trends and government regulations: The torque vectoring market is heavily influenced by market trends and government regulations, such as emission and safety standards. Changes in these factors can have a significant impact on the demand for these systems, making it difficult for manufacturers to plan and invest in new products and technologies.
Torque Vectoring Market Trends:
• The development of advanced sensors and control technologies, such as LiDAR and artificial intelligence, is enabling the development of more sophisticated and accurate torque vectoring systems. This is expected to drive innovation and create new growth opportunities in the market. • The growing demand for electric and hybrid vehicles is driving the adoption of torque vectoring systems. These systems help to improve the performance, efficiency, and handling of these vehicles, which are becoming increasingly popular among consumers. • The demand for high-performance vehicles, such as sports cars and luxury vehicles, is driving the adoption of advanced torque vectoring systems. These systems help to improve the handling and performance of these vehicles, providing a better driving experience for consumers. • Manufacturers are increasingly focusing on developing lightweight and compact torque vectoring systems that can be easily integrated into vehicles without adding significant weight or bulk. This is particularly important for electric vehicles, where weight and space are critical factors.

Torque Vectoring Market Segment Analysis:

Based on Vehicle Type, Passenger vehicle segment is expected to grow at a CAGR of 17.34% over forecast period. This growth is driven by passenger vehicles are typically equipped with more advanced features and systems than light commercial vehicles. Additionally, the growing demand for high-performance vehicles and the integration of torque vectoring systems with ADAS technologies are expected to drive growth in the passenger car segment. Based on Propulsion, The AWD/4WD segment is expected to account for the largest share of the torque vectoring market, driven by the increasing demand for SUVs and other off-road vehicles. However, the RWD segment is also expected to experience growth, particularly in the high-performance vehicle segment. The FWD segment is expected to have a smaller share of the market, but may still see some growth as manufacturers continue to innovate and develop new torque vectoring systems for these vehicles. FWD vehicles typically have less need for torque vectoring systems, as the weight distribution of the vehicle is more balanced and the driving force is spread across the front wheels. RWD vehicles, on the other hand, can benefit from torque vectoring systems to improve handling and reduce the risk of oversteer or understeer. AWD/4WD vehicles, which provide power to all four wheels, can also benefit from torque vectoring systems to optimize power distribution and improve handling.Torque Vectoring Market 
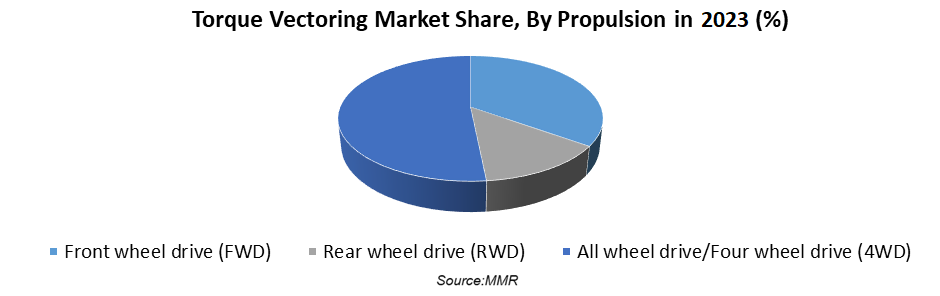
Based on Consumer group, the Torque Vectoring Market is segmented into Men, Women, and Kids. The Men segment held the largest market share in 2023. The high participation of men in sports and outdoor activities are driving the segment growth. However, the increasing participation in outdoor activity and fashion trend of wearing outdoor apparels among women are expected to boost the women consumer group segment growth through the forecast period. By Technology, passive torque vectoring system segment dominated the global market torque vectoring market in 2023 and active torque vectoring system is expected to be the fastest growing segment during 2024-2030. Passive torque vectoring systems, on the other hand, rely on mechanical or hydraulic components to distribute torque between the wheels. While they may not be as precise or responsive as active systems, they are often simpler and less expensive to implement. However, active torque vectoring systems are expected to have a larger share of the market, particularly in the high-performance vehicle segment and among luxury vehicles. Passive torque vectoring systems may still see some growth in the mid-range and economy vehicle segments, where cost and simplicity are more important factors.

Torque Vectoring Market Regional Insights:

North America held the largest market share of the global Torque Vectoring market in 2023. The North America torque vectoring market is expected to see significant growth in the coming years, driven by factors such as the increasing demand for high-performance and luxury vehicles, the focus on safety and efficiency, and the presence of major automotive manufacturers and suppliers in the region. The United States is the largest market for torque vectoring in North America, with a significant share of the market driven by the high demand for performance and luxury vehicles, as well as the increasing adoption of advanced safety and performance features. Canada and Mexico are also expected to see growth in the torque vectoring market, driven by factors such as the growing automotive industry in these countries, the increasing focus on safety and efficiency, and the presence of major automotive manufacturers and suppliers. Asia Pacific Occupied the Second Largest Market Share In 2023. The Asia Pacific torque vectoring market is a rapidly growing market that involves the use of advanced automotive technology to improve vehicle stability and handling. Torque vectoring is a technology that enables individual wheels to receive varying amounts of torque, resulting in improved vehicle performance and handling. The Asia Pacific region is a significant contributor to the global automotive industry, with countries such as China, Japan, and India leading the way in terms of production and sales. The increasing demand for high-performance vehicles and the rising adoption of electric vehicles in the region are expected to drive the growth of the torque vectoring market in Asia Pacific. The use of torque vectoring technology in electric vehicles is particularly significant, as it helps to improve the overall driving experience and range of these vehicles. Furthermore, the increasing focus on vehicle safety and the growing demand for advanced driver assistance systems (ADAS) is expected to further drive the growth of the torque vectoring market in the region.

Competitive Landscapes:

The torque vectoring market is highly competitive, with several players operating in the market. The market is primarily dominated by major automotive manufacturers, but there are also several new entrants and specialized companies that are gaining traction. Various companies are forming partnerships and collaborations to develop new torque vectoring systems and bring them to market more quickly. For example, Bosch and Daimler recently announced a partnership to develop and launch a new torque vectoring system for electric vehicles. Here are some recent developments by companies in the torque vectoring market such as, In 2020, Bosch developed a new torque vectoring system for electric vehicles called e-axle, which combines an electric motor, power electronics, and transmission into a single unit.

Torque Vectoring Market Scope: Inquiry Before Buying

Torque Vectoring Market
Report Coverage Details
Base Year: 2023 Forecast Period: 2024-2030
Historical Data: 2018 to 2023 Market Size in 2023: USD 10.11 Billion
Forecast Period 2024 to 2030 CAGR: 16.88% Market Size in 2030: USD 30.12 Billion
Segments Covered: by Vehicle Type 1. Passenger Car 2. Light Commercial Vehicle
by Propulsion 1. Front wheel drive (FWD) 2. Rear wheel drive (RWD) 3. All wheel drive/Four wheel drive (4WD)
by Clutch Actuation Type 1. Hydraulic 2. Electronic
by EV Type 1. BEV 2. HEV

Global Market, by Region

North America (United States, Canada and Mexico) Europe (UK, France, Germany, Italy, Spain, Sweden, Austria and Rest of Europe) Asia Pacific (China, South Korea, Japan, India, Australia, Indonesia, Malaysia, Vietnam, Taiwan, Bangladesh, Pakistan and Rest of APAC) Middle East and Africa (South Africa, GCC, Egypt, Nigeria and Rest of ME&A) South America (Brazil, Argentina Rest of South America)

Torque Vectoring Market Key Players:

1. JTEKT Corporation 2. Continental AG 3. GKN plc 4. BorgWarner Inc. 5. Schaeffler AG 6. ZF Friedrichshafen AG 7. Eaton Corporation 8. Magna International Inc. 9. Mitsubishi Electric Corporation 10. Dana Incorporated 11. American Axle & Manufacturing Holdings, Inc. 12. Robert Bosch GmbH 13. AVL List GmbH 14. Ricardo plc 15. Oerlikon Graziano 16. Infineon Technologies AG 17. Timken

FAQs:

1] What segments are covered in the Global Torque Vectoring Market report? Ans. The segments covered in the Torque Vectoring report are based on A Vehicle Type, Propulsion, Clutch Actuation Type, EV Type and Region. 2] Which region is expected to hold the highest share in the Global Torque Vectoring Market during the forecast period? Ans. The North America region is expected to hold the highest share of the Torque Vectoring market during the forecast period. 3] What is the market size of the Global Torque Vectoring by 2030? Ans. The market size of the Torque Vectoring by 2030 is expected to reach US$ 30.12 Bn. 4] What is the forecast period for the Global Torque Vectoring Market? Ans. The forecast period for the Torque Vectoring market is 2024-2030 5] What was the market size of the Global Torque Vectoring in 2023? Ans. The market size of the Torque Vectoring in 2023 was valued at US$ 10.11 Bn.
1. Torque Vectoring Market Introduction 1.1. Study Assumption and Market Definition 1.2. Scope of the Study 1.3. Executive Summary 2. Torque Vectoring Market: Dynamics 2.1. Torque Vectoring Market Trends by Region 2.1.1. North America Torque Vectoring Market Trends 2.1.2. Europe Torque Vectoring Market Trends 2.1.3. Asia Pacific Torque Vectoring Market Trends 2.1.4. Middle East and Africa Torque Vectoring Market Trends 2.1.5. South America Torque Vectoring Market Trends 2.2. Torque Vectoring Market Dynamics by Region 2.2.1. North America 2.2.1.1. North America Torque Vectoring Market Drivers 2.2.1.2. North America Torque Vectoring Market Restraints 2.2.1.3. North America Torque Vectoring Market Opportunities 2.2.1.4. North America Torque Vectoring Market Challenges 2.2.2. Europe 2.2.2.1. Europe Torque Vectoring Market Drivers 2.2.2.2. Europe Torque Vectoring Market Restraints 2.2.2.3. Europe Torque Vectoring Market Opportunities 2.2.2.4. Europe Torque Vectoring Market Challenges 2.2.3. Asia Pacific 2.2.3.1. Asia Pacific Torque Vectoring Market Drivers 2.2.3.2. Asia Pacific Torque Vectoring Market Restraints 2.2.3.3. Asia Pacific Torque Vectoring Market Opportunities 2.2.3.4. Asia Pacific Torque Vectoring Market Challenges 2.2.4. Middle East and Africa 2.2.4.1. Middle East and Africa Torque Vectoring Market Drivers 2.2.4.2. Middle East and Africa Torque Vectoring Market Restraints 2.2.4.3. Middle East and Africa Torque Vectoring Market Opportunities 2.2.4.4. Middle East and Africa Torque Vectoring Market Challenges 2.2.5. South America 2.2.5.1. South America Torque Vectoring Market Drivers 2.2.5.2. South America Torque Vectoring Market Restraints 2.2.5.3. South America Torque Vectoring Market Opportunities 2.2.5.4. South America Torque Vectoring Market Challenges 2.3. PORTER’s Five Forces Analysis 2.4. PESTLE Analysis 2.5. Technology Roadmap 2.6. Regulatory Landscape by Region 2.6.1. North America 2.6.2. Europe 2.6.3. Asia Pacific 2.6.4. Middle East and Africa 2.6.5. South America 2.7. Key Opinion Leader Analysis For Torque Vectoring Industry 2.8. Analysis of Government Schemes and Initiatives For Torque Vectoring Industry 2.9. Torque Vectoring Market Trade Analysis 2.10. The Global Pandemic Impact on Torque Vectoring Market 3. Torque Vectoring Market: Global Market Size and Forecast by Segmentation by Demand and Supply Side (by Value in USD Million) 2023-2030 3.1. Torque Vectoring Market Size and Forecast, by Vehicle Type (2023-2030) 3.1.1. Passenger Car 3.1.2. Light Commercial Vehicle 3.2. Torque Vectoring Market Size and Forecast, by Propulsion (2023-2030) 3.2.1. Front wheel drive (FWD) 3.2.2. Rear wheel drive (RWD) 3.2.3. All wheel drive/Four wheel drive (4WD) 3.3. Torque Vectoring Market Size and Forecast, by Clutch Actuation Type (2023-2030) 3.3.1. Hydraulic 3.3.2. Electronic 3.4. Torque Vectoring Market Size and Forecast, by EV Type (2023-2030) 3.4.1. BEV 3.4.2. HEV 3.5. Torque Vectoring Market Size and Forecast, by Region (2023-2030) 3.5.1. North America 3.5.2. Europe 3.5.3. Asia Pacific 3.5.4. Middle East and Africa 3.5.5. South America 4. North America Torque Vectoring Market Size and Forecast by Segmentation (by Value in USD Million) 2023-2030 4.1. North America Torque Vectoring Market Size and Forecast, by Vehicle Type (2023-2030) 4.1.1. Passenger Car 4.1.2. Light Commercial Vehicle 4.2. North America Torque Vectoring Market Size and Forecast, by Propulsion (2023-2030) 4.2.1. Front wheel drive (FWD) 4.2.2. Rear wheel drive (RWD) 4.2.3. All wheel drive/Four wheel drive (4WD) 4.3. North America Torque Vectoring Market Size and Forecast, by Clutch Actuation Type (2023-2030) 4.3.1. Hydraulic 4.3.2. Electronic 4.4. North America Torque Vectoring Market Size and Forecast, by EV Type (2023-2030) 4.4.1. BEV 4.4.2. HEV 4.5. North America Torque Vectoring Market Size and Forecast, by Country (2023-2030) 4.5.1. United States 4.5.1.1. United States Torque Vectoring Market Size and Forecast, by Vehicle Type (2023-2030) 4.5.1.1.1. Passenger Car 4.5.1.1.2. Light Commercial Vehicle 4.5.1.2. United States Torque Vectoring Market Size and Forecast, by Propulsion (2023-2030) 4.5.1.2.1. Front wheel drive (FWD) 4.5.1.2.2. Rear wheel drive (RWD) 4.5.1.2.3. All wheel drive/Four wheel drive (4WD) 4.5.1.3. United States Torque Vectoring Market Size and Forecast, by Clutch Actuation Type (2023-2030) 4.5.1.3.1. Hydraulic 4.5.1.3.2. Electronic 4.5.1.4. United States Torque Vectoring Market Size and Forecast, by EV Type (2023-2030) 4.5.1.4.1. BEV 4.5.1.4.2. HEV 4.5.2. Canada 4.5.2.1. Canada Torque Vectoring Market Size and Forecast, by Vehicle Type (2023-2030) 4.5.2.1.1. Passenger Car 4.5.2.1.2. Light Commercial Vehicle 4.5.2.2. Canada Torque Vectoring Market Size and Forecast, by Propulsion (2023-2030) 4.5.2.2.1. Front wheel drive (FWD) 4.5.2.2.2. Rear wheel drive (RWD) 4.5.2.2.3. All wheel drive/Four wheel drive (4WD) 4.5.2.3. Canada Torque Vectoring Market Size and Forecast, by Clutch Actuation Type (2023-2030) 4.5.2.3.1. Hydraulic 4.5.2.3.2. Electronic 4.5.2.4. Canada Torque Vectoring Market Size and Forecast, by EV Type (2023-2030) 4.5.2.4.1. BEV 4.5.2.4.2. HEV 4.5.3. Mexico 4.5.3.1. Mexico Torque Vectoring Market Size and Forecast, by Vehicle Type (2023-2030) 4.5.3.1.1. Passenger Car 4.5.3.1.2. Light Commercial Vehicle 4.5.3.2. Mexico Torque Vectoring Market Size and Forecast, by Propulsion (2023-2030) 4.5.3.2.1. Front wheel drive (FWD) 4.5.3.2.2. Rear wheel drive (RWD) 4.5.3.2.3. All wheel drive/Four wheel drive (4WD) 4.5.3.3. Mexico Torque Vectoring Market Size and Forecast, by Clutch Actuation Type (2023-2030) 4.5.3.3.1. Hydraulic 4.5.3.3.2. Electronic 4.5.3.4. Mexico Torque Vectoring Market Size and Forecast, by EV Type (2023-2030) 4.5.3.4.1. BEV 4.5.3.4.2. HEV 5. Europe Torque Vectoring Market Size and Forecast by Segmentation (by Value in USD Million) 2023-2030 5.1. Europe Torque Vectoring Market Size and Forecast, by Vehicle Type (2023-2030) 5.1. Europe Torque Vectoring Market Size and Forecast, by Propulsion (2023-2030) 5.1. Europe Torque Vectoring Market Size and Forecast, by Clutch Actuation Type (2023-2030) 5.1. Europe Torque Vectoring Market Size and Forecast, by EV Type (2023-2030) 5.5. Europe Torque Vectoring Market Size and Forecast, by Country (2023-2030) 5.5.1. United Kingdom 5.5.1.1. United Kingdom Torque Vectoring Market Size and Forecast, by Vehicle Type (2023-2030) 5.5.1.2. United Kingdom Torque Vectoring Market Size and Forecast, by Propulsion (2023-2030) 5.5.1.3. United Kingdom Torque Vectoring Market Size and Forecast, by Clutch Actuation Type (2023-2030) 5.5.1.4. United Kingdom Torque Vectoring Market Size and Forecast, by EV Type (2023-2030) 5.5.2. France 5.5.2.1. France Torque Vectoring Market Size and Forecast, by Vehicle Type (2023-2030) 5.5.2.2. France Torque Vectoring Market Size and Forecast, by Propulsion (2023-2030) 5.5.2.3. France Torque Vectoring Market Size and Forecast, by Clutch Actuation Type (2023-2030) 5.5.2.4. France Torque Vectoring Market Size and Forecast, by EV Type (2023-2030) 5.5.3. Germany 5.5.3.1. Germany Torque Vectoring Market Size and Forecast, by Vehicle Type (2023-2030) 5.5.3.2. Germany Torque Vectoring Market Size and Forecast, by Propulsion (2023-2030) 5.5.3.3. Germany Torque Vectoring Market Size and Forecast, by Clutch Actuation Type (2023-2030) 5.5.3.4. Germany Torque Vectoring Market Size and Forecast, by EV Type (2023-2030) 5.5.4. Italy 5.5.4.1. Italy Torque Vectoring Market Size and Forecast, by Vehicle Type (2023-2030) 5.5.4.2. Italy Torque Vectoring Market Size and Forecast, by Propulsion (2023-2030) 5.5.4.3. Italy Torque Vectoring Market Size and Forecast, by Clutch Actuation Type (2023-2030) 5.5.4.4. Italy Torque Vectoring Market Size and Forecast, by EV Type (2023-2030) 5.5.5. Spain 5.5.5.1. Spain Torque Vectoring Market Size and Forecast, by Vehicle Type (2023-2030) 5.5.5.2. Spain Torque Vectoring Market Size and Forecast, by Propulsion (2023-2030) 5.5.5.3. Spain Torque Vectoring Market Size and Forecast, by Clutch Actuation Type (2023-2030) 5.5.5.4. Spain Torque Vectoring Market Size and Forecast, by EV Type (2023-2030) 5.5.6. Sweden 5.5.6.1. Sweden Torque Vectoring Market Size and Forecast, by Vehicle Type (2023-2030) 5.5.6.2. Sweden Torque Vectoring Market Size and Forecast, by Propulsion (2023-2030) 5.5.6.3. Sweden Torque Vectoring Market Size and Forecast, by Clutch Actuation Type (2023-2030) 5.5.6.4. Sweden Torque Vectoring Market Size and Forecast, by EV Type (2023-2030) 5.5.7. Austria 5.5.7.1. Austria Torque Vectoring Market Size and Forecast, by Vehicle Type (2023-2030) 5.5.7.2. Austria Torque Vectoring Market Size and Forecast, by Propulsion (2023-2030) 5.5.7.3. Austria Torque Vectoring Market Size and Forecast, by Clutch Actuation Type (2023-2030) 5.5.7.4. Austria Torque Vectoring Market Size and Forecast, by EV Type (2023-2030) 5.5.8. Rest of Europe 5.5.8.1. Rest of Europe Torque Vectoring Market Size and Forecast, by Vehicle Type (2023-2030) 5.5.8.2. Rest of Europe Torque Vectoring Market Size and Forecast, by Propulsion (2023-2030) 5.5.8.3. Rest of Europe Torque Vectoring Market Size and Forecast, by Clutch Actuation Type (2023-2030) 5.5.8.4. Rest of Europe Torque Vectoring Market Size and Forecast, by EV Type (2023-2030) 6. Asia Pacific Torque Vectoring Market Size and Forecast by Segmentation (by Value in USD Million) 2023-2030 6.1. Asia Pacific Torque Vectoring Market Size and Forecast, by Vehicle Type (2023-2030) 6.2. Asia Pacific Torque Vectoring Market Size and Forecast, by Propulsion (2023-2030) 6.3. Asia Pacific Torque Vectoring Market Size and Forecast, by Clutch Actuation Type (2023-2030) 6.4. Asia Pacific Torque Vectoring Market Size and Forecast, by EV Type (2023-2030) 6.5. Asia Pacific Torque Vectoring Market Size and Forecast, by Country (2023-2030) 6.5.1. China 6.5.1.1. China Torque Vectoring Market Size and Forecast, by Vehicle Type (2023-2030) 6.5.1.2. China Torque Vectoring Market Size and Forecast, by Propulsion (2023-2030) 6.5.1.3. China Torque Vectoring Market Size and Forecast, by Clutch Actuation Type (2023-2030) 6.5.1.4. China Torque Vectoring Market Size and Forecast, by EV Type (2023-2030) 6.5.2. S Korea 6.5.2.1. S Korea Torque Vectoring Market Size and Forecast, by Vehicle Type (2023-2030) 6.5.2.2. S Korea Torque Vectoring Market Size and Forecast, by Propulsion (2023-2030) 6.5.2.3. S Korea Torque Vectoring Market Size and Forecast, by Clutch Actuation Type (2023-2030) 6.5.2.4. S Korea Torque Vectoring Market Size and Forecast, by EV Type (2023-2030) 6.5.3. Japan 6.5.3.1. Japan Torque Vectoring Market Size and Forecast, by Vehicle Type (2023-2030) 6.5.3.2. Japan Torque Vectoring Market Size and Forecast, by Propulsion (2023-2030) 6.5.3.3. Japan Torque Vectoring Market Size and Forecast, by Clutch Actuation Type (2023-2030) 6.5.3.4. Japan Torque Vectoring Market Size and Forecast, by EV Type (2023-2030) 6.5.4. India 6.5.4.1. India Torque Vectoring Market Size and Forecast, by Vehicle Type (2023-2030) 6.5.4.2. India Torque Vectoring Market Size and Forecast, by Propulsion (2023-2030) 6.5.4.3. India Torque Vectoring Market Size and Forecast, by Clutch Actuation Type (2023-2030) 6.5.4.4. India Torque Vectoring Market Size and Forecast, by EV Type (2023-2030) 6.5.5. Australia 6.5.5.1. Australia Torque Vectoring Market Size and Forecast, by Vehicle Type (2023-2030) 6.5.5.2. Australia Torque Vectoring Market Size and Forecast, by Propulsion (2023-2030) 6.5.5.3. Australia Torque Vectoring Market Size and Forecast, by Clutch Actuation Type (2023-2030) 6.5.5.4. Australia Torque Vectoring Market Size and Forecast, by EV Type (2023-2030) 6.5.6. Indonesia 6.5.6.1. Indonesia Torque Vectoring Market Size and Forecast, by Vehicle Type (2023-2030) 6.5.6.2. Indonesia Torque Vectoring Market Size and Forecast, by Propulsion (2023-2030) 6.5.6.3. Indonesia Torque Vectoring Market Size and Forecast, by Clutch Actuation Type (2023-2030) 6.5.6.4. Indonesia Torque Vectoring Market Size and Forecast, by EV Type (2023-2030) 6.5.7. Malaysia 6.5.7.1. Malaysia Torque Vectoring Market Size and Forecast, by Vehicle Type (2023-2030) 6.5.7.2. Malaysia Torque Vectoring Market Size and Forecast, by Propulsion (2023-2030) 6.5.7.3. Malaysia Torque Vectoring Market Size and Forecast, by Clutch Actuation Type (2023-2030) 6.5.7.4. Malaysia Torque Vectoring Market Size and Forecast, by EV Type (2023-2030) 6.5.8. Vietnam 6.5.8.1. Vietnam Torque Vectoring Market Size and Forecast, by Vehicle Type (2023-2030) 6.5.8.2. Vietnam Torque Vectoring Market Size and Forecast, by Propulsion (2023-2030) 6.5.8.3. Vietnam Torque Vectoring Market Size and Forecast, by Clutch Actuation Type (2023-2030) 6.5.8.4. Vietnam Torque Vectoring Market Size and Forecast, by EV Type (2023-2030) 6.5.9. Taiwan 6.5.9.1. Taiwan Torque Vectoring Market Size and Forecast, by Vehicle Type (2023-2030) 6.5.9.2. Taiwan Torque Vectoring Market Size and Forecast, by Propulsion (2023-2030) 6.5.9.3. Taiwan Torque Vectoring Market Size and Forecast, by Clutch Actuation Type (2023-2030) 6.5.9.4. Taiwan Torque Vectoring Market Size and Forecast, by EV Type (2023-2030) 6.5.10. Rest of Asia Pacific 6.5.10.1. Rest of Asia Pacific Torque Vectoring Market Size and Forecast, by Vehicle Type (2023-2030) 6.5.10.2. Rest of Asia Pacific Torque Vectoring Market Size and Forecast, by Propulsion (2023-2030) 6.5.10.3. Rest of Asia Pacific Torque Vectoring Market Size and Forecast, by Clutch Actuation Type (2023-2030) 6.5.10.4. Rest of Asia Pacific Torque Vectoring Market Size and Forecast, by EV Type (2023-2030) 7. Middle East and Africa Torque Vectoring Market Size and Forecast by Segmentation (by Value in USD Million) 2023-2030 7.1. Middle East and Africa Torque Vectoring Market Size and Forecast, by Vehicle Type (2023-2030) 7.2. Middle East and Africa Torque Vectoring Market Size and Forecast, by Propulsion (2023-2030) 7.3. Middle East and Africa Torque Vectoring Market Size and Forecast, by Clutch Actuation Type (2023-2030) 7.4. Middle East and Africa Torque Vectoring Market Size and Forecast, by EV Type (2023-2030) 7.5. Middle East and Africa Torque Vectoring Market Size and Forecast, by Country (2023-2030) 7.5.1. South Africa 7.5.1.1. South Africa Torque Vectoring Market Size and Forecast, by Vehicle Type (2023-2030) 7.5.1.2. South Africa Torque Vectoring Market Size and Forecast, by Propulsion (2023-2030) 7.5.1.3. South Africa Torque Vectoring Market Size and Forecast, by Clutch Actuation Type (2023-2030) 7.5.1.4. South Africa Torque Vectoring Market Size and Forecast, by EV Type (2023-2030) 7.5.2. GCC 7.5.2.1. GCC Torque Vectoring Market Size and Forecast, by Vehicle Type (2023-2030) 7.5.2.2. GCC Torque Vectoring Market Size and Forecast, by Propulsion (2023-2030) 7.5.2.3. GCC Torque Vectoring Market Size and Forecast, by Clutch Actuation Type (2023-2030) 7.5.2.4. GCC Torque Vectoring Market Size and Forecast, by EV Type (2023-2030) 7.5.3. Nigeria 7.5.3.1. Nigeria Torque Vectoring Market Size and Forecast, by Vehicle Type (2023-2030) 7.5.3.2. Nigeria Torque Vectoring Market Size and Forecast, by Propulsion (2023-2030) 7.5.3.3. Nigeria Torque Vectoring Market Size and Forecast, by Clutch Actuation Type (2023-2030) 7.5.3.4. Nigeria Torque Vectoring Market Size and Forecast, by EV Type (2023-2030) 7.5.4. Rest of ME&A 7.5.4.1. Rest of ME&A Torque Vectoring Market Size and Forecast, by Vehicle Type (2023-2030) 7.5.4.2. Rest of ME&A Torque Vectoring Market Size and Forecast, by Propulsion (2023-2030) 7.5.4.3. Rest of ME&A Torque Vectoring Market Size and Forecast, by Clutch Actuation Type (2023-2030) 7.5.4.4. Rest of ME&A Torque Vectoring Market Size and Forecast, by EV Type (2023-2030) 8. South America Torque Vectoring Market Size and Forecast by Segmentation (by Value in USD Million) 2023-2030 8.1. South America Torque Vectoring Market Size and Forecast, by Vehicle Type (2023-2030) 8.2. South America Torque Vectoring Market Size and Forecast, by Propulsion (2023-2030) 8.3. South America Torque Vectoring Market Size and Forecast, by Clutch Actuation Type(2023-2030) 8.4. South America Torque Vectoring Market Size and Forecast, by EV Type (2023-2030) 8.5. South America Torque Vectoring Market Size and Forecast, by Country (2023-2030) 8.5.1. Brazil 8.5.1.1. Brazil Torque Vectoring Market Size and Forecast, by Vehicle Type (2023-2030) 8.5.1.2. Brazil Torque Vectoring Market Size and Forecast, by Propulsion (2023-2030) 8.5.1.3. Brazil Torque Vectoring Market Size and Forecast, by Clutch Actuation Type (2023-2030) 8.5.1.4. Brazil Torque Vectoring Market Size and Forecast, by EV Type (2023-2030) 8.5.2. Argentina 8.5.2.1. Argentina Torque Vectoring Market Size and Forecast, by Vehicle Type (2023-2030) 8.5.2.2. Argentina Torque Vectoring Market Size and Forecast, by Propulsion (2023-2030) 8.5.2.3. Argentina Torque Vectoring Market Size and Forecast, by Clutch Actuation Type (2023-2030) 8.5.2.4. Argentina Torque Vectoring Market Size and Forecast, by EV Type (2023-2030) 8.5.3. Rest Of South America 8.5.3.1. Rest Of South America Torque Vectoring Market Size and Forecast, by Vehicle Type (2023-2030) 8.5.3.2. Rest Of South America Torque Vectoring Market Size and Forecast, by Propulsion (2023-2030) 8.5.3.3. Rest Of South America Torque Vectoring Market Size and Forecast, by Clutch Actuation Type (2023-2030) 8.5.3.4. Rest Of South America Torque Vectoring Market Size and Forecast, by EV Type (2023-2030) 9. Global Torque Vectoring Market: Competitive Landscape 9.1. MMR Competition Matrix 9.2. Competitive Landscape 9.3. Key Players Benchmarking 9.3.1. Company Name 9.3.2. Business Segment 9.3.3. End-user Segment 9.3.4. Revenue (2022) 9.3.5. Company Locations 9.4. Leading Torque Vectoring Market Companies, by market capitalization 9.5. Market Structure 9.5.1. Market Leaders 9.5.2. Market Followers 9.5.3. Emerging Players 9.6. Mergers and Acquisitions Details 10. Company Profile: Key Players 10.1. JTEKT Corporation 10.1.1. Company Overview 10.1.2. Business Portfolio 10.1.3. Financial Overview 10.1.4. SWOT Analysis 10.1.5. Strategic Analysis 10.1.6. Scale of Operation (small, medium, and large) 10.1.7. Details on Partnership 10.1.8. Regulatory Accreditations and Certifications Received by Them 10.1.9. Awards Received by the Firm 10.1.10. Recent Developments 10.2. Continental AG 10.3. GKN plc 10.4. BorgWarner Inc. 10.5. Schaeffler AG 10.6. ZF Friedrichshafen AG 10.7. Eaton Corporation 10.8. Magna International Inc. 10.9. Mitsubishi Electric Corporation 10.10. Dana Incorporated 10.11. American Axle & Manufacturing Holdings, Inc. 10.12. Robert Bosch GmbH 10.13. AVL List GmbH 10.14. Ricardo plc 10.15. Oerlikon Graziano 10.16. Infineon Technologies AG 10.17. Timken 11. Key Findings 12. Industry Recommendations 13. Torque Vectoring Market: Research Methodology 14. Terms and Glossary
  • INQUIRE BEFORE BUYING