
Sports Graphics Market Size – Industry Structure Evaluation, Demand Drivers Analysis, Regional Growth Analysis and Identification, Competitive Positioning Review & Global Market Size Forecast to 2029
Overview
Sports Graphics Market was valued at US$ 2.64 Bn. in 2022. The Global Sports Graphics Market size is estimated to grow at a CAGR of 6.21% over the forecast period.
Sports Graphics Market Overview:
Graphic design is a kind of design created by a graphic designer and utilized by companies to create visually appealing marketing materials. It can include, for example, business cards, brochures, websites, and stationery. It is utilized to convey any message aesthetically and creatively, allowing businesses to effectively communicate with their target audiences.
The report explores the Sports Graphics market and its segments (Product, End-User, and Region). Data has been provided by market participants and regions (North America, Asia Pacific, Europe, Middle East & Africa, and South America). This market report provides a thorough analysis of the rapid advances that are currently taking place across all industry sectors. Facts and figures, illustrations, and presentations are used to provide key data analysis for the historical period from 2017 to 2021. The report investigates the Sports Graphics market's drivers, limitations, prospects, and barriers. This MMR report includes investor recommendations based on a thorough examination of the Sports Graphics market's contemporary competitive scenario.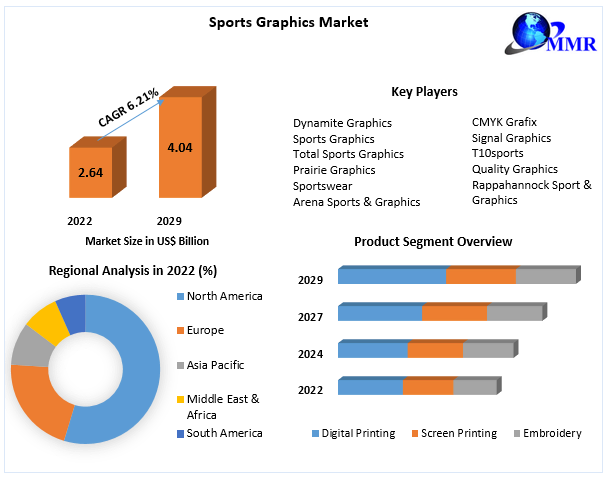 To know about the Research Methodology:-Request Free Sample Report
Market Dynamics:
The rising focus on fitness and a healthy lifestyle is a key factor driving market growth, as is the rising adoption of athleisure fashion trends due to technological advancements. The rising popularity of winter sports in developing economies, as well as the rising number of participants in winter sports from both advanced and emerging economies, are some of the other major factors driving the sports graphics market. Also, during the forecast period, rising technological advancement and modernization in graphics techniques increased market research and development activities, and rising demand from emerging nations will all generate new chances for the sports graphics market.
However, graphic design takes a lot of time, which is one of the primary factors limiting market expansion and will continue to pose a hurdle to the growth of the sports graphics market in the forecast period.
Sports Graphics Market Trends:
Although, other services in the Indian sports graphics industry, such as 3D services and web design, are expected to rise at a significant rate. Urbanization is credited with driving worldwide population rise. Rapid urbanization and e-literacy among India's general people have resulted in a rise in mobile phone, computer, and other networking device adoption. Also, easy market entrance prospects and the requirement of a little market investment have boosted new entrant penetration rates. Web-enabled services and web-based apps are heavily used by small and medium-sized enterprises (SMBs) to promote and operate their businesses. Similarly, the continued rise of e-commerce and m-commerce sites like Amazon.com, Inc. and Flipkart Online Services Pvt. Ltd. is expected to support the growth of online and digital services in India, which would have a positive impact on the sports graphics market.
Sports Graphics Market Segment Analysis:
Based on Product:
Digital printing services segment dominated the market with more than 40% in 2022. It increases at the fastest rate in the Indian sports graphics industry. Rapid urban population growth and rising disposable income of middle- and high-income consumers have resulted in high demand for numerous consumer items. In addition, since the number of dying and printing technicians in factories has decreased, the rate of digital printing machine use has increased in India. Also, benefits such as quick turnaround, high flexibility, and originality contribute to the digital printing market's growth. Also, as compared to its conventional equivalent, digital printing is a more environmentally responsible procedure. It reduces ink/dye consumption by 20%-40%, water consumption by 40%-60%, and energy consumption by 50%.
Based on End User:
In the sports graphics market, the most revenue was made from Promotional products segment. On the other hand, Promotional products are expected to increase at the fastest rate throughout the forecast period. Promotional merchandise distributor businesses, often known as promotional consultants or promotional product distributors, are generally used by event organizers or hosting organizations to order products. USB drives, outerwear, drinkware, writing instruments, and performance clothing are among the most influential promotional products. Other sub-segments of end-users are sports apparel & accessories.
Regional Insights:
North America and Europe dominated the sports graphics market share with more than 50% in 2022. Due to rising consumer spending on sports goods and growing health awareness among people in this region. In addition, Asia-Pacific is the expected to grow rapidly in the market due to increasing disposable income and consumer spending across emerging markets such as India, China, and the Middle Eastern countries and rising adoption of athleisure fashion trends due to advancement of technology in this region.
The objective of the report is to present a comprehensive analysis of the global Sports Graphics Market to the stakeholders in the industry. The past and current status of the industry with the forecasted market size and trends are presented in the report with the analysis of complicated data in simple language. The report covers all the aspects of the industry with a dedicated study of key players that include market leaders, followers, and new entrants.
PORTER, PESTEL analysis with the potential impact of micro-economic factors of the market have been presented in the report. External as well as internal factors that are supposed to affect the business positively or negatively have been analyzed, which will give a clear, futuristic view of the industry to the decision-makers.
The reports also help in understanding the Sports Graphics Market dynamic and structure by analyzing the market segments and projecting the market size. Clear representation of competitive analysis of key players by Design, price, financial position, product portfolio, growth strategies, and regional presence in the market make the report investor’s guide.
Sports Graphics Market Scope: Inquire before buying
| Global Sports Graphics Market Market | |||
|---|---|---|---|
| Report Coverage | Details | ||
| Base Year: | 2022 | Forecast Period: | 2023-2029 |
| Historical Data: | 2018 to 2022 | Market Size in 2022: | US $ 2.64 Bn. |
| Forecast Period 2023 to 2029 CAGR: | 6.21% | Market Size in 2029: | US $ 4.04 Bn. |
| Segments Covered: | by Product | Digital Printing Screen Printing Embroidery |
|
| by End Users | Promotional Products Sports Apparel Accessories |
||
Sports Graphics Market, by Region
North America (United States, Canada and Mexico)
Europe (UK, France, Germany, Italy, Spain, Sweden, Austria and Rest of Europe)
Asia Pacific (China, South Korea, Japan, India, Australia, Indonesia, Malaysia, Vietnam, Taiwan, Bangladesh, Pakistan and Rest of APAC)
Middle East and Africa (South Africa, GCC, Egypt, Nigeria and Rest of ME&A)
South America (Brazil, Argentina Rest of South America)
Sports Graphics Market Key Players are:
1. Dynamite Graphics
2. Sports Graphics
3. Total Sports Graphics
4. Prairie Graphics Sportswear
5. Arena Sports & Graphics
6. CMYK Grafix
7. Signal Graphics
8. T10sports
9. Quality Graphics
10.Rappahannock Sport & Graphics
11.VizCom Sport Graphics
Frequently Asked Questions :
1) What segments are covered in the Sports Graphics Market report?
Ans: The segments covered in the market reports are based on the Product & End User.
2) Which region is expected to hold the highest share in the Sports Graphics Market?
Ans: Asia- Pacific is expected to hold the highest share in the market.
3) What is the market size of the Sports Graphics Market by 2029?
Ans: The market size of the market by 2029 is expected to reach nearly US$ 4.04 Bn.
4) What is the forecast period for the Sports Graphics Market?
Ans: The forecast period for the market is 2023-2029.
5) What was the market size of the Sports Graphics Market in 2022?
Ans: The market size of the market in 2022 was valued at US$ 2.64 Bn.