Smart Dust Market: Global Industry Analysis and Forecast (2023-2029)

The Global Smart Dust Market size was valued at USD 139.8 Mn in 2022 and the market is expected to reach USD 350 Mn by 2029 at a CAGR of 14 % during the forecast period.

Smart Dust Market Overview

Smart dust refers to tiny, wireless sensors that can be scattered or embedded to collect and transmit data from the surrounding environment. These sensors are often used in various applications, including environmental monitoring, healthcare, industrial automation, and defence. Growing middle-class populations in emerging markets like India and Brazil present numerous opportunities for major companies to broaden their supply chains and venture into new markets. The use of technological development for the production and development of new products by companies using Data analytics provides valuable insights into consumer behavior, the Smart Dust Market trends in the local regional market and increases the sales performance of the company in that region. The Smart Dust manufacturer helps the data-driven company to improve product development, change marketing strategy, and grow distribution channels.Smart Dust Market
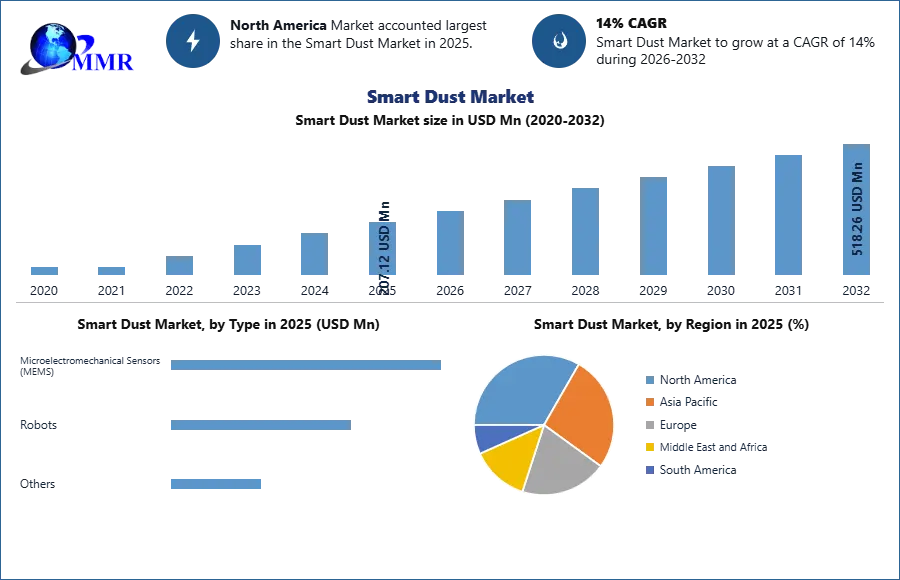
To know about the Research Methodology :- Request Free Sample Report

Smart Dust Market Dynamics

Increasing demand for data Technological advancement has made the world more interconnected to the world and more data-driven. These smart dust devices can collect data from a wide range and variety of sources. This data collected can be used to improve the overall efficiency and for making proper decisions, which has led to the use of more sensors and is driving the demand of the smart dust market. Industries such as healthcare, manufacturing, and agriculture use this sensor for monitoring and gathering real-time data while providing solutions at the same time. The demand for smart dust devices is expected to increase as more applications are developed, including environmental monitoring, healthcare monitoring, industrial automation, and security. The continuous reduction in the size of electronic components enables the creation of smaller and less conspicuous smart dust devices. The government has recognized the potential of using smart dust technologies to improve safety and promote economic growth. Rising privacy concerns by use of Smart dust devices Smart dust devices possess the ability to collect a significant volume of data concerning individuals and their surroundings, giving rise to privacy concerns. There is fear that people may be unwilling to have their personal information gathered and stored. Moreover, there is a worry that smart dust devices might be utilized to track individuals without their awareness or consent. Another point of weakness is the exposure of smart dust devices to cyber-attacks. If these devices are compromised, there is a risk of data theft, operational disruptions, or even potential harm. Before the complete development and deployment of smart dust devices, various technical challenges must be addressed. These challenges encompass the creation of miniature sensors and power sources, along with the development of communication technologies that enable smart dust devices to communicate effectively over long distances and in challenging environments.Smart Dust Market1Rising opportunities in Environmental concern and healthcare monitoring Smart dust devices are capable of effectively monitoring the environment for a diverse range of pollutants, encompassing air pollution, water pollution, and soil pollution. This data is essential for recognizing environmental challenges and formulating plans to safeguard the environment. Additionally, these devices can be used in monitoring the heart patient condition, and blood pressure. Using this information enables the early detection of heart concerns and making sure the safety is reached within time. In terms of security, smart dust devices can be deployed to monitor buildings and other areas for potential threats, such as unauthorized activity and potential intruders, enhancing security measures and deterring crime. Additionally, these devices find application in monitoring energy consumption, enabling the identification of opportunities for energy conservation. This data, in turn, contributes to reducing energy costs and fostering sustainability. Rising technical challenges in the Smart Dust Market Several technical hurdles must be overcome before smart dust devices can reach their full potential. These hurdles include the development of miniature sensors and power sources, as well as communication technologies that enable smart dust devices to exchange information over long distances and in challenging environments. Smart dust devices remain relatively costly, potentially limiting their applicability in certain scenarios. Deploying smart dust devices on a large scale poses a significant challenge. The devices would need to communicate seamlessly with one another and a central network, while the vast amount of data they collect would necessitate efficient management and analysis. Many individuals are unfamiliar with smart dust technology and its potential applications. This could hinder the generation of demand for smart dust devices. Public acceptance of smart dust technology may be hindered by concerns about the presence of tiny devices embedded in the surrounding environment.

Smart Dust Market Segment Analysis

Based on Type, the microelectromechanical sensor in the smart dust industry acquired a dominant share in the global market in 2022. The demand for this sensor is increasing in a variety of uses in industries such as healthcare, electronics, and automotive. This use and rising production of microelectromechanical sensors has raised the demand and the increasing production has led to reducing the prices thus making them more affordable. The advancement in the manufacturing technologies for MEMs has made it possible for companies to make more small, and energy-efficient sensors. This technological advancement in microelectrochemical sensors has made them used in a wide range of applications used in industrial users for providing data for machinery health. For sustainable development, with the help of technological advancement, the integration of sensors in small single chips has been made possible and can collect more data than a single device. The use of smart dust in robots was the second largest dominating segment globally in 2022. The increasing demand for robots in the use of security applications in public places such as airports, train stations, and other public places. The rise in the use of robots for industrial purposes and other applications has made robots cheaper and more affordable.Smart Dust Market2Based on End Use, the use of smart dust in various industries with different applications is due to the affordability and efficiency provided by these smart sensors. BFSI sector has made use of more smart dust technologies for fraud detection, and risk management. Smart dust is used for tracking the payment by use of microelectrochemical sensor systems. These sensors collect the data and use and transfer it to the base main devices. In addition to this, the use of smart dust in other industries such as healthcare for the sole purpose of patient monitoring and drug delivery systems. The patient monitoring systems use smart dust for tracking the health of cardiac patients by using smart chips placed in the hearts of patients. Moreover, the telecommunication and information technology industry has made use of smart dust devices and chips for smart integration, network optimization, and the making of more smart cities. This smart dust technology is used in the Internet of Things for sending, through wifi or cellular networks to transmit data. Due to this use, many small-size sensors are manufactured and deployed to cover a large area for communication.Smart Dust Market3

Smart Dust Market Regional Analysis

North American region, held the largest market share in 2022. The strong demand for smart dust devices such as sensors, and chips in industrial sectors like defense, healthcare, and information technology. The rising demand for smart dust for data collection from a wide range of sources is driving the need for a North America smart dust market. The decreasing number of computing devices and the need for increased connectivity in the physical world raises the popularity of smart dust market computing devices. The several application versatility for the smart dust technology, with these advancements, will lead to more uses in industries will emerge. This advancement and increasing number of companies has led to the manufacturing of smart sensors, which has simultaneously decreased the cost of sensors in the market. The reduction in the cost of production of sensors has led to more affordability to use for a wide range of purposes. With the strong US support and investment in the development of smart dust technologies, the innovation has helped in reducing the cost of smart dust devices. The United States held the largest market share in 2022. The rising development of new communication technologies is seen to drive the smart dust market growth for better and more efficient communication over a longer distance.Smart Dust Market4Europe region has a large demand for the Smart Dust thanks to the growing smart cities and agriculture sector. The need for smart dust systems for monitoring the air quality, released from industrial areas, and for measuring the water and soil quality needed for maintaining health and safe drinking water for the population. This use of smart dust technologies is helping to improve the environmental condition and reduce the impact on the environment. Government support for making use of more smart dust technologies for the development of smart cities. The application of smart dust in the smart city for smart parking, traffic management, and waste management will help the urban areas improve overall efficiency and make them more sustainable for living. The European government supports more use of smart dust technologies by investing heavily in the development of more advanced technologies.Smart Dust Market5

Competitive Landscape

The Smart Dust market is dominated by numerous medium-sized and large-sized players operating in different countries. These players are focused on technological development and new product launching in the market. Consumers in the regions are increasingly drawn towards smart applications and the use of more smart devices in their daily lives. Leading companies such as IBM are raising the process of miniaturization, which has resulted in the creation of smart dust devices that are smaller and more potent than ever. This breakthrough enables the deployment of smart dust devices in a broader array of applications, including environmental monitoring and healthcare. On the other hand, Hitachi's strides in communication technologies have led to the development of smart dust devices with the capability to communicate across greater distances and endure harsher environments. This expansion allows for the deployment of smart dust devices in more challenging settings, such as industrial environments and disaster zones. The competition within the smart dust industry is rising as other companies like BetaBatt, Smartdust, and Crossbow Technology are also making significant strides in advancing this technology.

Smart Dust Market Scope: Inquiry Before Buying

Smart Dust Market
Report Coverage Details
Base Year: 2022 Forecast Period: 2023-2029
Historical Data: 2018 to 2022 Market Size in 2022: US $ 139.8 Mn.
Forecast Period 2023 to 2029 CAGR: 14% Market Size in 2029: US $ 350 Mn.
Segments Covered: by Type Microelectromechanical sensors Robots Others
by Component Sensors Active Optical Transmission Passive Optical Transmission Battery Analog I/O Signal Processing Control Circuitry
by End-Use BFSI Healthcare & Life Science Telecommunication & IT Government & Public Sector Manufacturing Others

Smart Dust Market by Region

North America (United States, Canada, and Mexico) Europe (UK, France, Germany, Italy, Spain, Sweden, Austria, and Rest of Europe) Asia Pacific (China, South Korea, Japan, India, Australia, Indonesia, Malaysia, Vietnam, Taiwan, Bangladesh, Pakistan, and Rest of APAC) Middle East and Africa (South Africa, GCC, Egypt, Nigeria, and Rest of ME&A) South America (Brazil, Argentina Rest of South America)

Key Players in the Smart Dust Market

1. Valarm LLC 2. Smartdust Solutions Ltd. 3. Hitachi Ltd. 4. Cleverciti Systems GmbH 5. IBM Corporation 6. Defendec Inc. 7. Epic Semiconductors Inc. 8. Civic Smart Inc. 9. BetaBatt Inc. 10. Moog Inc (Crossbow Technology, Inc.) 11. International Business Machines 12. White Labs 13. Sonardyne International Ltd 14. SINTEF 15. Lightricity Ltd 16. CubeWorks 17. General Electric

FAQs:

1. What are the benefits of the Smart Dust? Ans. Convenience, availability in a full-year period, nutritional health benefits, and a wide variety of products and flavors. 2. What is the major restraint for the Smart Dust market growth? Ans. Strong Competition and potential health concern for the lactose-intolerant consumer base is expected to be the major restraining factor for the Smart Dust market growth. 3. Are the Smart Dust products as healthy as fresh fruit? Ans. Frozen fruits retain and maintain a remarkable level of their essential nutritional value with a majority of vitamins, minerals, and fiber. 4. What is the projected market size & and growth rate of the Smart Dust Market? Ans. The Smart Dust Market size was valued at USD 139 Million in 2022 and the total Smart Dust revenue is expected to grow at a CAGR of 14% from 2023 to 2029, reaching nearly USD 350 Million by 2029. 5. What are the key challenges in the Smart Dust Market? Ans. The key challenges are rising production costs, increased competition, changing consumer preferences, and less availability of storage facilities.
1. Smart Dust Market Introduction 1.1. Study Assumption and Market Definition 1.2. Scope of the Study 1.3. Executive Summary 2. Smart Dust Market: Dynamics 2.1. Smart Dust Market Trends by Region 2.1.1. North America Smart Dust Market Trends 2.1.2. Europe Smart Dust Market Trends 2.1.3. Asia Pacific Smart Dust Market Trends 2.1.4. Middle East and Africa Smart Dust Market Trends 2.1.5. South America Smart Dust Market Trends 2.2. Smart Dust Market Dynamics by Region 2.2.1. North America 2.2.1.1. North America Smart Dust Market Drivers 2.2.1.2. North America Smart Dust Market Restraints 2.2.1.3. North America Smart Dust Market Opportunities 2.2.1.4. North America Smart Dust Market Challenges 2.2.2. Europe 2.2.2.1. Europe Smart Dust Market Drivers 2.2.2.2. Europe Smart Dust Market Restraints 2.2.2.3. Europe Smart Dust Market Opportunities 2.2.2.4. Europe Smart Dust Market Challenges 2.2.3. Asia Pacific 2.2.3.1. Asia Pacific Smart Dust Market Drivers 2.2.3.2. Asia Pacific Smart Dust Market Restraints 2.2.3.3. Asia Pacific Smart Dust Market Opportunities 2.2.3.4. Asia Pacific Smart Dust Market Challenges 2.2.4. Middle East and Africa 2.2.4.1. Middle East and Africa Smart Dust Market Drivers 2.2.4.2. Middle East and Africa Smart Dust Market Restraints 2.2.4.3. Middle East and Africa Smart Dust Market Opportunities 2.2.4.4. Middle East and Africa Smart Dust Market Challenges 2.2.5. South America 2.2.5.1. South America Smart Dust Market Drivers 2.2.5.2. South America Smart Dust Market Restraints 2.2.5.3. South America Smart Dust Market Opportunities 2.2.5.4. South America Smart Dust Market Challenges 2.3. PORTER’s Five Forces Analysis 2.4. PESTLE Analysis 2.5. Regulatory Landscape by Region 2.5.1. Global 2.5.2. North America 2.5.3. Europe 2.5.4. Asia Pacific 2.5.5. Middle East and Africa 2.5.6. South America 2.6. Key Opinion Leader Analysis For the Smart Dust Industry 2.7. Analysis of Government Schemes and Initiatives For the Smart Dust Industry 2.8. The Global Pandemic Impact on the Smart Dust Market 2.9. Global Smart Dust Market Trade Analysis (2017-2022) 2.9.1. Global Import of Display Panel 2.9.1.1. Ten Largest Importer 2.9.2. Global Export of Display Panel 2.9.3. Ten Largest Exporter 2.10. Production Capacity Analysis 2.10.1. Chapter Overview 2.10.2. Key Assumptions and Methodology 2.10.3. Smart Dust Manufacturers: Global Installed Capacity 3. Smart Dust Market: Global Market Size and Forecast by Segmentation (by Value and Volume) (2022-2029) 3.1. Smart Dust Market Size and Forecast, by Type (2022-2029) 3.1.1. Microelectromechanical sensors 3.1.2. Robots 3.1.3. Others 3.2. Smart Dust Market Size and Forecast, by Component (2022-2029) 3.2.1. Sensors 3.2.2. Active Optical Transmission 3.2.3. Passive Optical Transmission 3.2.4. Battery 3.2.5. Analog I/O 3.2.6. Signal Processing 3.2.7. Control Circuitry 3.3. Smart Dust Market Size and Forecast, by End Use (2022-2029) 3.3.1. BFSI 3.3.2. Healthcare & Life Science 3.3.3. Telecommunication & IT 3.3.4. Government & Public Sector 3.3.5. Manufacturing 3.3.6. Others 3.4. Smart Dust Market Size and Forecast, by Region (2022-2029) 3.4.1. North America 3.4.2. Europe 3.4.3. Asia Pacific 3.4.4. Middle East and Africa 3.4.5. South America 4. North America Smart Dust Market Size and Forecast by Segmentation (by Value in USD Million) (2022-2029) 4.1. North America Smart Dust Market Size and Forecast, by Type (2022-2029) 4.1.1. Microelectromechanical sensors 4.1.2. Robots 4.1.3. Others 4.2. North America Smart Dust Market Size and Forecast, by Component (2022-2029) 4.2.1. Sensors 4.2.2. Active Optical Transmission 4.2.3. Passive Optical Transmission 4.2.4. Battery 4.2.5. Analog I/O 4.2.6. Signal Processing 4.2.7. Control Circuitry 4.3. North America Smart Dust Market Size and Forecast, by End Use (2022-2029) 4.3.1. BFSI 4.3.2. Healthcare & Life Science 4.3.3. Telecommunication & IT 4.3.4. Government & Public Sector 4.3.5. Manufacturing 4.3.6. Others 4.4. North America Smart Dust Market Size and Forecast, by Country (2022-2029) 4.4.1. United States 4.4.1.1. United States Smart Dust Market Size and Forecast, by Type (2022-2029) 4.4.1.1.1. Microelectromechanical sensors 4.4.1.1.2. Robots 4.4.1.1.3. Others 4.4.1.2. United States Smart Dust Market Size and Forecast, by Component (2022-2029) 4.4.1.2.1. Sensors 4.4.1.2.2. Active Optical Transmission 4.4.1.2.3. Passive Optical Transmission 4.4.1.2.4. Battery 4.4.1.2.5. Analog I/O 4.4.1.2.6. Signal Processing 4.4.1.2.7. Control Circuitry 4.4.1.3. United States Smart Dust Market Size and Forecast, by End Use (2022-2029) 4.4.1.3.1. BFSI 4.4.1.3.2. Healthcare & Life Science 4.4.1.3.3. Telecommunication & IT 4.4.1.3.4. Government & Public Sector 4.4.1.3.5. Manufacturing 4.4.1.3.6. Others 4.4.2. Canada 4.4.2.1. Canada Smart Dust Market Size and Forecast, by Type (2022-2029) 4.4.2.1.1. Microelectromechanical sensors 4.4.2.1.2. Robots 4.4.2.1.3. Others 4.4.2.2. Canada Smart Dust Market Size and Forecast, by Component (2022-2029) 4.4.2.2.1. Sensors 4.4.2.2.2. Active Optical Transmission 4.4.2.2.3. Passive Optical Transmission 4.4.2.2.4. Battery 4.4.2.2.5. Analog I/O 4.4.2.2.6. Signal Processing 4.4.2.2.7. Control Circuitry 4.4.2.3. Canada Smart Dust Market Size and Forecast, by End Use (2022-2029) 4.4.2.3.1. BFSI 4.4.2.3.2. Healthcare & Life Science 4.4.2.3.3. Telecommunication & IT 4.4.2.3.4. Government & Public Sector 4.4.2.3.5. Manufacturing 4.4.2.3.6. Others 4.4.3. Mexico 4.4.3.1. Mexico Smart Dust Market Size and Forecast, by Type (2022-2029) 4.4.3.1.1. Microelectromechanical sensors 4.4.3.1.2. Robots 4.4.3.1.3. Others 4.4.3.2. Mexico Smart Dust Market Size and Forecast, by Component (2022-2029) 4.4.3.2.1. Sensors 4.4.3.2.2. Active Optical Transmission 4.4.3.2.3. Passive Optical Transmission 4.4.3.2.4. Battery 4.4.3.2.5. Analog I/O 4.4.3.2.6. Signal Processing 4.4.3.2.7. Control Circuitry 4.4.3.3. Mexico Smart Dust Market Size and Forecast, by End Use (2022-2029) 4.4.3.3.1. BFSI 4.4.3.3.2. Healthcare & Life Science 4.4.3.3.3. Telecommunication & IT 4.4.3.3.4. Government & Public Sector 4.4.3.3.5. Manufacturing 4.4.3.3.6. Others 5. Europe Smart Dust Market Size and Forecast by Segmentation (by Value in USD Million) (2022-2029) 5.1. Europe Smart Dust Market Size and Forecast, by Type (2022-2029) 5.2. Europe Smart Dust Market Size and Forecast, by Component (2022-2029) 5.3. Europe Smart Dust Market Size and Forecast, by End Use (2022-2029) 5.4. Europe Smart Dust Market Size and Forecast, by Country (2022-2029) 5.4.1. United Kingdom 5.4.1.1. United Kingdom Smart Dust Market Size and Forecast, by Type (2022-2029) 5.4.1.2. United Kingdom Smart Dust Market Size and Forecast, by Component (2022-2029) 5.4.1.3. United Kingdom Smart Dust Market Size and Forecast, by End Use (2022-2029) 5.4.2. France 5.4.2.1. France Smart Dust Market Size and Forecast, by Type (2022-2029) 5.4.2.2. France Smart Dust Market Size and Forecast, by Component (2022-2029) 5.4.2.3. France Smart Dust Market Size and Forecast, by End Use (2022-2029) 5.4.3. Germany 5.4.3.1. Germany Smart Dust Market Size and Forecast, by Type (2022-2029) 5.4.3.2. Germany Smart Dust Market Size and Forecast, by Component (2022-2029) 5.4.3.3. Germany Smart Dust Market Size and Forecast, by End Use (2022-2029) 5.4.4. Italy 5.4.4.1. Italy Smart Dust Market Size and Forecast, by Type (2022-2029) 5.4.4.2. Italy Smart Dust Market Size and Forecast, by Component (2022-2029) 5.4.4.3. Italy Smart Dust Market Size and Forecast, by End Use (2022-2029) 5.4.5. Spain 5.4.5.1. Spain Smart Dust Market Size and Forecast, by Type (2022-2029) 5.4.5.2. Spain Smart Dust Market Size and Forecast, by Component (2022-2029) 5.4.5.3. Spain Smart Dust Market Size and Forecast, by End Use (2022-2029) 5.4.6. Sweden 5.4.6.1. Sweden Smart Dust Market Size and Forecast, by Type (2022-2029) 5.4.6.2. Sweden Smart Dust Market Size and Forecast, by Component (2022-2029) 5.4.6.3. Sweden Smart Dust Market Size and Forecast, by End Use (2022-2029) 5.4.7. Austria 5.4.7.1. Austria Smart Dust Market Size and Forecast, by Type (2022-2029) 5.4.7.2. Austria Smart Dust Market Size and Forecast, by Component (2022-2029) 5.4.7.3. Austria Smart Dust Market Size and Forecast, by End Use (2022-2029) 5.4.8. Rest of Europe 5.4.8.1. Rest of Europe Smart Dust Market Size and Forecast, by Type (2022-2029) 5.4.8.2. Rest of Europe Smart Dust Market Size and Forecast, by Component (2022-2029) 5.4.8.3. Rest of Europe Smart Dust Market Size and Forecast, by End Use (2022-2029) 6. Asia Pacific Smart Dust Market Size and Forecast by Segmentation (by Value in USD Million) (2022-2029) 6.1. Asia Pacific Smart Dust Market Size and Forecast, by Type (2022-2029) 6.2. Asia Pacific Smart Dust Market Size and Forecast, by Component (2022-2029) 6.3. Asia Pacific Smart Dust Market Size and Forecast, by End Use (2022-2029) 6.4. Asia Pacific Smart Dust Market Size and Forecast, by Country (2022-2029) 6.4.1. China 6.4.1.1. China Smart Dust Market Size and Forecast, by Type (2022-2029) 6.4.1.2. China Smart Dust Market Size and Forecast, by Component (2022-2029) 6.4.1.3. China Smart Dust Market Size and Forecast, by End Use (2022-2029) 6.4.2. S Korea 6.4.2.1. S Korea Smart Dust Market Size and Forecast, by Type (2022-2029) 6.4.2.2. S Korea Smart Dust Market Size and Forecast, by Component (2022-2029) 6.4.2.3. S Korea Smart Dust Market Size and Forecast, by End Use (2022-2029) 6.4.3. Japan 6.4.3.1. Japan Smart Dust Market Size and Forecast, by Type (2022-2029) 6.4.3.2. Japan Smart Dust Market Size and Forecast, by Component (2022-2029) 6.4.3.3. Japan Smart Dust Market Size and Forecast, by End Use (2022-2029) 6.4.4. India 6.4.4.1. India Smart Dust Market Size and Forecast, by Type (2022-2029) 6.4.4.2. India Smart Dust Market Size and Forecast, by Component (2022-2029) 6.4.4.3. India Smart Dust Market Size and Forecast, by End Use (2022-2029) 6.4.5. Australia 6.4.5.1. Australia Smart Dust Market Size and Forecast, by Type (2022-2029) 6.4.5.2. Australia Smart Dust Market Size and Forecast, by Component (2022-2029) 6.4.5.3. Australia Smart Dust Market Size and Forecast, by End Use (2022-2029) 6.4.6. Indonesia 6.4.6.1. Indonesia Smart Dust Market Size and Forecast, by Type (2022-2029) 6.4.6.2. Indonesia Smart Dust Market Size and Forecast, by Component (2022-2029) 6.4.6.3. Indonesia Smart Dust Market Size and Forecast, by End Use (2022-2029) 6.4.7. Malaysia 6.4.7.1. Malaysia Smart Dust Market Size and Forecast, by Type (2022-2029) 6.4.7.2. Malaysia Smart Dust Market Size and Forecast, by Component (2022-2029) 6.4.7.3. Malaysia Smart Dust Market Size and Forecast, by End Use (2022-2029) 6.4.8. Vietnam 6.4.8.1. Vietnam Smart Dust Market Size and Forecast, by Type (2022-2029) 6.4.8.2. Vietnam Smart Dust Market Size and Forecast, by Component (2022-2029) 6.4.8.3. Vietnam Smart Dust Market Size and Forecast, by End Use (2022-2029) 6.4.9. Taiwan 6.4.9.1. Taiwan Smart Dust Market Size and Forecast, by Type (2022-2029) 6.4.9.2. Taiwan Smart Dust Market Size and Forecast, by Component (2022-2029) 6.4.9.3. Taiwan Smart Dust Market Size and Forecast, by End Use (2022-2029) 6.4.10. Rest of Asia Pacific 6.4.10.1. Rest of Asia Pacific Smart Dust Market Size and Forecast, by Type (2022-2029) 6.4.10.2. Rest of Asia Pacific Smart Dust Market Size and Forecast, by Component (2022-2029) 6.4.10.3. Rest of Asia Pacific Smart Dust Market Size and Forecast, by End Use(2022-2029) 7. Middle East and Africa Smart Dust Market Size and Forecast by Segmentation (by Value in USD Million) (2022-2029) 7.1. Middle East and Africa Smart Dust Market Size and Forecast, by Type (2022-2029) 7.2. Middle East and Africa Smart Dust Market Size and Forecast, by Component (2022-2029) 7.3. Middle East and Africa Smart Dust Market Size and Forecast, by End Use (2022-2029) 7.4. Middle East and Africa Smart Dust Market Size and Forecast, by Country (2022-2029) 7.4.1. South Africa 7.4.1.1. South Africa Smart Dust Market Size and Forecast, by Type (2022-2029) 7.4.1.2. South Africa Smart Dust Market Size and Forecast, by Component (2022-2029) 7.4.1.3. South Africa Smart Dust Market Size and Forecast, by End Use (2022-2029) 7.4.2. GCC 7.4.2.1. GCC Smart Dust Market Size and Forecast, by Type (2022-2029) 7.4.2.2. GCC Smart Dust Market Size and Forecast, by Component (2022-2029) 7.4.2.3. GCC Smart Dust Market Size and Forecast, by End Use (2022-2029) 7.4.3. Nigeria 7.4.3.1. Nigeria Smart Dust Market Size and Forecast, by Type (2022-2029) 7.4.3.2. Nigeria Smart Dust Market Size and Forecast, by Component (2022-2029) 7.4.3.3. Nigeria Smart Dust Market Size and Forecast, by End Use (2022-2029) 7.4.4. Rest of ME&A 7.4.4.1. Rest of ME&A Smart Dust Market Size and Forecast, by Type (2022-2029) 7.4.4.2. Rest of ME&A Smart Dust Market Size and Forecast, by Component (2022-2029) 7.4.4.3. Rest of ME&A Smart Dust Market Size and Forecast, by End Use (2022-2029) 8. South America Smart Dust Market Size and Forecast by Segmentation (by Value in USD Million) (2022-2029) 8.1. South America Smart Dust Market Size and Forecast, by Type (2022-2029) 8.2. South America Smart Dust Market Size and Forecast, by Component (2022-2029) 8.3. South America Smart Dust Market Size and Forecast, by End Use (2022-2029) 8.4. South America Smart Dust Market Size and Forecast, by Country (2022-2029) 8.4.1. Brazil 8.4.1.1. Brazil Smart Dust Market Size and Forecast, by Type (2022-2029) 8.4.1.2. Brazil Smart Dust Market Size and Forecast, by Component (2022-2029) 8.4.1.3. Brazil Smart Dust Market Size and Forecast, by End Use (2022-2029) 8.4.2. Argentina 8.4.2.1. Argentina Smart Dust Market Size and Forecast, by Type (2022-2029) 8.4.2.2. Argentina Smart Dust Market Size and Forecast, by Component (2022-2029) 8.4.2.3. Argentina Smart Dust Market Size and Forecast, by End Use (2022-2029) 8.4.3. Rest Of South America 8.4.3.1. Rest Of South America Smart Dust Market Size and Forecast, by Type (2022-2029) 8.4.3.2. Rest Of South America Smart Dust Market Size and Forecast, by Component (2022-2029) 8.4.3.3. Rest Of South America Smart Dust Market Size and Forecast, by End Use (2022-2029) 9. Global Smart Dust Market: Competitive Landscape 9.1. MMR Competition Matrix 9.2. Competitive Landscape 9.3. Key Players Benchmarking 9.3.1. Company Name 9.3.2. Product Segment 9.3.3. End-user Segment 9.3.4. Revenue (2022) 9.3.5. Company Locations 9.4. Leading Smart Dust Market Companies, by market capitalization 9.5. Market Structure 9.5.1. Market Leaders 9.5.2. Market Followers 9.5.3. Emerging Players 9.6. Mergers and Acquisitions Details 10. Company Profile: Key Players 10.1. Samsung Electronics Co Ltd (South Korea) 10.1.1. Company Overview 10.1.2. Business Portfolio 10.1.3. Financial Overview 10.1.4. SWOT Analysis 10.1.5. Strategic Analysis 10.1.6. Recent Developments 10.2. Valarm LLC 10.3. Smartdust Solutions Ltd. 10.4. Hitachi Ltd. 10.5. Cleverciti Systems GmbH 10.6. IBM Corporation 10.7. Defendec Inc. 10.8. Epic Semiconductors Inc. 10.9. Civic Smart Inc. 10.10. BetaBatt Inc. 10.11. Moog Inc (Crossbow Technology, Inc.) 10.12. International Business Machines 10.13. White Labs 10.14. Sonardyne International Ltd 10.15. SINTEF 10.16. Lightricity Ltd 10.17. CubeWorks 10.18. General Electric 11. Key Findings 12. Industry Recommendations 13. Smart Dust Market: Research Methodology
  • INQUIRE BEFORE BUYING