Revenue Management Market- Global Industry Analysis and forecast (2023-2029)

Revenue Management Market size was valued US$ 18.02 Bn in 2022 and the total revenue is expected to grow at a CAGR of 9.7% by 2029, reaching US$ 34.45 Bn. COVID-19 impact on market: COVID-19 has the potential to have three major effects on the global economy: directly impacting production and demand, causing supply chain and market disruption, and having a financial impact on businesses and financial markets. Our analysts, who are monitoring the situation throughout the world, believe that the market would provide producers with lucrative opportunities following the COVID-19 dilemma.Revenue Management Market
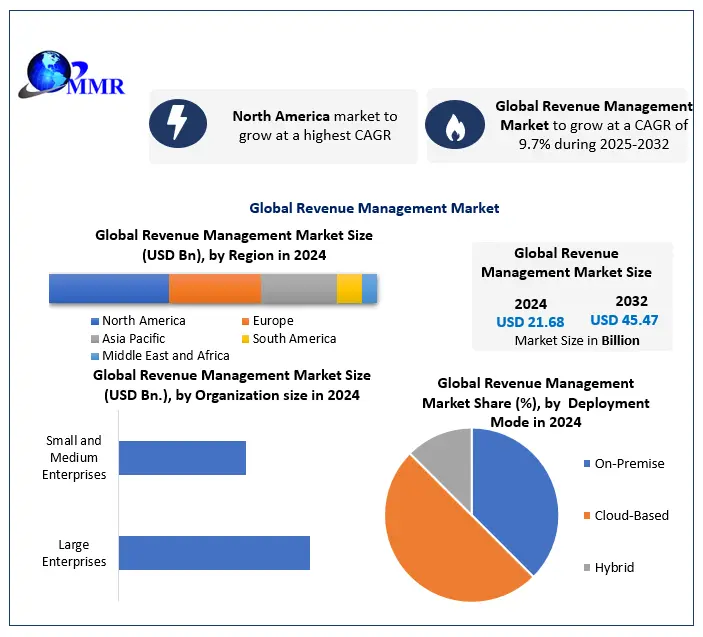
To know about the Research Methodology :- Request Free Sample Report

Revenue Management Market Overview:

Revenue management is a technique of managing the finances of various service industries to extent their profitableness from the prevailing offer networks. It helps in predicting the buyer to demand and to regulate inventory and valuation consequently to maximize overall revenue growth. Revenue management is a comprehensive approach in market for the businesses adopted by the firms to provide numerous edges like management of money flow, generating billing schedules and enhancing revenue cycle.

Increasing focus of key players towards usage of mobile devices:

The increasing attention of key players towards mobile devices usage which is the key factor for the growth of the market. Moreover, smartphone subscriber base is growing at high rate that is anticipated to expand the real-world revenue management market over the approaching years. However, several factors which may act as a major hindrance to the expansion of the global market is cross platform applications etc.

Revenue Management Market Dynamics

Revenue Management Market is driven globally with the increase in client awareness and rise in demand for system integration. Engaging increase in demand for revenue and channel management and upgrading the present inheritance system area unit is expected to propel the market. However, inability to cope-up with the evolving market and cross platform applications hampers the market growth. Moreover, growth in distribution through e-travel platforms boosts the market growth. The Telecom enterprise are setting to become one among the most beneficiaries of the cloud and IoT trade in the upcoming years by receiving massive revenues from varied styles of paid services, accomplishing rise in profit margins building whole of their cloud service environment by the analysis of users wants. Further, the growing factor and shifting business towards the cloud and IoT solutions and services provide a chance for the expansion of medium request and global market major players. The increasing necessity of improved property solution to attach sensible devices and growing from medium and sensible makers to monetize as well as to handle the smart instruments via property are the foremost factors driving the global market growth. Restraints: Lifetime storage and egress prices related to public cloud environments Data across enterprises is exponentially increasing day by day in view to the corporations that are moving towards cloud infrastructure for storing their information. The very fact is the information, which is needed to keep, and access forever cannot be unnoticed. This regards to the matter of lifespan prices related to the economical storing and managing of knowledge. The direct value would possibly seem less however over an amount, the increase in information volume would possibly need to pay a lot within the future to intact the information within the cloud. The increasing information may additionally produce the networking prices and latency problems within the case of retrievals. Most cloud storage vendors charge for the outward information measure with that regular access to keep the information and files would possibly add up to the cloud storage prices. Despite the multiple advantages related to the storage of knowledge on the cloud, the lifespan value restrains data-intensive organizations to completely move the public cloud.

Revenue Management Market Segment Analysis

Based on Component, the market is divided into solutions and services. Among them, the solution phase dominated the market till 2022 and is anticipated to carry a bigger market size throughout the forecast years. The solution phase furthermore unintegrated into billing and payment, worth management, revenue assurance and fraud management, channel management, risk management, others. Out of which, the billing and payment solution will grow at a higher CAGR by 2029 because it permits the enterprises to sustain varied businesses on a single platform by aggregating knowledge from many request tools to generate single invoice.

Regional Insights

The Global Revenue Management Market is segmented region-wise into Asia Pacific, North America, Europe, South America, and Middle East & Africa. North America is expected to be the leading region during the forecast years. North America held the highest xx% market share in 2022 owing to the presence of countries like the United States and North America as well as presence of major key players which are contributing to the growth of the market in the zone. Asia Pacific will also contribute to a good portion of the global management market revenue owing to the presence of small and medium sized enterprises which are switching to technologically advanced revenue management system. The objective of the report is to present a comprehensive analysis of the global market including all the stakeholders of the industry. The past and current status of the industry with forecasted market size and trends are presented in the report with the analysis of complicated data in simple language. The report covers all the aspects of the industry with a dedicated study of key players that includes market leaders, followers and new entrants. PORTER, SVOR, PESTEL analysis with the potential impact of micro-economic factors of the market have been presented in the report. External as well as internal factors that are supposed to affect the business positively or negatively have been analyzed, which will give a clear futuristic view of the industry to the decision-makers. The report also helps in understanding global market dynamics, structure by analyzing the market segments and project the global market size. Clear representation of competitive analysis of key players by Material, price, financial position, Product portfolio, growth strategies, and regional presence in the global market make the report investor’s guide.

Revenue Management Market Scope: Inquire before buying

Revenue Management Market
Base Year 2022 Forecast Period 2023-2029
Historical Data CAGR Market Size in 2022 Market Size in 2029
2018 to 2022 9.7% US$ 18.02 Bn US$ 34.45 Bn
Segments Covered
by Component Solutions Services by Organization size Large Enterprises Small and Medium Enterprises by End User Banking and Financial Services Healthcare Hospitality IT & Telecommunication E-commerce Logistics and Transportation Energy and utilities Travels and Tourism Manufacturing Others
Regions Covered
North America United States Canada Mexico Europe UK France Germany Italy Spain Sweden Austria Rest of Europe Asia Pacific China S Korea Japan India Australia Indonesia Malaysia Vietnam Taiwan Bangladesh Pakistan Rest of APAC Middle East and Africa South Africa GCC Egypt Nigeria Rest of ME&A South America Brazil Argentina Rest of South America

Key Player:

1. Cartrawler 2. Concur Technologies Inc. (SAP) 3. Lemax Inc 4. PAXPORT AB 5. PROS, Inc 6. Radixx International Inc. 7. Revenue Analytics 8. Revenue Matters 9. SAS institute Inc. 10. Airline Software s.r.o 11. Amdocs Inc 12. Oracle Corporation 13. Netcracker Technology Corp, 14. CSG Systems International Inc 15. Ericsson Inc 16. Cerillion Technologies Limited 17. Comviva Technologies Ltd 18. Accenture Inc 19. Enghouse Networks US Inc 20. Accelya Solutions India Ltd 21. HQ Revenue 22. Zuora RevPro Workday 23. Fiserv 24. Apttus 25. Infor, Inc. Frequently Asked Questions: 1. Which region has the largest share in Global Revenue Management Market? Ans: North America region holds the highest share in 2022. 2. What is the growth rate of Global Revenue Management Market? Ans: The Global Revenue Management Market is growing at a CAGR of 9.7% during forecasting period 2023-2029. 3. What segments are covered in Global Revenue Management market? Ans: Global Revenue Management Market is segmented into component, organization size, end user and region. 4. Who are the key players in Global Revenue Management market? Ans: The important key players in the Global Revenue Management Market are – Cartrawler, Concur Technologies Inc., Lemax Inc, PAXPORT AB, PROS, Inc, Radixx International Inc., Revenue Analytics, Revenue Matters. 5. What is the study period of this market? Ans: The Global Revenue Management Market is studied from 2022 to 2029.
1. Revenue Management Market Introduction 1.1. Study Assumption and Market Definition 1.2. Scope of the Study 1.3. Executive Summary 2. Revenue Management Market: Qualitative Analysis 2.1. Emerging technologies for Revenue Management 3. Revenue Management Market: Dynamics 3.1. Revenue Management Market Trends by Region 3.1.1. North America Revenue Management Market Trends 3.1.2. Europe Revenue Management Market Trends 3.1.3. Asia Pacific Revenue Management Market Trends 3.1.4. Middle East and Africa Revenue Management Market Trends 3.1.5. South America Revenue Management Market Trends 3.2. Revenue Management Market Dynamics by Region 3.2.1. North America 3.2.1.1. North America Revenue Management Market Drivers 3.2.1.2. North America Revenue Management Market Restraints 3.2.1.3. North America Revenue Management Market Opportunities 3.2.1.4. North America Revenue Management Market Challenges 3.2.2. Europe 3.2.2.1. Europe Revenue Management Market Drivers 3.2.2.2. Europe Revenue Management Market Restraints 3.2.2.3. Europe Revenue Management Market Opportunities 3.2.2.4. Europe Revenue Management Market Challenges 3.2.3. Asia Pacific 3.2.3.1. Asia Pacific Revenue Management Market Drivers 3.2.3.2. Asia Pacific Revenue Management Market Restraints 3.2.3.3. Asia Pacific Revenue Management Market Opportunities 3.2.3.4. Asia Pacific Revenue Management Market Challenges 3.2.4. Middle East and Africa 3.2.4.1. Middle East and Africa Revenue Management Market Drivers 3.2.4.2. Middle East and Africa Revenue Management Market Restraints 3.2.4.3. Middle East and Africa Revenue Management Market Opportunities 3.2.4.4. Middle East and Africa Revenue Management Market Challenges 3.2.5. South America 3.2.5.1. South America Revenue Management Market Drivers 3.2.5.2. South America Revenue Management Market Restraints 3.2.5.3. South America Revenue Management Market Opportunities 3.2.5.4. South America Revenue Management Market Challenges 3.3. PORTER’s Five Forces Analysis 3.4. PESTLE Analysis 3.5. Regulatory Landscape by Region 3.5.1. North America 3.5.2. Europe 3.5.3. Asia Pacific 3.5.4. Middle East and Africa 3.5.5. South America 3.6. Key Opinion Leader Analysis for Revenue Management Industry 3.7. The Global Pandemic Impact on Revenue Management Market 4. Revenue Management Market: Global Market Size and Forecast by Segmentation (by Value in USD Million) (2023-2030) 4.1. Revenue Management Market Size and Forecast, by Component (2023-2030) 4.1.1. Solutions 4.1.2. Services 4.2. Revenue Management Market Size and Forecast, by Organization size (2023-2030) 4.2.1. Large Enterprises 4.2.2. Small and Medium Enterprises 4.3. Revenue Management Market Size and Forecast, by End User (2023-2030) 4.3.1. Banking and Financial Services 4.3.2. Healthcare 4.3.3. Hospitality 4.3.4. IT & Telecommunication 4.3.5. E-commerce 4.3.6. Logistics and Transportation 4.3.7. Energy and utilities 4.3.8. Travels and Tourism 4.3.9. Manufacturing 4.3.10. Others 4.4. Revenue Management Market Size and Forecast, by region (2023-2030) 4.4.1. North America 4.4.2. Europe 4.4.3. Asia Pacific 4.4.4. Middle East and Africa 4.4.5. South America 5. North America Revenue Management Market Size and Forecast by Segmentation (by Value in USD Million) (2023-2030) 5.1. North America Revenue Management Market Size and Forecast, by Component (2023-2030) 5.1.1. Solutions 5.1.2. Services 5.2. North America Revenue Management Market Size and Forecast, by Organization size (2023-2030) 5.2.1. Large Enterprises 5.2.2. Small and Medium Enterprises 5.3. North America Revenue Management Market Size and Forecast, by End User (2023-2030) 5.3.1. Banking and Financial Services 5.3.2. Healthcare 5.3.3. Hospitality 5.3.4. IT & Telecommunication 5.3.5. E-commerce 5.3.6. Logistics and Transportation 5.3.7. Energy and utilities 5.3.8. Travels and Tourism 5.3.9. Manufacturing 5.3.10. Others 5.4. North America Revenue Management Market Size and Forecast, by Country (2023-2030) 5.4.1. United States 5.4.1.1. United States Revenue Management Market Size and Forecast, by Component (2023-2030) 5.4.1.1.1. Solutions 5.4.1.1.2. Services 5.4.1.2. United States Revenue Management Market Size and Forecast, by Organization size (2023-2030) 5.4.1.2.1. Large Enterprises 5.4.1.2.2. Small and Medium Enterprises 5.4.1.3. United States Revenue Management Market Size and Forecast, by End User (2023-2030) 5.4.1.3.1. Banking and Financial Services 5.4.1.3.2. Healthcare 5.4.1.3.3. Hospitality 5.4.1.3.4. IT & Telecommunication 5.4.1.3.5. E-commerce 5.4.1.3.6. Logistics and Transportation 5.4.1.3.7. Energy and utilities 5.4.1.3.8. Travels and Tourism 5.4.1.3.9. Manufacturing 5.4.1.3.10. Others 5.4.2. Canada 5.4.2.1. Canada Revenue Management Market Size and Forecast, by Component (2023-2030) 5.4.2.1.1. Solutions 5.4.2.1.2. Services 5.4.2.2. Canada Revenue Management Market Size and Forecast, by Organization size (2023-2030) 5.4.2.2.1. Large Enterprises 5.4.2.2.2. Small and Medium Enterprises 5.4.2.3. Canada Revenue Management Market Size and Forecast, by End User (2023-2030) 5.4.2.3.1. Banking and Financial Services 5.4.2.3.2. Healthcare 5.4.2.3.3. Hospitality 5.4.2.3.4. IT & Telecommunication 5.4.2.3.5. E-commerce 5.4.2.3.6. Logistics and Transportation 5.4.2.3.7. Energy and utilities 5.4.2.3.8. Travels and Tourism 5.4.2.3.9. Manufacturing 5.4.2.3.10. Others 5.4.3. Mexico 5.4.3.1. Mexico Revenue Management Market Size and Forecast, by Component (2023-2030) 5.4.3.1.1. Solutions 5.4.3.1.2. Services 5.4.3.2. Mexico Revenue Management Market Size and Forecast, by Organization size (2023-2030) 5.4.3.2.1. Large Enterprises 5.4.3.2.2. Small and Medium Enterprises 5.4.3.3. Mexico Revenue Management Market Size and Forecast, by End User (2023-2030) 5.4.3.3.1. Banking and Financial Services 5.4.3.3.2. Healthcare 5.4.3.3.3. Hospitality 5.4.3.3.4. IT & Telecommunication 5.4.3.3.5. E-commerce 5.4.3.3.6. Logistics and Transportation 5.4.3.3.7. Energy and utilities 5.4.3.3.8. Travels and Tourism 5.4.3.3.9. Manufacturing 5.4.3.3.10. Others 6. Europe Revenue Management Market Size and Forecast by Segmentation (by Value in USD Million) (2023-2030) 6.1. Europe Revenue Management Market Size and Forecast, by Component (2023-2030) 6.2. Europe Revenue Management Market Size and Forecast, by Organization size (2023-2030) 6.3. Europe Revenue Management Market Size and Forecast, by End User (2023-2030) 6.4. Europe Revenue Management Market Size and Forecast, by Country (2023-2030) 6.4.1. United Kingdom 6.4.1.1. United Kingdom Revenue Management Market Size and Forecast, by Component (2023-2030) 6.4.1.2. United Kingdom Revenue Management Market Size and Forecast, by Organization size (2023-2030) 6.4.1.3. United Kingdom Revenue Management Market Size and Forecast, by End User(2023-2030) 6.4.2. France 6.4.2.1. France Revenue Management Market Size and Forecast, by Component (2023-2030) 6.4.2.2. France Revenue Management Market Size and Forecast, by Organization size (2023-2030) 6.4.2.3. France Revenue Management Market Size and Forecast, by End User(2023-2030) 6.4.3. Germany 6.4.3.1. Germany Revenue Management Market Size and Forecast, by Component (2023-2030) 6.4.3.2. Germany Revenue Management Market Size and Forecast, by Organization size (2023-2030) 6.4.3.3. Germany Revenue Management Market Size and Forecast, by End User (2023-2030) 6.4.4. Italy 6.4.4.1. Italy Revenue Management Market Size and Forecast, by Component (2023-2030) 6.4.4.2. Italy Revenue Management Market Size and Forecast, by Organization size (2023-2030) 6.4.4.3. Italy Revenue Management Market Size and Forecast, by End User(2023-2030) 6.4.5. Spain 6.4.5.1. Spain Revenue Management Market Size and Forecast, by Component (2023-2030) 6.4.5.2. Spain Revenue Management Market Size and Forecast, by Organization size (2023-2030) 6.4.5.3. Spain Revenue Management Market Size and Forecast, by End User (2023-2030) 6.4.6. Sweden 6.4.6.1. Sweden Revenue Management Market Size and Forecast, by Component (2023-2030) 6.4.6.2. Sweden Revenue Management Market Size and Forecast, by Organization size (2023-2030) 6.4.6.3. Sweden Revenue Management Market Size and Forecast, by End User (2023-2030) 6.4.7. Austria 6.4.7.1. Austria Revenue Management Market Size and Forecast, by Component (2023-2030) 6.4.7.2. Austria Revenue Management Market Size and Forecast, by Organization size (2023-2030) 6.4.7.3. Austria Revenue Management Market Size and Forecast, by End User (2023-2030) 6.4.8. Rest of Europe 6.4.8.1. Rest of Europe Revenue Management Market Size and Forecast, by Component (2023-2030) 6.4.8.2. Rest of Europe Revenue Management Market Size and Forecast, by Organization size (2023-2030) 6.4.8.3. Rest of Europe Revenue Management Market Size and Forecast, by End User (2023-2030) 7. Asia Pacific Revenue Management Market Size and Forecast by Segmentation (by Value in USD Million) (2023-2030) 7.1. Asia Pacific Revenue Management Market Size and Forecast, by Component (2023-2030) 7.2. Asia Pacific Revenue Management Market Size and Forecast, by Organization size (2023-2030) 7.3. Asia Pacific Revenue Management Market Size and Forecast, by End User (2023-2030) 7.4. Asia Pacific Revenue Management Market Size and Forecast, by Country (2023-2030) 7.4.1. China 7.4.1.1. China Revenue Management Market Size and Forecast, by Component (2023-2030) 7.4.1.2. China Revenue Management Market Size and Forecast, by Organization size (2023-2030) 7.4.1.3. China Revenue Management Market Size and Forecast, by End User (2023-2030) 7.4.2. S Korea 7.4.2.1. S Korea Revenue Management Market Size and Forecast, by Component (2023-2030) 7.4.2.2. S Korea Revenue Management Market Size and Forecast, by Organization size (2023-2030) 7.4.2.3. S Korea Revenue Management Market Size and Forecast, by End User (2023-2030) 7.4.3. Japan 7.4.3.1. Japan Revenue Management Market Size and Forecast, by Component (2023-2030) 7.4.3.2. Japan Revenue Management Market Size and Forecast, by Organization size (2023-2030) 7.4.3.3. Japan Revenue Management Market Size and Forecast, by End User (2023-2030) 7.4.4. India 7.4.4.1. India Revenue Management Market Size and Forecast, by Component (2023-2030) 7.4.4.2. India Revenue Management Market Size and Forecast, by Organization size (2023-2030) 7.4.4.3. India Revenue Management Market Size and Forecast, by End User (2023-2030) 7.4.5. Australia 7.4.5.1. Australia Revenue Management Market Size and Forecast, by Component (2023-2030) 7.4.5.2. Australia Revenue Management Market Size and Forecast, by Organization size (2023-2030) 7.4.5.3. Australia Revenue Management Market Size and Forecast, by End User (2023-2030) 7.4.6. Indonesia 7.4.6.1. Indonesia Revenue Management Market Size and Forecast, by Component (2023-2030) 7.4.6.2. Indonesia Revenue Management Market Size and Forecast, by Organization size (2023-2030) 7.4.6.3. Indonesia Revenue Management Market Size and Forecast, by End User (2023-2030) 7.4.7. Malaysia 7.4.7.1. Malaysia Revenue Management Market Size and Forecast, by Component (2023-2030) 7.4.7.2. Malaysia Revenue Management Market Size and Forecast, by Organization size (2023-2030) 7.4.7.3. Malaysia Revenue Management Market Size and Forecast, by End User (2023-2030) 7.4.8. Vietnam 7.4.8.1. Vietnam Revenue Management Market Size and Forecast, by Component (2023-2030) 7.4.8.2. Vietnam Revenue Management Market Size and Forecast, by Organization size (2023-2030) 7.4.8.3. Vietnam Revenue Management Market Size and Forecast, by End User(2023-2030) 7.4.9. Taiwan 7.4.9.1. Taiwan Revenue Management Market Size and Forecast, by Component (2023-2030) 7.4.9.2. Taiwan Revenue Management Market Size and Forecast, by Organization size (2023-2030) 7.4.9.3. Taiwan Revenue Management Market Size and Forecast, by End User (2023-2030) 7.4.10. Rest of Asia Pacific 7.4.10.1. Rest of Asia Pacific Revenue Management Market Size and Forecast, by Component (2023-2030) 7.4.10.2. Rest of Asia Pacific Revenue Management Market Size and Forecast, by Organization size (2023-2030) 7.4.10.3. Rest of Asia Pacific Revenue Management Market Size and Forecast, by End User (2023-2030) 8. Middle East and Africa Revenue Management Market Size and Forecast by Segmentation (by Value in USD Million) (2023-2030) 8.1. Middle East and Africa Revenue Management Market Size and Forecast, by Component (2023-2030) 8.2. Middle East and Africa Revenue Management Market Size and Forecast, by Organization size (2023-2030) 8.3. Middle East and Africa Revenue Management Market Size and Forecast, by End User (2023-2030) 8.4. Middle East and Africa Revenue Management Market Size and Forecast, by Country (2023-2030) 8.4.1. South Africa 8.4.1.1. South Africa Revenue Management Market Size and Forecast, by Component (2023-2030) 8.4.1.2. South Africa Revenue Management Market Size and Forecast, by Organization size (2023-2030) 8.4.1.3. South Africa Revenue Management Market Size and Forecast, by End User (2023-2030) 8.4.2. GCC 8.4.2.1. GCC Revenue Management Market Size and Forecast, by Component (2023-2030) 8.4.2.2. GCC Revenue Management Market Size and Forecast, by Organization size (2023-2030) 8.4.2.3. GCC Revenue Management Market Size and Forecast, by End User (2023-2030) 8.4.3. Nigeria 8.4.3.1. Nigeria Revenue Management Market Size and Forecast, by Component (2023-2030) 8.4.3.2. Nigeria Revenue Management Market Size and Forecast, by Organization size (2023-2030) 8.4.3.3. Nigeria Revenue Management Market Size and Forecast, by End User (2023-2030) 8.4.4. Rest of ME&A 8.4.4.1. Rest of ME&A Revenue Management Market Size and Forecast, by Component (2023-2030) 8.4.4.2. Rest of ME&A Revenue Management Market Size and Forecast, by Organization size (2023-2030) 8.4.4.3. Rest of ME&A Revenue Management Market Size and Forecast, by End User (2023-2030) 9. South America Revenue Management Market Size and Forecast by Segmentation (by Value in USD Million) (2023-2030) 9.1. South America Revenue Management Market Size and Forecast, by Component (2023-2030) 9.2. South America Revenue Management Market Size and Forecast, by Organization size (2023-2030) 9.3. South America Revenue Management Market Size and Forecast, by End User(2023-2030) 9.4. South America Revenue Management Market Size and Forecast, by Country (2023-2030) 9.4.1. Brazil 9.4.1.1. Brazil Revenue Management Market Size and Forecast, by Component (2023-2030) 9.4.1.2. Brazil Revenue Management Market Size and Forecast, by Organization size (2023-2030) 9.4.1.3. Brazil Revenue Management Market Size and Forecast, by End User (2023-2030) 9.4.2. Argentina 9.4.2.1. Argentina Revenue Management Market Size and Forecast, by Component (2023-2030) 9.4.2.2. Argentina Revenue Management Market Size and Forecast, by Organization size (2023-2030) 9.4.2.3. Argentina Revenue Management Market Size and Forecast, by End User (2023-2030) 9.4.3. Rest Of South America 9.4.3.1. Rest Of South America Revenue Management Market Size and Forecast, by Component (2023-2030) 9.4.3.2. Rest Of South America Revenue Management Market Size and Forecast, by Organization size (2023-2030) 9.4.3.3. Rest Of South America Revenue Management Market Size and Forecast, by End User (2023-2030) 10. Global Revenue Management Market: Competitive Landscape 10.1. MMR Competition Matrix 10.2. Competitive Landscape 10.3. Key Players Benchmarking 10.3.1. Company Name 10.3.2. Business Segment 10.3.3. End-user Segment 10.3.4. Revenue (2023) 10.3.5. Company Locations 10.4. Leading Revenue Management Market Companies, by market capitalization 10.5. Market Structure 10.5.1. Market Leaders 10.5.2. Market Followers 10.5.3. Emerging Players 10.6. Mergers and Acquisitions Details 11. Company Profile: Key Players 11.1. Cartrawler 11.1.1. Company Overview 11.1.2. Business Portfolio 11.1.3. Financial Overview 11.1.4. SWOT Analysis 11.1.5. Strategic Analysis 11.1.6. Recent Developments 11.2. Concur Technologies Inc. (SAP) 11.3. Lemax Inc 11.4. PAXPORT AB 11.5. PROS, Inc 11.6. Radixx International Inc. 11.7. Revenue Analytics 11.8. Revenue Matters 11.9. SAS institute Inc. 11.10. Airline Software s.r.o 11.11. Amdocs Inc 11.12. Oracle Corporation 11.13. Netcracker Technology Corp, 11.14. CSG Systems International Inc 11.15. Ericsson Inc 11.16. Cerillion Technologies Limited 11.17. Comviva Technologies Ltd 11.18. Accenture Inc 11.19. Enghouse Networks US Inc 11.20. Accelya Solutions India Ltd 11.21. HQ Revenue 11.22. Zuora RevPro Workday 11.23. Fiserv 11.24. Apttus 12. Key Findings 13. Industry Recommendations 14. Revenue Management Market: Research Methodology
  • INQUIRE BEFORE BUYING