
Global Printed Battery Market Size by Components, Application, End User and Region – Segment-Level Market Assessment, Growth Opportunity Analysis, Competitive Mapping & Forecast to 2030
Overview
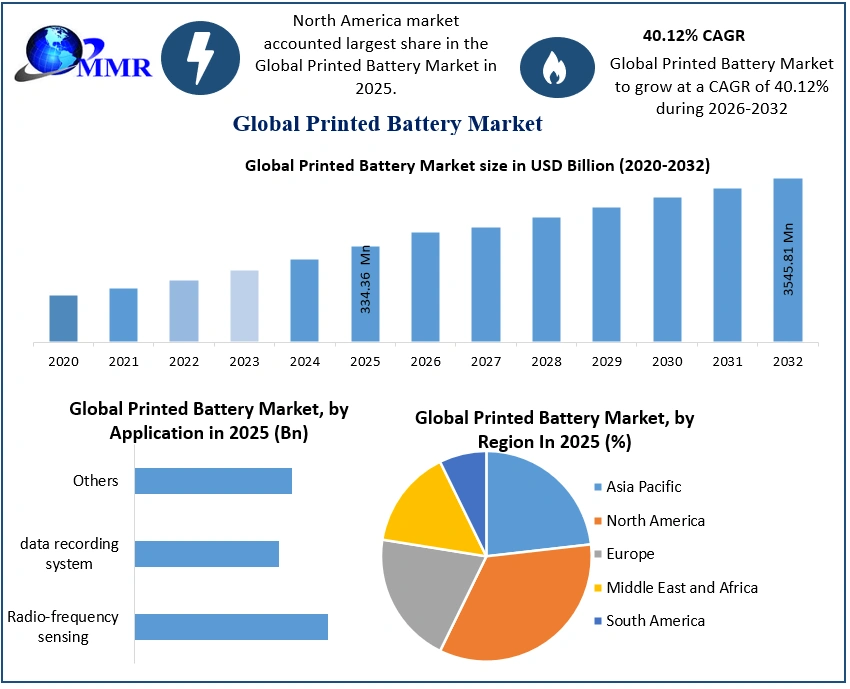
The Printed Battery Market size was valued at USD 334.36 Million in 2025 and the total Printed Battery revenue is expected to grow at a CAGR of 40.12% from 2026 to 2032, reaching nearly USD 3545.81 Million by 2032.
Printed Battery Market: Overview
The continuous advancement in smart and wearable electronic devices and the corresponding growth of advanced technology boost the Printed Battery Market growth. The improved integration of batteries with different devices is expected to boost market growth. New printed battery demand is significantly growing due to their interesting characteristics such as flexibility, low cost, thinness, and eco-friendliness. The increasing number of applications in radio frequency identification, portable medical diagnosis systems, sensors, and smart cards fuelled the market.
There is a noticeable increase in sales of small electrical circuitry for objects of daily use like, smart objects, stand-alone sensors, and active and RFIDs these factors help to propel the rapid growth of the market. The graphical representation and structural exclusive information showed the dominating region of the Global Printed Battery Market. The detailed and constructive formation of key drivers, opportunities, and unique segmentation outputs structural and optimistic data. Validated using primary as well as secondary research methodology and scope of the Global Printed Battery Market.
To know about the Research Methodology :- Request Free Sample Report
Printed Battery Market Dynamics
Increasing demand from the healthcare industry boosts the market growth
The Printed Battery Market is experiencing significant growth, driven by increased demand from the healthcare industry. The healthcare sector has become a hotbed of opportunities for printed batteries, with applications spanning various medical services, technologies, and products aimed at enhancing human health. These innovations often rely on printed batteries to power wearable medical devices, biometric sensors, e-stimulation sensors, and flexible printed heaters. The surge in demand for disposable medical devices equipped with micro power batteries is a substantial driver of market growth. Additionally, the rising need for IoT devices in smart utilities and healthcare applications fuels the innovation and development of wearable and flexible healthcare electronics, where printed batteries play a crucial role.
The market benefits from the adoption of printed batteries in wireless health monitoring devices such as continuous glucose monitors, pacemakers, fitness trackers, and hearing assistance devices, further contributing to its growth. Printed Battery Market printed zinc paper batteries are making inroads in electronics, electronic skins, and energy storage systems, offering cost-effective and high-capacity alternatives to traditional lithium-ion batteries. With the portable and wearable medical device and electronics industry rapidly expanding, the demand for affordable and durable printed batteries is expected to remain robust.
The market for printed batteries is witnessing growth propelled by the increasing adoption of IoT applications. Printed batteries, known for their thin, lightweight, and flexible nature, offer cost-effective solutions for industrial wireless sensors and IoT applications. Innovative technologies like TAeTTOOz enable flexible, rechargeable, and solid-state industrial printed batteries. One of the primary challenges facing the printed battery industry is achieving higher energy density. While printed batteries are now integrated into a wide range of electronic and electric devices, their energy density remains a limitation. Printed Battery Market1 The industry is continuously advancing, with notable progress in 3D printing of batteries and overall printing technology.
These advancements aim to enhance the features of printed batteries, including long-term durability, safety, high energy capacity, and high power density. Despite these improvements, printed batteries still exhibit lower energy density compared to traditional counterparts. This limitation can hinder the application of printed batteries in devices that require substantial storage capacity and energy density, potentially affecting market growth.
Printed Battery Market Segment Analysis
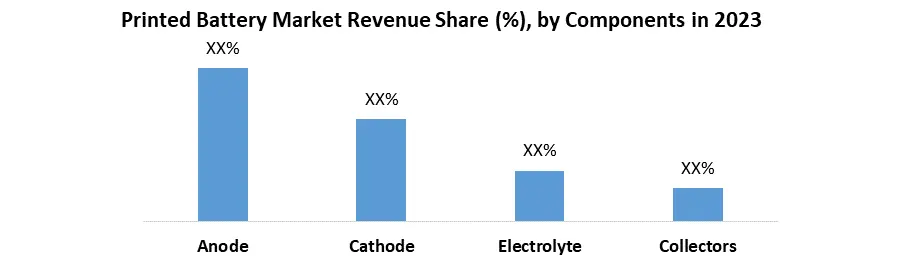
In the Printed Battery Market, the anode segment currently dominates, holding the largest market share. This prominence is attributed to the higher complexity involved in designing anodes for printed batteries, requiring extensive research and development efforts for specialized materials and processing methods. Anodes offer a broader variety of materials compared to other components, with ongoing exploration of lithium alloys, silicon-based compounds, and metal oxides. The emphasis on capacity improvement in printed batteries further amplifies the significance of the anode segment, as optimized anode materials directly impact overall battery capacity. While the printed battery market is in its early stages, the anode's current dominance may shift in the future as other components mature and contribute breakthroughs to overall battery performance and cost-effectiveness.
 Printed Battery Market Regional Analysis
North America has experienced remarkable growth in the printed battery market, attributed to several key factors. The region boasts a robust technological landscape with significant advancements in printed battery technology. The proliferation of wearable devices and the demand for cutting-edge power solutions have fuelled the rapid adoption of printed batteries in North America. These batteries play a pivotal role in a diverse range of applications, including healthcare devices, IoT sensors, and industrial wireless systems. The healthcare sector in North America is at the forefront of integrating printed batteries into medical wearables and remote patient monitoring devices, propelling market growth. The presence of major technology companies and ongoing research and development activities further strengthen the market's potential.
Europe mirrors the trajectory of North America in the printed battery market. The region places a strong emphasis on sustainable technologies and continues to advance flexible printed battery solutions. European countries are actively investing in research and development to enhance the energy storage capabilities of printed batteries. This commitment has led to the widespread use of printed batteries in healthcare applications, particularly in wearable health monitoring devices. Additionally, the European automotive industry is exploring the integration of printed batteries into electric vehicles, optimizing energy storage and reducing the carbon footprint. Sustainability and innovation are driving forces behind the market's growth and potential in Europe.
The Asia Pacific region has risen as a significant player in the global printed battery market, driven by its distinctive characteristics and evolving consumer preferences. The region's robust electronics industry has led to a surge in demand for compact and flexible energy storage solutions, propelling the adoption of printed batteries. Furthermore, countries in Asia Pacific are witnessing a rapid influx of wearable technology, especially in healthcare and consumer electronics. The demand for lightweight and efficient energy solutions in wearables has created substantial market potential. With a strong focus on environmentally friendly technologies and the need for efficient power solutions, Asia Pacific significantly contributes to the global printed battery market's growth.
Printed Battery Market Competitive Landscape
Enfucell makes a significant stride in the Printed Battery market with the introduction of the WithMe app designed for use with their Wearable Temperature Tag. Available for download on the Google Play Store, WithMe enables users to read real-time temperature data from Enfucell's Wearable Temperature Tag using mobile devices with NFC functionality. The app offers versatile functions such as tag activation, stopping temperature measurements, parameter configuration, and historical data queries/exporting. This move underscores Enfucell's commitment to practical temperature monitoring solutions.
Meanwhile, Bloomberg Green features Imprint Energy, a Silicon Valley startup at the forefront of the Printed Battery market. Imprint Energy utilizes screen printing tools to mass-produce batteries, notably powering shipping labels for tracking goods' movement, temperature, and humidity exposure. The interview with founder Christine Ho highlights Imprint Energy's journey, emphasizing the potential of their glue-like ZinCore® batteries to reduce waste and emissions significantly. Imprint Energy's innovations, poised to enhance power density, have broad applications in the IoT, medical devices, pharmaceuticals, agriculture, and wearables, further propelling the transformative impact of the Printed Battery market.
Printed Battery Market Scope: Inquire before buying
| Global Printed Battery Market | |||
|---|---|---|---|
| Report Coverage | Details | ||
| Base Year: | 2025 | Forecast Period: | 2026-2032 |
| Historical Data: | 2020 to 2025 | Market Size in 2025: | USD 334.36 Mn. |
| Forecast Period 2026 to 2032 CAGR: | 40.12% | Market Size in 2032: | USD 3545.81 Mn. |
| Segments Covered: | By Components | Anode Cathode Electrolyte Collectors |
|
| By Application | Radio-frequency sensing data recording system Others |
||
| By End Use | Packing Consumer electronics Wearable Devices Pharmaceuticals and Healthcare Packaging Others |
||
Printed Battery Market, by Region
North America (United States, Canada and Mexico)
Europe (UK, France, Germany, Italy, Spain, Sweden, Austria and Rest of Europe)
Asia Pacific (China, South Korea, Japan, India, Australia, Indonesia, Malaysia, Vietnam, Taiwan, Bangladesh, Pakistan and Rest of APAC)
Middle East and Africa (South Africa, GCC, Egypt, Nigeria and Rest of ME&A)
South America (Brazil, Argentina Rest of South America)
Printed Battery Market, Key Players are:
1. Enfucell Oy Ltd.
2. Samsung
3. Ultralife Corporation
4. LG Chem Ltd
5. BrightVolt Inc.
6. Imprint Energy
7. Printed Energy
8. Printed Electronics Ltd
9. Prelonic Technologies
10. Varta AG.
11. Sakuu Corporation.
12. Photocentric Group
13. InnovationLab GmbH
FAQs
1] What is the growth rate of the Printed Battery Market?
Ans. The Global market is growing at a significant rate of 40.12 % over the forecast period.
2] Which region is expected to dominate the Printed Battery Market?
Ans. North America region is expected to dominate the market over the forecast period.
3] What is the expected Global Printed Battery Market size by 2032?
Ans. The market size of the market is expected to reach USD 3545.81 Million by 2032.
4] Who are the top players in the Printed Battery Market?
Ans. The major key players in the Global market are Enfucell Oy Ltd., Samsung, Ultralife Corporation, LG Chem Ltd, BrightVolt Inc, and Imprint Energy.
5] Which factors are expected to drive the Printed Battery Market growth by 2030?
Ans. The growth of the market is expected to be driven by increasing demand for flexible and lightweight energy solutions in applications like IoT devices, wearable’s, and medical implants, coupled with advancements in printable electronics technology. Additionally, the growing focus on eco-friendly and cost-effective energy storage solutions is anticipated to fuel market expansion.
6] What is the Printed Battery Market's current growth rate?
Ans. The market is experiencing significant growth, driven by technological advancements and increased demand for flexible energy solutions in various industries.
7] Which regions are key players in the Printed Battery Market?
Ans. North America, Europe, and Asia Pacific are prominent regions contributing to the growth and innovation in the market.
8] What types of printed batteries dominate the market in 2025?
Ans. Rechargeable printed batteries based on redox-active polymer technology are the dominant type, offering thin, flexible, and cost-effective energy storage solutions.
9] What printing techniques are commonly used for printed batteries?
Ans. Screen printing, inkjet printing, and flexographic printing are common techniques employed for manufacturing printed batteries, with screen printing leading the way.
10] What applications are driving the demand for printed batteries?
Ans. Healthcare devices, wearable technology, and the Internet of Things (IoT) are key applications fueling the demand for printed batteries.